Pesticides in streams and subsurface drainage water within two arable catchments in Denmark: Pesticide application, concentration, transport and fate
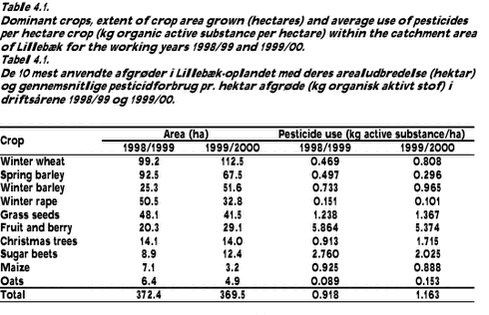
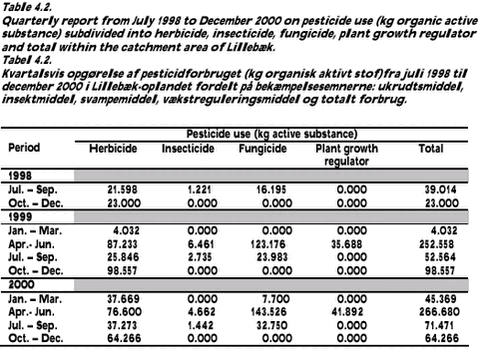
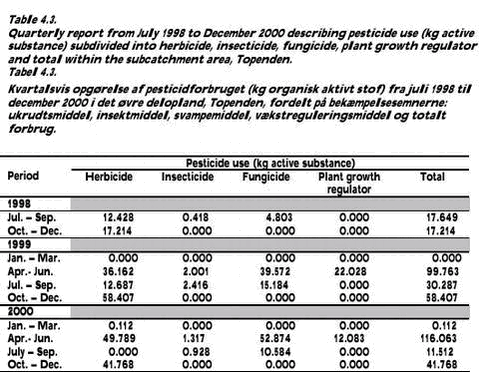
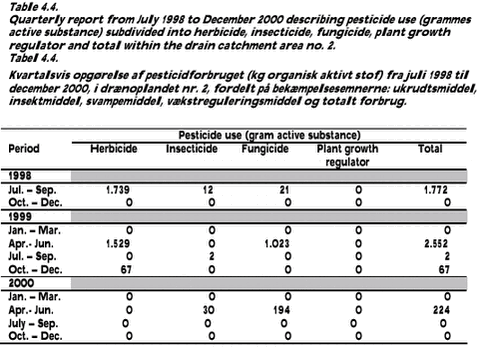
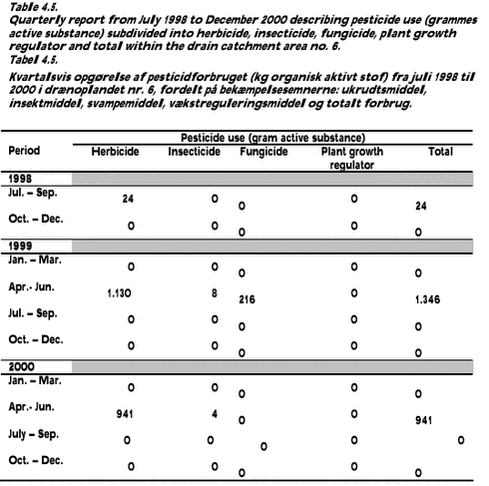
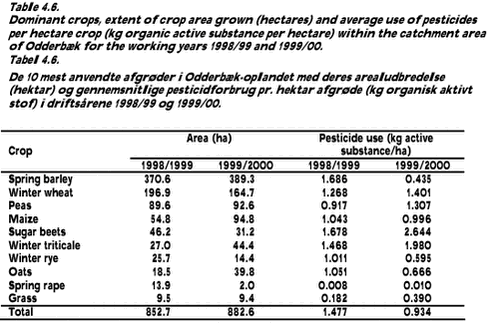
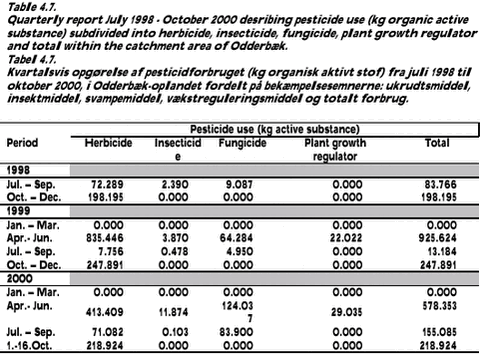
4 Crop types and pesticide application in the catchments4.1 Lillebæk catchment4.2 Odderbæk catchment Farm practices in the Lillebæk and Odderbæk catchments are followed by annual interviews of farmers in the area. The interviews provide detailed information about each field within the catchment area, including information about field size, crop grown and treatments in the field, such as use of manure, fertilizer and pesticides, with a specification of time and quantity. 4.1 Lillebæk catchmentThere were 29 farmers with fields within the catchment area in the agricultural year 1998/1999 and 27 in 1999/2000. The ten most cultured crops in the working years 1998/1999 and 1999/2000 are shown in Table 4.1. These ten crops constitute about 90 – 95 % of the agricultural area grown in the catchment area. Winter crops, such as rape and cereals make up 45 – 48 % of the agricultural area grown. Compared to the rest of Denmark, the Lillebæk catchment area has a relatively high share of area grown with Christmas trees, fruit trees and berries. Table 4.1 shows the use of pesticides for the ten most cultivated crops. These data show the average quantity of active substances used for each crop within a working year. The data only include the use of active organic substances and not inorganic substances, such as sulphur, copper and boron. The data show pronounced differences in the amount of pesticide use between crops with rather high pesticide use for sugar beets, fruits and berries. Generally, each crop also shows variation in the amount of pesticide used between years. The large increase in the use of pesticides to winter wheat between 1998/1999 and 1999/2000 is possibly due to the wet winter of 1998/1999 causing increased application of fungicides to winter crops. The reduction in the use of pesticides to spring barley from 1998/1999 to 1999/2000 is undoubtedly caused by the spring of the latter year being much dryer than the previous year. The consumption of pesticides used within the catchment of Lillebæk is calculated on a quarterly basis from July 1998 to December 2000 (Table 4.2 and Appendix 4.1). More than half of the total annual amount of pesticides used is sprayed onto the fields during the period April - June. Futhermore, Table 4.2 shows the quantity of pesticides used as herbicide, insecticide, fungicide and plant growth regulator. Herbicides and fungicides are used in high amounts compared the use of plant growth regulators and insecticides. Although herbicides are used throughout the year, most are used in spring and autumn. Fungicides are mainly used from April to June. The use of fungicides is somewhat lower between July and September and little or no fungicide is used in the period October – March. Insecticides are used from April to September whereas plant growth regulators are used only between April and June. Table 4.3 and Appendix 4.2 show the quantity of pesticides used within the upper sub-catchment of Lillebæk on a quarterly basis from July 1998 to December 2000. Table 4.4 and Table 4.5 shows the consumption of pesticides within drain catchment area 2 and 6, respectively. The total use of pesticides in the two drain catchments is somewhat low due to the small size of the drain catchment areas. Each drain catchment area covers partly two to three fields. Therefore, the spraying of pesticides occurs during a more restricted period (one to two quarters of the year) than in the catchment area of Lillebæk. Herbicides, insecticides and fungicides are used on both drain catchments in the period July 1998 to December 2000, whereas plant growth regulators are not used. 4.2 Odderbæk catchmentThere were 26 farmers with fields within the catchment area in both agricultural years (1998/1999 and 1999/2000). The ten most cultured crops in the working years 1998/1999 and 1999/2000 are shown in Table 4.6. These ten crops constitute about 90 – 93 % of the agricultural area grown in the catchment area. Winter crops, such as rape and cereals make up 28 – 27 % of the agricultural area grown. Compared to the rest of Denmark, the Odderbæk catchment area has a relatively large area grown with peas. Table 4.6 shows the consumption of pesticides for the ten most cultivated crops. These data show the average quantity of active substances used for each crop within a working year. The data include only the use of active organic substances and not inorganic substances, such as sulphur, copper and boron. There are only moderate differences in the consumption of pesticides between crops with the highest pesticide use for spring barley and maize. Generally, each crop also shows variation in the pesticideconsumption between years. Pesticide consumption within the catchment of Odderbæk is made up on a quarterly basis from July 1998 to mid-October 2000 (Table 4.7). More than half of the total annual consumption of pesticides is sprayed onto the fields during the period April - June. Futhermore, Table 4.7 shows the quantity of pesticides used as herbicide, insecticide, fungicide and plant growth regulator. Herbicides and fungicides are used in high amounts compared to plant growth regulators and insecticides. Herbicides are mostly used in spring and autumn. The highest consumption of fungicides is from April to June. There are considerable year-to-year variations in the use of fungicides between July and September. Fungicides are not used in the period October – March. Insecticides are used from April to September whereas plant growth regulators are only used from April to June. |
