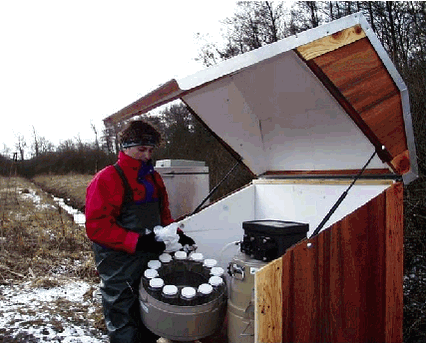
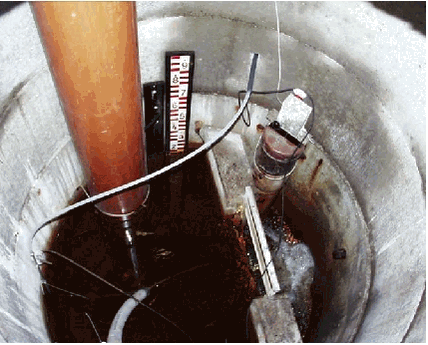
Pesticides in streams and subsurface drainage water within two arable catchments in Denmark: Pesticide application, concentration, transport and fate3 Methods3.1 Field sampling and measurements3.2 Laboratory analysis 3.2.1 Analysis of pesticides in water samples 3.2.2 Analysis of pesticides in sediment 3.3 Transport estimation and statistical analysis 3.1 Field sampling and measurementsThe catchments, Lillebæk on Funen, Denmark (4.65 km2), and Odderbæk in northern Jutland, Denmark (11.43 km2) were selected as study areas. Both catchments are included in the Danish Nationwide Monitoring Programme under the Action Plan on the Aquatic Environment. In the Lillebæk catchment, four pesticide monitoring stations were installed during the two study years 1999 and 2000. Two stream monitoring stations were installed, one covering the water and pesticide loss from two upper subcatchments (435 ha) and one covering the upstream culverted sub-catchment of 229 ha (see chapter 2). Moreover, two drain stations were installed covering catchment areas of 4.2 and 2.1 hectares, respectively. In the Odderbæk catchment we have installed two pesticide monitoring stations consisting of one stream station covering the entire catchment (1143 ha) and one drain station covering a sub-catchment of 32 hectares. At all monitoring stations water stage was recorded continuously and stored on a datalogger. Discharge was measured at regular intervals at each stream and drain station, which enabled the establishment of stage-discharge relationships for the stream stations, and V-notsch weir-formulas for the drain stations. Instantaneous discharge has thus been calculated for each station. Each pesticide monitoring station had an automatic ISCO-sampler installed where each sampler was linked to a mechanical contact switch, which initiated water sampling at a predetermined rise in water level. Each pesticide monitoring station consisted of an automatic ISCO-sampler (2700 for drain stations and 3700 for stream stations) (see photo 3.1 and photo 3.2). The drain station samplers had 24 x 300-ml glass bottles and the stream stations had 12 x 900-ml glass bottles. The monitoring stations were visited at least once a week and the contact switch was thenadjusted according to the water stage of that time. The predetermined rise in water level initiating the samplers was 5-10 cm at the three stream stations and 2-3 cm at the three drain stations. Normally, the contact switch was set at lowest rise in water level during low-flow periods and at the highest rise in water level during high-flow periods.
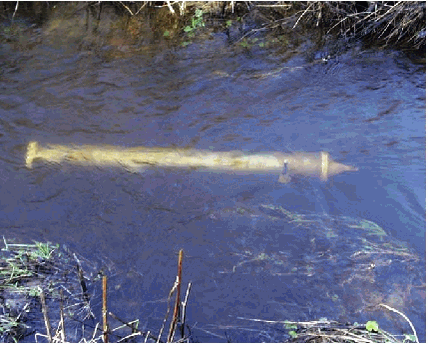
The stream and drain monitoring stations undertook a pre-programmed time-proportional sampling during each event covering 24 hours. Sampling was conducted every two hours at stream stations and every hour at drain stations. The sampling programme makes it possible to both analyse a composite water sample covering the entire storm event and to analyse water samples taken at predetermined times during the storm event. The sampling programme thus made it possible to both determine total pesticide losses during storm events (spates) and to investigate maximum concentrations and losses at a certain time or stage during a specific event. Based on an on-line permission to extract data by telephone from the stage-recorders at all stations, we decided how to pool water samples and in some cases to store water samples as single point samples for each storm event. In order to cover the presence and transport of pesticides during periods without precipitation (both rain and snow), point samples were manually taken in 1000 ml glass bottles during different times of the year at all stream and drain stations. All water samples were transported to the laboratory in Silkeborg. On return to the laboratory the water samples were kept at 5 C, and conserved within 1-2 days. Glass bottles were cleaned according to the technical description given for NOVA 1998-2003 (Kronvang et al., 1999), which includes an ignition at 450o C. The pesticide analysis required one water sample of approx. 1000 ml. Conservation of the water samples kept for pesticide analysis was conducted at the laboratory by solid phase extraction (SPE) (Vejrup & Ljungqvist, 1998). The dissolved pesticide and part of the sediment or organically bound pesticides were retained this way, and kept frozen until laboratory analysis. In order to determine the fate of pesticides in the streams we collected samples of the upper fine (< 250 Êm) and newly accumulated streambed sediment by means of a kajak-corer. Sediment samples were collected from two sub-reaches of the Lillebæk stream and one sub-reach of the Odderbæk stream. Sediment samples were brought to the laboratory and kept frozen until analysis. For storm event samples with high concentrations of suspended sediment, the suspended sediment was saved for pesticide analysis. A special sampling device called SubMarie designed for separating suspended sediment and colloids from stream and drain water was installed at the three stream stations (see photo 3.3). The suspended sediment sampler enabled us to extract suspended sediment and colloids during different periods of the year. We collected composite suspended sediment samples at almost monthly intervals during the year of 2000. All sediment samples (streambed sediment and suspended sediment) were brought to the laboratory and kept frozen until analysis. Water samples were analysed for 49 different pesticides and metabolites. The streambed sediment samples and suspended sediment samples were analysed for 19 pesticides. 3.2 Laboratory analysis3.2.1 Analysis of pesticides in water samplesAnalysis of pesticides is a multi-step process including 1) Pre-concentration by solid phase extraction (SPE) Step 1 was carried out within 1-2 days after the water samples were collected. As part of the quality control one blank and two recovery samples were prepared with each batch of samples as described below. SPE cartridges were kept frozen until they were eluted. Sample preparation was carried out in the same way for all samples while the LC/MS analysis was carried out on either of two instruments. The analytical method utilised was adapted from existing LC/MS multimethods (Køppen & Spliid 1998, Vejrup & Lundquist 1998 and Bossi et al. 2002.).
Chemicals
Sample cleanup
LC/MS/MS analysis
LC/MS/MS System 1: The acidic pesticides were analysed with the ESI-inlet (Electro Spray Ionization) in negative mode (Spray voltage 5 kV and Capillary temperature 250°C) using an A-eluent of 10:90 methanol/20 mM acetic acid and an B-eluent of 20 mM acetic acid in methanol. For the neutral and basic pesticides, the APCI-inlet (Atmospheric Pressure Chemical Ionization) was used in positive mode (Corona current 5 μA, Vaporizer temperature 500°C and Capillary temperature 170°C). The A-eluent was 1:99 methanol/10 mM Ammonium acetate and the B-eluent was 10 % Ammonium acetate in methanol. All analyses were done using time scheduled SIM-mode (Single Ion Monitoring) and all findings were verified by using LC/MS/MS and corrected for recovery.
LC/MS/MS System 2: For separation of acid pesticides, mobile phase A was 10:90 methanol/water with 0.1% acetic acid added, and mobile phase B was 100% methanol with 0.1% acetic acid added. For separation of neutral pesticides, mobile phase A was 1:99 methanol/5 mM ammonium acetate with 0.1% formic acid added, and mobile phase B was 90:10 methanol/5 mM ammonium acetate with 0.1% formic acid added. The Sciex turbo ion spray (TISP) probe was employed in this study. The TISP probe corresponds to the commonly named electrospray interface. The TISP probe was maintained at 375°C with a spray voltage of -4500 V for negative ionization mode and +5500 V for positive ionization mode. All analysis was performed as LC/MS/MS analyses in time-scheduled SRM mode (Single Reaction Mode). All results were corrected for recovery.
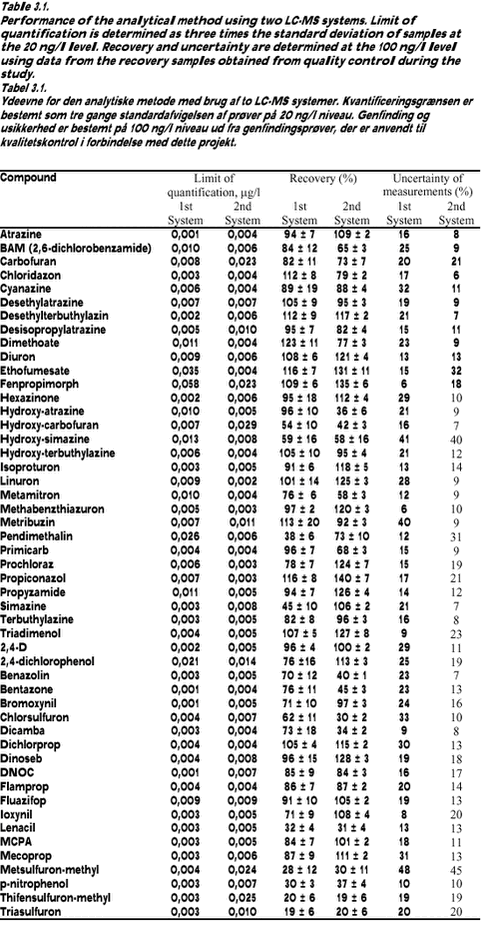
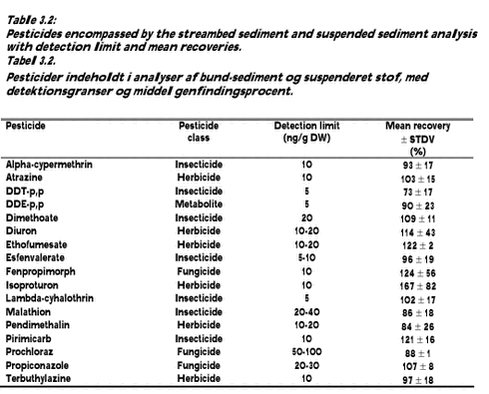
Limits of quantification and uncertainty of measurements The uncertainty of measurements for both LC/MS/MS-systems was determined by making a budget of uncertainty for the method. Utilising that the recovery samples have been prepared on different days using different dilutions of standards and have been analysed on different days with different dilutions of standards and calibration curves, the budget becomes real simple. All variations and uncertainties, except the uncertainty of the sample volume and the uncertainty of the mixed stock solution in the ampoules, are included in the variation of the recovery samples. As the sample volume in the method is determined to the nearest 50 ml, the maximum error is estimated at usample = 2/3*50 ml/1000 ml = 3,3%. According to the certificate of the ampoules with the standards, the maximum error of the concentration is 0.5%. Assuming a squared distribution, the uampoule = following formula gives the uncertainty of measurements (ref.): Table 3.1 provides an overview of the performance of the analytical method. For each batch of samples, calculation of the concentration of each compound took into account the actual recovery and blank values. 3.2.2 Analysis of pesticides in sedimentSediment samples were thawed at room temperature and the water was decanted from the wet samples. Sediment dry weight was measured after drying for 16 hours at 105° C using 10-25 g sediment. The organic matter content was measured as loss on ignition in a sub-sample after 4 hours at 550° C. Fourteen grammes of the wet sediment sample (without decanted water) were mixed in a mortar with 7 g Hydromatrix (pelletized diatomaceous earth) as a drying agent. Nine grammes of the mixture (corresponding to 6 g wet sediment sample) were extracted with acetone/dichlormethane, 1:1, (60 ml) in a Soxtec Avanti 2050 Auto system. Soxtec Avanti represents the new generation of automated Soxhlet extraction. Ethion was added before extraction as an internal standard. The extraction was carried out at 170° C for 2 hours in the boiling extraction solvent followed by extraction for 1 hour in the rinse position. The extract was evaporated and the volume adjusted to 2 ml with cyclohexane/dichlormetane, 1:1. One ml of this extract was purified by Gel Permeation Chromatography (GPC) and the volume adjusted to 1 ml with cychlohexane/acetone 9:1. Half of this extract was purified with concentrated sulphuric acid for analysing DDE-p,p by GC-EC (hexabromobenzene was added as internal standard). The other half of the extract was analysed with GC-MS using both EI-ionisation and NCI-ionisation. The detection limits and mean recovery of the analysed pesticides are shown in Table 3.2. The results presented are not corrected for percentage recovery. 3.3 Transport estimation and statistical analysisDescriptive statistics as calculation of the median value was done for pesticides revealing positive (above detection limit or traces) analytical values, whereas zero values were not incorporated in the statistical calculations. Transport of pesticides was only calculated for the period during which water sampling was conducted. The calculated pesticide transport is therefore a minimum estimate when annual losses or quarter losses from the catchments aret taken into consideration. The transport was calculated minute by minute by multiplying values of concentration and discharge. The length of the calculation periods was defined as one hour before and one hour after the actual measurements and it was assumed that the concentration was constant within these defined time intervals. Instantaneous discharges were calculated from the stage record and subsequently linearly interpolated to minute by minute values in the following way:
where Qj is linear interpolated discharges for minutes between ti and ti+1. |
