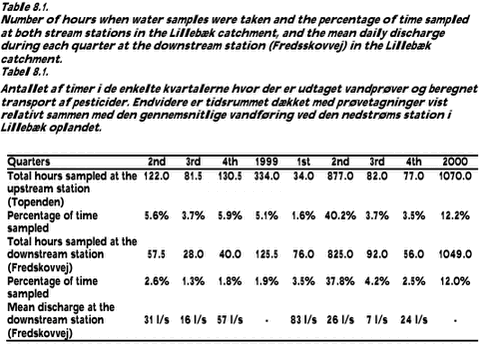
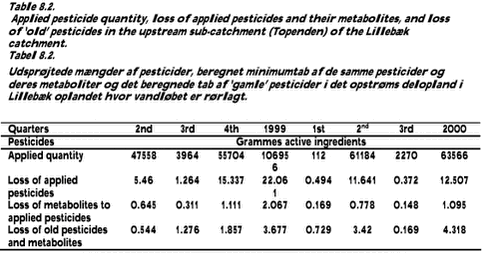
Pesticides in streams and subsurface drainage water within two arable catchments in Denmark: Pesticide application, concentration, transport and fate8 Application and loss of pesticides in the Lillebæk catchment8.1 Application and loss of pesticides in the upstream culverted sub-catchment8.1.1 Application and loss of pesticides in the upstream sub-catchment 8.1.2 Total application, loss and loss ratio of the 18 pesticides applied in the upstream sub-catchment 8.1.3 Loss of ’old’ pesticides not applied within the upstream sub-catchment 8.1.4 Application and loss of key pesticides in the upstream sub-catchment during each quarter of the study period 8.1.5 Modeling pesticide loss from the upstream sub-catchment 8.2 Application and loss of pesticides in the Lillebæk catchment as a whole 8.2.1 Overall application of pesticides and total loss of pesticides 8.2.2 Application, loss and loss ratio of 18 pesticides applied in the Lillebæk catchment as a whole 8.2.3 Loss of ’old’ pesticides not applied within the Lillebæk catchment 8.2.4 Application and loss of key pesticides during each quarter of the study period in the Lillebæk catchment as a whole 8.2.5 Modeling pesticide loss from the entire Lillebæk catchment 8.3 Comparison of pesticide application and loss from the two sub-catchments in the Lillebæk catchment 8.4 Pesticide loss in the 4th quarter 2000 The transport of pesticides was calculated for the two stream stations during the periods with water sampling. The calculated transport of pesticides at the two stream stations is therefore a minimum estimate of the pesticides actually exported from the catchments. Moreover, the number of hours sampled varied between each quarter of the study period (Table 8.1). The second study year (2000) had nearly the same number of hours covered by sampling at the two stream stations and hence the transport estimate between the two stations can be compared. A relatively large number of hours were covered by water samples during the 2nd quarter of 2000 because a composite daily sampling was conducted during May and early June at both stations. 8.1 Application and loss of pesticides in the upstream culverted sub-catchment8.1.1 Application and loss of pesticides in the upstream sub-catchmentA total of 18 different pesticides were applied during the investigated period, which was 2nd quarter of 1999 to 3rd quarter 2000 (see appendix 8.1). Although sampling initially started during the 2nd quarter of 1999, the application in the previous autumn is also included in Appendix 8.1. The total consumption of the 18 pesticides constituted approx. 171.0 kg active substances in the upstream sub-catchment of Lillebæk (Table 8.2). The corresponding pesticide loss constituted approx. 33.6 g during the six quarters covered by water sampling (Table 8.2). The calculated pesticide loss is clearly a minimum estimate because of the low percentage of time covered by water sampling. A maximum estimate of pesticide loss can be obtained by a simple extrapolation of the measured loss to the total time within each quarter of the year. In this case, the pesticide loss constituted 516 g during the study period, which is believed to be a clear overestimate due to the focus on sampling during storm events. The minimum loss:applied ratio was 0.0196% and the maximum loss:applied ratio 0.302% for the 18 applied pesticides in the sub-catchment over the entire study period. Moreover, a minimum of approx. 3.4 g was calculated to be lost as metabolites from terbuthylazine and 8.0 g was lost from 30 pesticides and metabolites that were not applied during the study period.
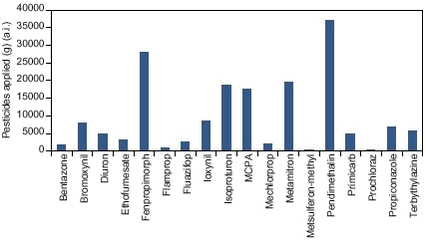
Table 8.2 shows the applied amount of 18 pesticides and the loss of these pesticides and their metabolites, together with the quarterly loss of other non-applied pesticides and their metabolites. Pesticide application was highest in the 2nd quarter of 2000 followed by the 4th quarter of 1999 and 2nd quarter of 1999. The estimated minimum loss of the applied pesticides was generally highest in the quarters of the years with high pesticide application irrespective of the runoff conditions (Table 8.1 and 8.2). In contrast, the loss of non-applied pesticides and metabolites in the upstream sub-catchment was almost equallly high in 1999 and 2000 (Table 8.2). 8.1.2 Total application, loss and loss ratio of the 18 pesticides applied in the upstream sub-catchmentFigure 8.1 shows the amount of the 18 different pesticides applied during the study period (2nd quarter 1999 to 3rd quarter 2000). The five pesticides with the largest application within the upstream sub-catchment were pendimethalin, fenpropimorph, metamitron, isoproturon and MCPA (Fig. 8.1).
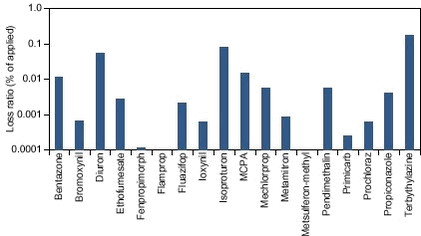
The calculated minimum loss of pesticides applied within the sub-catchment during the study period was highest for isoproturon followed by terbuthylazine, diuron, MCPA and pendimethalin (Fig. 8.2). All of these pesticides, except pendimethalin, have low sorption coefficients (Kd). The calculated loss of the other pesticides applied in the sub-catchment was low (Fig. 8.2).
The loss:applied ratio of pesticides was less than 1% for all of the 18 pesticides applied in the sub-catchment during the study period. The highest loss ratio was calculated for terbuthylazine (0.173%) followed by isoproturon (0.081%), diuron (0.053%), MCPA (0.015%) and bentazone (0.012%) (Fig. 8.3). The other 13 pesticides had a loss:applied ratio less than 0.01% (Fig. 8.3).
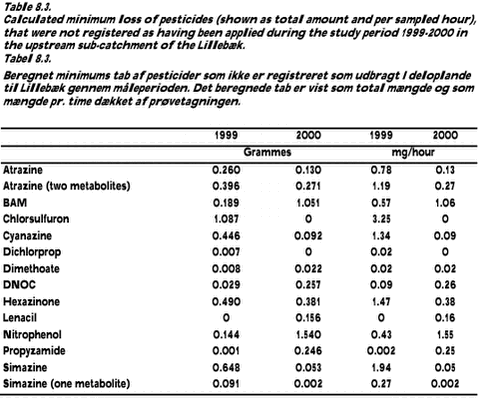
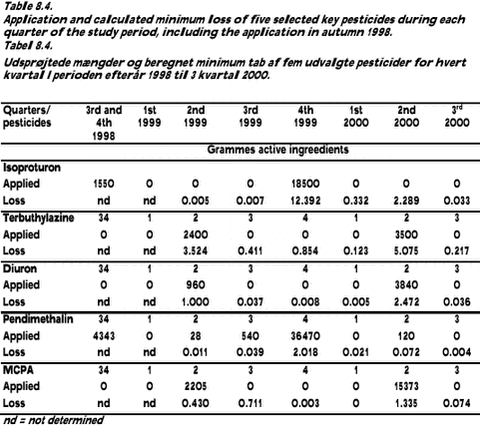
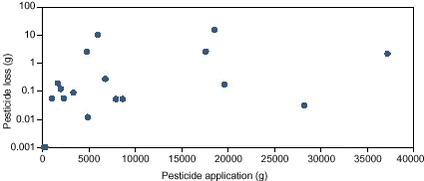
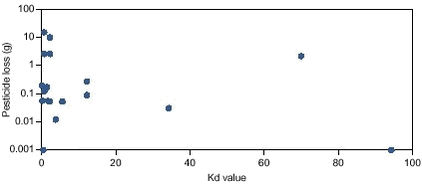
8.1.3 Loss of ’old’ pesticides not applied within the upstream sub-catchmentThe loss of several pesticides that were not registered as having been applied within the upstream sub-catchment of the Lillebæk has been calculated (Table 8.3 and appendix 8.2). Many of these pesticides have been banned for several years (see chapter 6). Consequently, these pesticides are more or less persistent and are still carried to the culverted stream with soil water or groundwater. For some of these ’old’ pesticides, the calculated loss is comparable to the loss of the pesticides currently applied. A wind drift of these formerly applied pesticides can be ruled out. Therefore, a relationship to runoff conditions could be expected. However, the calculated loss of these ’old’ pesticides experienced no consistent relationship to discharge conditions during the two study years. Mean daily discharge was higher in 1999 than in 2000, but the the most significant loss of six of the ’old’ pesticides was calculated during 2000. This could, however, simply be explained by the higher number of hours sampled during 2000 than 1999. A comparison of the loss per sampled hour during the two years does, however, improve the relationship to runoff conditions (Table 8.3). The loss of pesticides with high sorption coefficients, such as atrazine, simazine and their metabolites was, however, exceedingly higher in the wet 1999 than in the dryer 2000. 8.1.4 Application and loss of key pesticides in the upstream sub-catchment during each quarter of the study periodIsoproturon was applied in the upstream sub-catchment of the Lillebæk in autumn 1998 before the measurements started during the 1st quarter of 1999 (Table 8.4). A new application of isoproturon took place in the 4th quarter of 1999. The calculated loss of isoproturon was nearly zero during the first three quarters of 1999 even though the period was wet and despite the application in the preceding autumn (Table 8.4). A major loss of isoproturon was calculated during the 4th quarter of 1999 following a high application in the sub-catchment (Table 8.4). Thereafter, the loss of isoproturon declined, except for the 2nd quarter of 2000. The increase in the loss of isoproturon during the 2nd quarter of 2000 is probably linked to the high percentage of sampling time (see Table 8.1). The loss of isoproturon to the culverted stream is therefore generally strongly linked to the application in the catchment. Diuron was applied within the sub-catchment during the 2nd quarter of 1999 and 2000 (Table 8.4). Again, the calculated loss was highest during these two quarters with very small losses during the other quarters of the study period (Table 8.4). Terbuthylazine was only applied in the 2nd quarter of 1999 and 2000 (Table 8.4). Accordingly, the calculated loss of terbuthylazine was highest during these two quarters with low losses during the other quarters of the study period (Table 8.4). Pendimethalin was applied in the preceding autumn of the study period, a major application in the 4th quarter of 1999 and small applications in the 2nd quarter of 1999 and 2000 and the 3rd quarter of 1999. The calculated loss of pendimethalin was closely linked to the amount being applied during the study period, whereas no impact of the application in autumn 1998 could be seen on the loss during the first quarters of 1999 (Table 8.4). MCPA was applied during the 2nd quarter of 1999 and 2000, the major application being in the 2nd quarter of 2000 (Table 8.4). The highest loss of MCPA was also calculated for the 2nd quarter of 2000, whereas the second highest loss was calculated for the 3rd quarter of 1999 (Table 8.4). A consistent relationship seems to exist between the time of application and the calculated loss of the five key pesticides from the upstream culverted sub-catchment of Lillebæk. This relationship can only be explained by a loss of the applied pesticides through the soil column (presumably via tile drainage water), as losses via wind drift to the culverted stream can be excluded. 8.1.5 Modeling pesticide loss from the upstream sub-catchmentNo significant relationship can be developed between the total consumption of the 18 pesticides used in the upstream culverted catchment and the total loss from the sub-catchment during the study period (2nd quarter of 1999 to 3rd quarter of 2000) (Fig. 8.4). Similarly, no significant relationship exists between the total loss of pesticides and the sorption coefficient measured as the median Kd value for each of the pesticides (Fig. 8.5).
A stepwise regression analysis revealed, however, that a relationship could be established between the pesticide loss (in grammes) and the application of pesticides in the catchment (in grammes), the sorption coefficient (Kd) and halflife of the pesticides in soil (DT50). The equation is shown in (1): ln(Ploss) = -4.09 + 0.000213 • Papplied + 0,0292 • DT50 – 0.114 • Kd (1) A total of 16 pesticides were included in the analysis as two pesticides were rejected from the analysis because of no loss, R2 was 0.40 and p = 0.12.
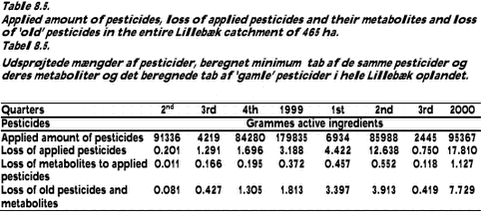
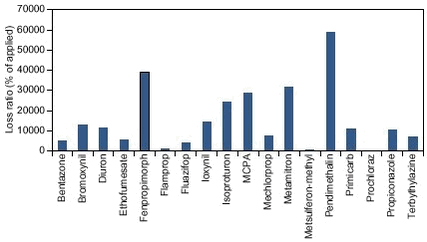
The established relationship links pesticide loss with pesticide application and the physico-chemical properties of each pesticide in spite of the variation in the number of water samples from the stream and hence variation in the time period covered within a quarter. One reason for the somewhat poor empirical relationship that was established could be the influence of point sources (pesticide-contaminated areas) in the upstream sub-catchment. Another reason could be that the chosen sampling strategy focused on sampling mainly during days with rain and high flows in the stream with the purpose of obtaining data for the dynamic model validation - a strategy, which may not be optimal for empirical modeling. 8.2 Application and loss of pesticides in the Lillebæk catchment as a whole8.2.1 Overall application of pesticides and total loss of pesticidesThe total applied amount of 18 pesticides in the entire 465 ha catchment of the Lillebæk was approx. 275.2 kg active ingredients from the 2nd quarter of 1999 to the 3rd quarter of 2000 (Table 8.5). A total of 21.1 g of the 18 pesticides applied in the catchment was as a minimum estimate lost from the entire catchment during the study period. The calculated pesticide loss is clearly a minimum estimate because of the low percentage of time covered by water sampling. A maximum estimate of pesticide loss can be obtained by a simple extrapolation of the measured loss to the total time within each quarter of the year. In this case, the pesticide loss constituted 286 g during the study period, which is believed to be a clear overestimate due to the focus on sampling during storm events. Moreover, 0.09 g simazine was lost from the catchment. Simazine was not applied in the upstream catchment but in the 1st quarter of 2000 in the downstream catchment. The minimum loss:applied ratio constituted 0.0074% and the maximum loss:applied ratio constituted 0,103% for all 18 pesticides in the Lillebæk catchment over the entire study period. Moreover, a minimum of 1.5 g of metabolites from terbuthylazine and 9.3 g of 28 pesticides and metabolites not applied were lost during the study period. The applied amount of 18 pesticides and the loss of these pesticides, their metabolites and pesticides not applied during the study period are shown for each quarter in Table 8.5. The application was highest in the 2nd quarter of 1999 followed by the 2nd quarter of 2000 and 4th quarter of 1999. Simazine was also applied in the downstream sub-catchment with a total application of 800 g in the 3rd quarter of 1999 and 24,583 g in the 1st quarter of 2000. The estimated minimum loss of the 18 applied pesticides was generally highest in the quarters with the highest application, irrespectively of the runoff conditions (Table 8.1 and 8.5). An exception was the 2nd quarter of 1999 that had a large application of pesticides but a very small loss. The reason for this is possibly the very low number of hours covered by sampling (Table 8.1). The loss of pesticides and metabolites not applied within the catchment showed no relationships to runoff during the study period (Table 8.5). 8.2.2 Application, loss and loss ratio of 18 pesticides applied in the Lillebæk catchment as a wholeThe 18 different pesticides applied in the entire Lillebæk catchment during the study period (2nd quarter 1999 to 3rd quarter 2000) are shown in Figure 8.6.
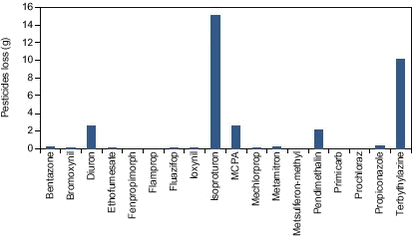
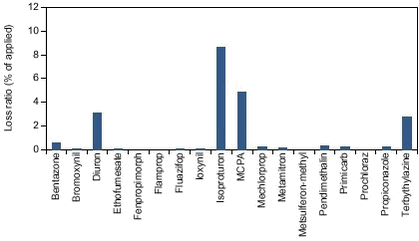
The highest pesticide application within the catchment was reported for pendimethalin, fenpropimorph, metamitron, MCPA, isoproturon and ioxynil. Moreover, a considerable amount of simazine was applied (25.4 kg). The calculated minimum loss of pesticides applied within the sub-catchment during the study period was highest for isoproturon, MCPA, diuron, terbuthylazin and bentazone (Fig. 8.7). All of these pesticides have low sorption coefficients (Kd). The calculated loss of the other pesticides applied in the sub-catchment was generally low (Fig. 8.7).
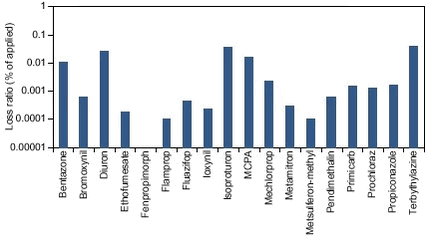
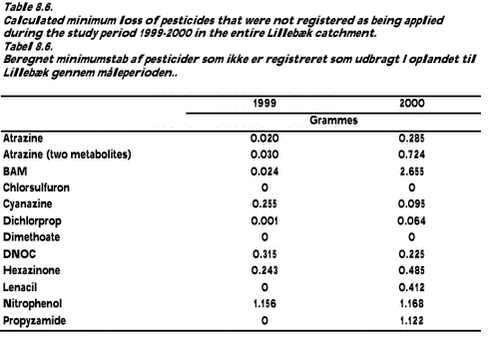
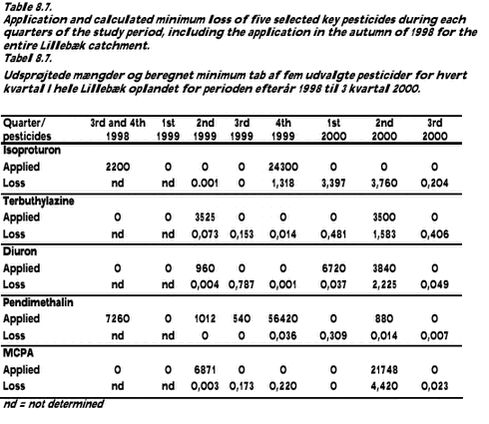
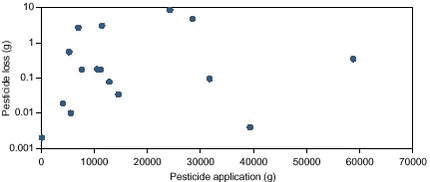
The loss:applied ratio of pesticides was less than 0.1% for all of the 18 compounds applied in the Lillebæk catchment during the study period. The highest loss:applied ratio was calculated for isoproturon (0.042%), tebuthylazine (0.027), diuron (0.027%), MCPA (0.018%) and bentazone (0.0093%) (Fig. 8.8). The other 13 pesticides had a ratio less than 0.01% and in the case of simazine, the loss ratio was as low as 0.00043% (Fig. 8.8). 8.2.3 Loss of ’old’ pesticides not applied within the Lillebæk catchmentA loss of several pesticides not registered as having been applied within the Lillebæk catchment has been calculated (Table 8.6 and appendix 8.4). Many of these pesticides have been banned for several years (see chapter 6). These pesticides are therefore more or less persistent and are still delivered to the culverted or open stream channel with soil water, groundwater or surface runoff. The calculated loss of some of the ’old’ pesticides is comparable to the loss of the pesticides currently applied. However, in the case of chlorsulfuron and dimethoate, a loss was calculated from the upstream sub-catchment (see Table 8.3), whereas no loss was calculated from the catchment as a whole. This may indicate the importance of dilution of the pesticide concentration from the upstream station to the downstream station. Along this short distance the discharge increases more than does the catchment area, the increase being dependent on the season of the year. The increase in discharge will dilute the concentration measured at the upstream station and if the pesticides are not being delivered to the stream from the downstream catchment, it may actually fall below the detection limit. Another important factor could also be that pesticides are transformed during the passage through the stream channel. 8.2.4 Application and loss of key pesticides during each quarter of the study period in the Lillebæk catchment as a wholeIsoproturon was applied in the Lillebæk catchment in autumn 1998 before measuring started in the 1st quarter of 1999 (Table 8.7). Another application of isoproturon took place in the 4th quarter of 1999. The calculated loss of isoproturon was nearly zero during the first three quarters of 1999, irrespective of the period being wet and in spite of the application in the preceding autumn (Table 8.4). A major loss of isoproturon was calculated during the 4th quarter of 1999 following a high application in the sub-catchment (Table 8.4). Thereafter, the loss of isoproturon was high in the 1st and 2nd quarter of 2000 and declined again in the 3rd quarter. The increase in the loss of isoproturon during the 2nd quarter of 2000 can possibly be linked to the high percentage of the period of time that sampling was conducted (see Table 8.1). The loss of isoproturon to the stream is therefore generally linked to the application in the catchment. Terbuthylazine was applied in the 2nd quarter of 1999 and 2000 (Table 8.7). The calculated loss of terbuthylazine was low in 1999, possibly because of the low number of sampling hours. The more thorough sampling conducted in 2000 revealed the highest loss of terbuthylazine in the 2nd quarter where the herbicide was applied in the catchment (Table 8.7). Diuron was applied within the sub-catchment during the 2nd quarter of 1999 and the 1st and 2nd quarter of 2000 (Table 8.7). As for terbuthylazine, no relationship to application could be seen in 1999, whereas the calculated loss was highest during the 2nd quarter of 2000 (Table 8.7). Pendimethalin was applied in the preceding autumn of the study period, a major application in the 4th quarter of 1999 and small applications in the 2nd quarter of 1999 and 2000 and the 3rd quarter of 1999. The calculated loss of pendimethalin was high in the 1st quarter of 2000 following the largest application in the 4th quarter of 1999 (Table 8.7). The loss of pendimethalin was very low in all other quarters. MCPA was applied during the 2nd quarter of 1999 and 2000, the major application being in the 2nd quarter of 2000 (Table 8.7). The highest loss by far of MCPA was also calculated for the 2nd quarter of 2000 where sampling was also most frequent (Table 8.7). A relationship seems to exist between the time of application and the calculated loss of the five key pesticides from the entire catchment in the Lillebæk, especially during 2000. The relationship is generally poorer than the relationship found for the upstream culverted part of the catchment. The main reason is possibly the few number of storm events sampled in 1999 due to malfunction of the automatic sampler. Sampling in 2000 was undisturbed and more reliable transport estimates were therefore obtained. The application and loss of pesticides from the upstream culverted sub-catchment and the downstream sub-catchment with an open stream channel can therefore be inter-compared in 2000. 8.2.5 Modeling pesticide loss from the entire Lillebæk catchmentA relationship exists between the total applied amount of the 18 pesticides used in the entire catchment and the total loss from the catchment during the study period (2nd quarter of 1999 to 3rd quarter of 2000) (Fig. 8.9).
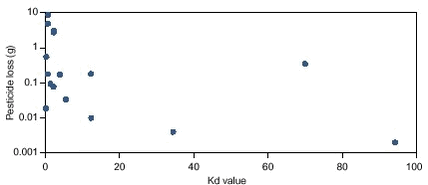
A weak relationship seems to exist also between the total loss of pesticides and the sorption coefficient measured as the median Kd value for each of the pesticides (Fig. 8.10).
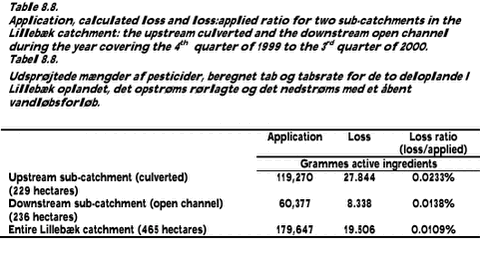
A stepwise regression analysis revealed that a significant relationship could be established between the pesticide loss (in grammes) and the application of pesticides in the catchment (in grammes), the sorption coefficient (Kd) and the half-life of the pesticide (DT50), respectively. The equation is shown in (2): ln(Ploss) = -2.39 + 0.000079 • Papplied – 0.0450 • Kd (2) A total of 16 pesticides were included in the analysis because two pesticides experienced no loss, R2 is 0.45 and P = 0.037. The established relationship links pesticide loss with pesticide application and the physico-chemical properties of each pesticide in spite of the variation in the number of water samples from the stream and hence variation in the period of time covered within a quarter. Another weakness in the sampling strategy for the purpose of establishing empirical relationships is the decision to take samples mainly on days with rain and high flows in the stream (especially during the first study year). A more consistent sampling strategy also covering the entire period might have improved the empirical relationship. 8.3 Comparison of pesticide application and loss from the two sub-catchments in the Lillebæk catchmentThe application of 18 different pesticides from the 4th quarter of 1999 to the 3rd quarter of 2000 was calculated for the upstream culverted sub-catchment and the downstream open channel sub-catchment. The two sub-catchments are almost similar in catchment area, the upstream sub-catchment being 229 ha and the downstream sub-catchment 236 ha. The application, loss and loss ratio of the 18 pesticides are shown in Table 8.8 for the two sub-catchments and the entire Lillebæk catchment. The application of pesticides was 1.5 times higher within the upstream culverted sub-catchment than in the downstream sub-catchment (Table 8.8). Fifteen pesticides were applied in the upstream sub-catchment as compared to 13 in the downstream sub-catchment (Fig. 8.11). The calculated minimum loss of pesticides from the two sub-catchments was quite different, as it was more than 3 times higher from the upstream culverted sub-catchment than from the downstream open channel sub-catchment (Table 8.8). The loss ratio was therefore also almost two times higher for the upstream culverted sub-catchment than for the downstream open channel sub-catchment (Table 8.8).
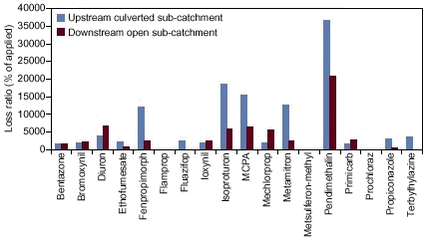
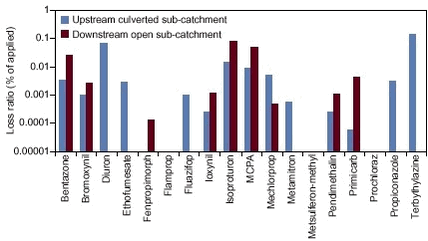
The loss ratio of the different pesticides in the two sub-catchments is shown in Figure 8.12. Six pesticides were only lost from the upstream culverted sub-catchment although five of these were applied in both sub-catchments (Fig. 8.12). Four of these pesticides were, however, applied in a lower quantity in the downstream sub-catchment than in the upstream sub-catchment. As the applied amount seems to be exponentially related to the loss ratio (see section 8.1.5), this could explain the missing loss of these pesticides in the downstream sub-catchment. On the other hand, a higher amount of diuron was applied in the downstream sub-catchment than in the upstream sub-catchment and still no loss was calculated from the downstream sub-catchment (Fig. 8.12). The reason could be that diuron and maybe other of the pesticides are sorbed to particulate matter or taken up by biota in the open channel. This is supported by the findings of a strong increase in the diuron content in suspended sediment and streambed sediment at the upstream station during the spring spraying season April-June 2000 (see section 6.4 and 6.5). Eight pesticides were lost from both sub-catchments (Fig. 8.12). The loss:applied ratio was higher for seven of these pesticides from the downstream sub-catchment than from the upstream sub-catchment. All of these pesticides, except pendimethalin, are very soluble and could be delivered to the downstream part of Lillebæk by groundwater which discharges more in the downstream sub-catchment than in the upstream sub-catchment (see chapter 5). Another explanation could be a higher application within the downstream sub-catchment than in the upstream sub-catchment. This was, however, only the case for four of the seven pesticides (see Fig. 8.11). Another explanation could be a loss of pesticides to the open channel via wind drift, a pathway that can be neglected in the upstream culverted sub-catchment.
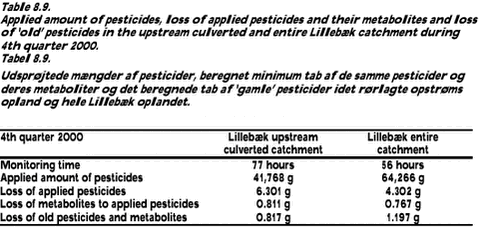
8.4 Pesticide loss in the 4th quarter 2000The pesticide loss was also calculated for the 4th quarter of 2000 based on sampling of a few storm events (see Table 8.1). The loss of 18 applied pesticides per sampled hour was nearly as high in the 4th quarter of 2000 (0.081 g/h) as in the 4th quarter of 1999 (0.117 g/h) in the upstream culverted catchment. The 4th quarter of 1999 and 2000 experienced the highest loss per sampled hour than all other quarters of the year. The loss of 18 applied pesticides in the entire Lillebæk catchment were higher per sampled hour in 4th quarter 2000 (0.077 g/h) than in the 4th quarter 1999 (0.042 g/h). Nearly two thirds of the pesticide loss could be ascribed to the herbicide isoproturon, which possible also was applied in both catchments during the 4th quarter 2000. The loss of old pesticides and metabolites was not very different from observations in the other quarters of the study period (Table 8.2, 8.5 and 8.9). The loss of metabolites to applied pesticides was, however, relatively high in the 4th quarter 2000 especially from the entire Lillebæk catchment. |
