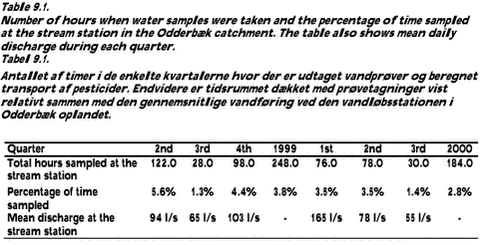
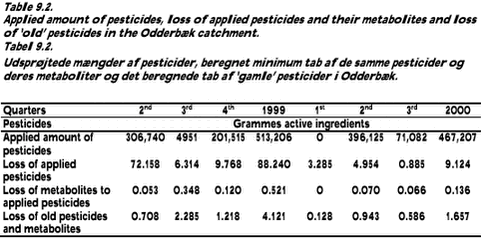
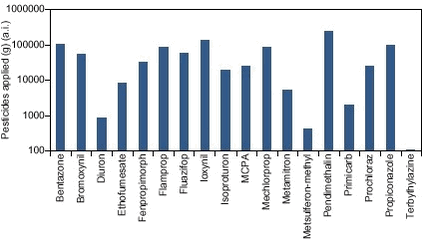
Pesticides in streams and subsurface drainage water within two arable catchments in Denmark: Pesticide application, concentration, transport and fate9 Application and loss of pesticides in the Odderbæk catchment9.1 Application and loss of pesticides in the catchment9.1.1 Applied amount and loss of pesticides 9.1.2 Total application, loss and loss ratio of the 18 pesticides applied in the sub-catchment 9.1.3 Loss of ’old’ pesticides not applied within the sub-catchment 9.1.4 Application and loss of key pesticides in each quarter of the study period 9.1.5 Modeling pesticide loss from the catchment The transport of pesticides was calculated for the stream station during the periods with water sampling. The calculated transport of pesticides at the stream stations is therefore a minimum estimate of the pesticides actually exported from the catchment. Moreover, the estimate of pesticide transport does not reflect the same number of hours within each quarter of the two study years (Table 8.1). 9.1 Application and loss of pesticides in the catchment9.1.1 Applied amount and loss of pesticidesA total of 18 different pesticides were applied during the investigated period, which was the 2nd quarter of 1999 to 3rd quarter 2000 (see appendix 9.1). Although sampling initially started in the 2nd quarter of 1999, the application in the previous autumn is also included in Appendix 8.1. The total applied amount of the 18 pesticides amounted to approx. 980.4 kg active ingredients in the Odderbæk catchment (Table 8.2). The corresponding pesticide loss constituted approx. 97.4 g for the six quarters covered by water sampling (Table 8.2). The calculated pesticide loss is a clear minimum estimate because of the low percentage of time covered by water sampling. A maximum estimate of pesticide loss can be obtained by a simple extrapolation of the measured loss to the total time within each quarter of the year. In this case, the pesticide loss amounted to 2295 g during the study period, which is clearly believed to be an overestimate due to the focus on sampling during storm events. The minimum loss:applied ratio was 0.0099% and the maximum loss:applied ratio 0.233% for the 18 applied pesticides in the catchment over the entire study period. Moreover, a minimum of approx. 0.6 g was calculated as being lost as metabolites from terbuthylazine, and 5.8 g was lost from 30 pesticides and metabolites that were not applied during the study period. The applied amount of 18 pesticides and the loss of these pesticides and their metabolites, together with the loss of other non-applied pesticides and their metabolites are shown on at quarterly basis in Table 9.2. Pesticide application was highest in the 2nd quarter of 2000 followed by the 2nd quarter of 1999 and the 4th quarter of 1999. The estimated minimum loss of the applied pesticides was higher in the wet year of 1999 than in the somewhat dryer year of 2000 (Table 9.1 and 9.2). This pattern was not so evident for the loss of pesticides and metabolites that were not applied in the catchment during the study period (Table 8.2). 9.1.2 Total application, loss and loss ratio of the 18 pesticides applied in the sub-catchmentThe 18 different pesticides applied during the study period (2nd quarter 1999 to 3rd quarter 2000) are shown in Figure 8.1. The five pesticides with the highest application within the catchment were pendimethalin, isoproturon, bentazone, terbuthylazine and fenpropimorph (Fig. 9.1).
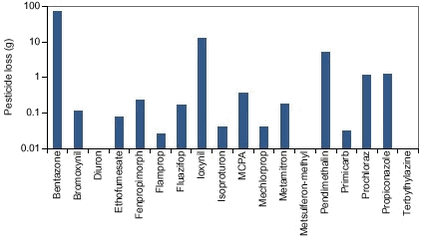
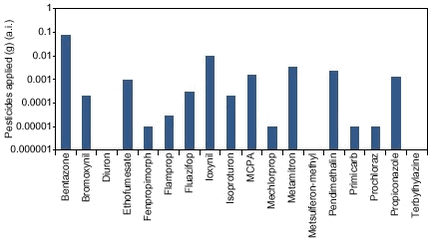
The calculated minimum loss of pesticides applied within the catchment during the study period was highest for bentazone followed by isoproturon, pendimethalin, terbuthylazine and propiconazole (Fig. 9.2). Bentazone and isoproturon both have low sorption coefficients (Kd). The calculated loss of the other pesticides applied in the catchment was low (Fig. 9.2).
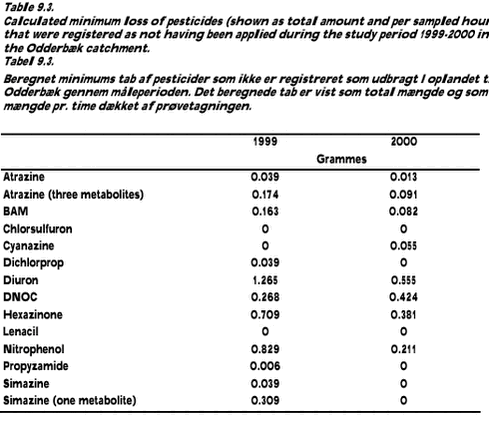
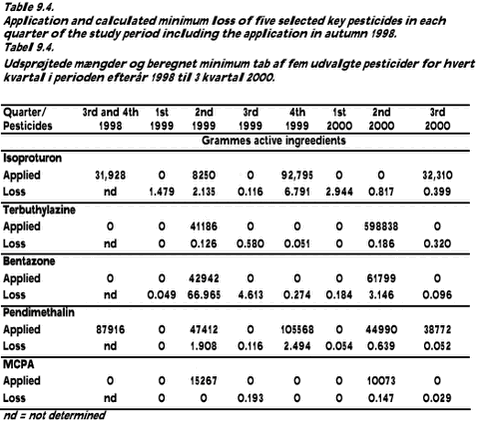
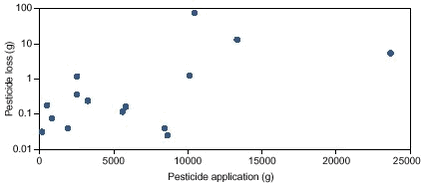
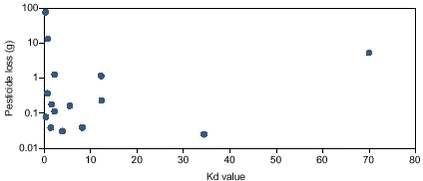
The loss:applied ratio of pesticides was less than 1% for all of the 18 pesticides applied in the sub-catchment during the study period. The highest loss ratio was calculated for bnetazone (0.072%) followed by isoproturon (0.0098%), propiconazole (0.0046%), metribuzin (0.0033%) and metsulfuron (0.0024%) (Fig. 9.3). 9.1.3 Loss of ’old’ pesticides not applied within the sub-catchmentA loss of several pesticides not registered as having been applied in the Odderbæk catchment has been calculated (Table 9.3 and appendix 9.2). Many of these pesticides have been banned for several years (see chapter 6). These pesticides are therefore more or less persistent and are still carried to the stream with soil water or groundwater. For some of these ’old’ pesticides, the calculated loss is comparable to the loss of the pesticides currently being applied. A wind drift of these previously applied pesticides can be ruled out. A relationship with runoff conditions could therefore be expected. The calculated loss of these ’old’ pesticides experienced a relationship with discharge conditions during the two study years. Mean daily discharge was higher in 1999 than in 2000 and the pesticide loss was also generally higher in 1999 than in 2000 (Table 9.3). 9.1.4 Application and loss of key pesticides in each quarter of the study periodIsoproturon was applied during several quarters of the study period in the Odderbæk catchment (Table 9.4). The loss of isoproturon is generally linked to the application in the catchment, as the loss of isoproturon increases in quarters with application and decreases in quarters with no application (Table 9.4). Bentazone was applied within the catchment during the 2nd quarter of 1999 and 2000 (Table 9.4). The calculated loss was high during these two quarters and the highest bentazone loss was calculated in the wet 2nd quarter of 1999, followed by the 3rd quarter of 1999 and 2nd quarter of 2000 (Table 9.4). In all other quarters the loss of bentazone was very low. Pendimethalin was applied in several quarters of the year and was always followed by an increase in the loss (Table 9.4). The calculated loss of pendimethalin was therefore closely linked to the amount applied during the study period, although the application in autumn 1998 was not reflected in the loss during the first quarters of 1999 (Table 9.4). Terbuthylazine was only applied in the 2nd quarter of 1999 and 2000 (Table 9.4). The calculated loss of terbuthylazine was, however, highest during the 3rd quarter (Table 9.4). MCPA was applied during the 2nd quarter of 1999 and 2000 (Table 9.4). The highest loss of MCPA was calculated for the 3rd quarter of 1999 and the second highest loss was calculated for the 2nd quarter of 2000 (Table 9.4). On a quarterly basis, there seems to be a general relationship between the time of application and the calculated loss of the five key pesticides from the catchment of Odderbæk. This relationship can be explained by a loss of the applied pesticides through the soil column. Wind drift could also be a possible source of pesticides to surface water, but in the case of MCPA and terbuthylazine, the major pesticide loss was calculated for the quarter following the actual pesticide application. 9.1.5 Modeling pesticide loss from the catchmentA relationship seems to exist between the total applied amount of the 18 pesticides used in the Odderbæk catchment and the total loss from the catchment during the study period (2nd quarter of 1999 to 3rd quarter of 2000) (Fig. 9.4). Thus, the pesticide loss generally increases with increased application. A somewhat weaker inverse relationship seems to exist between the total loss of pesticides and the sorption coefficient measured as the median K value for each of the pesticides (Fig. 9.5).
A stepwise regression analysis revealed that a significant relationship could be established between the pesticide loss (in grammes) and the application of pesticides in the catchment (in grammes), the sorption coefficient (Kd) and the halflife (DT50). The equation is shown in (1): ln(Ploss) = -3.57 + 0.000038 • Papplied + 0.0221 • DT50 – 0.0501 • Kd (1) The number of pesticides in the analysis is 16, R2 is 0.60 and p = 0.014. The established relationship links pesticide loss with pesticide application and the physico-chemical properties of each pesticide in spite of the variation in the number of water samples from the stream and hence variation in the period of time covered within a quarter. |
