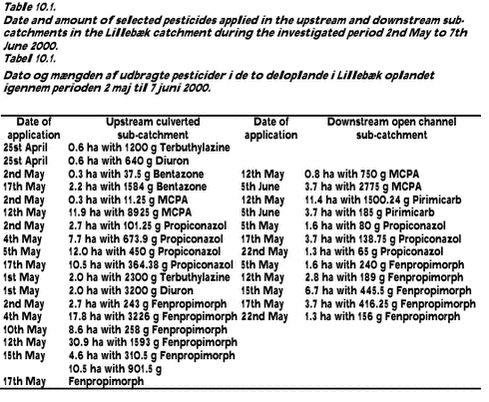
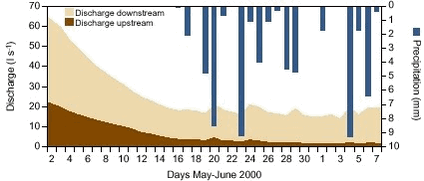
Pesticides in streams and subsurface drainage water within two arable catchments in Denmark: Pesticide application, concentration, transport and fate10 Linking application and hydrology in the catchment to pesticide concentration in stream water10.1 Application of pesticides in the Lillebæk catchment in May/June 200010.2 Precipitation and discharge in Lillebæk during the investigated period 10.3 Concentration of the herbicide isoproturon at the two stream stations in Lillebæk 10.4 Concentration of the metabolite BAM at the two stream stations in Lillebæk 10.5 Concentration of the herbicide MCPA at the two stream stations in Lillebæk 10.6 Concentration of the herbicide Diuron at the two stream stations in Lillebæk 10.7 Concentration of the herbicide Terbuthylazine at the two stream stations 10.8 Concentration of the fungicide Fenpropimorph at the two stream stations 10.9 Concentration of the insecticide pirimicarb at the two stream stations 10.10 Mass-balance for pesticides in the two sub-catchments in Lillebæk 10.11 Concentration of pesticides during single storm events in the Lillebæk catchment 10.12 Concentration of pesticides during single storm events in the Odderbæk catchment This chapter describes the results of an intensive, composite daily sampling (hourly water samples) conducted at the two stream stations in Lillebæk from 2-3 May to 6-7 June 2000. The aim of this intensive sampling survey was to investigate more closely the concentration of pesticides in stream water during the main spraying season (spring) and the pathways for pesticides in the two sub-catchments. Morever, the chapter includes an analysis of pesticide concentration response to rain in the Lillebæk and Odderbæk streams. The intensive sampling period in May/June 2000 comprised 36 consecutive days of sampling. At the downstream station, only two days were missing in the time series due to a failure in the pesticide analysis process. 10.1 Application of pesticides in the Lillebæk catchment in May/June 2000Table 10.1 shows the application date and the amount of isoproturon, MCPA, diuron, bentazone, propiconazole, pirimicarb and fenpropimorph applied onto the fields within the two sub-catchments during the investigated period. 10.2 Precipitation and discharge in Lillebæk during the investigated periodTotal precipitation constituted 60.2 mm during the 37-day investigation period from 2 May to 7 June 2000. The first two weeks were dry followed by several days with precipitation at the end of May and in early June (Fig. 10.1).
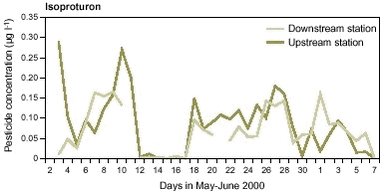
The average discharge was 6.5 l/s at the upstream station and 18.4 l/s at the downstream station during the 36-day investigation period. The changes in daily mean discharge reflected the precipitation pattern during the period. Daily mean discharge experienced a general decrease at both the upstream and downstream monitoring station during the investigated period (Fig. 10.1). Precipitation events on the 19-21 May, 23-24 May, 28 May, 3 June and 5-6 June were followed by small increases in discharge (Fig. 10.1). 10.3 Concentration of the herbicide isoproturon at the two stream stations in LillebækIsoproturon was not applied during the 2nd Quarter of 2000 and hence not in the period investigated. The latest application of isoproturon took place in October 1999. The average concentration of isoproturon was 85 ng/l at the upstream station and 69 ng/l at the downstream station during the 36-day study period. The concentration of isoproturon revealed no clear relationship to discharge when considering the hydrograph and the chemograph at the upstream and downstream stations (Fig. 10.2).
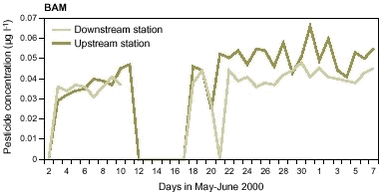
The concentration of isoproturon decreased, however, at the end of the investigated period following increases in discharge on 28-29 May and in early June. Such a pattern could be typical when the soil water content decreases and the upper groundwater loses contact with tile drainage systems in the two sub-catchments. 10.4 Concentration of the metabolite BAM at the two stream stations in LillebækBAM is a metabolite from the herbicide dichlobenil that has not been applied in the Lillebæk catchment since 1997. The average concentration of BAM was 38 ng/l at the upstream station and 31 ng/l at the downstream station during the 36-day study period (Fig. 10.3). The concentration of BAM revealed no clear pattern during the study period although there was a tendency for an increase in the BAM concentration from early May to mid-May when discharge decreased rapidly at both sampling stations (Fig. 10.1 and 10.3). Thus, stream hydrology is in a transition period changing from being dominated by tile drainage water to a dominance of groundwater. Moreover, BAM has been detected (detection frequency=15%) in the upper groundwater (< 5 m) in the Lillebæk catchment (Funen County, 2001).
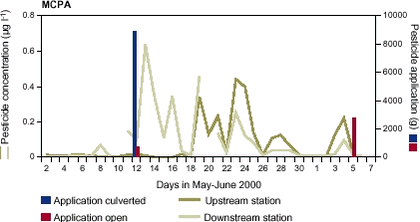
10.5 Concentration of the herbicide MCPA at the two stream stations in LillebækThe average concentration of MCPA was 71 ng/l at the upstream station and 95 ng/l at the downstream station during the 36-day study period. The herbicide MCPA was applied on two dates in both sub-catchments during the study period (Table 10.1). MCPA was applied on a small field and in small amounts on the 2 May in the upstream sub-catchment. This application had no influence on the concentration of MCPA measured in stream water (Fig. 10.4). The second application was on the 12 May in both sub-catchments. The application of MCPA in the downstream open channel sub-catchment was followed by a rapid increase in the concentration of MCPA at the downstream station, whereas nearly no increase was measured at the upstream station (Fig. 10.4).
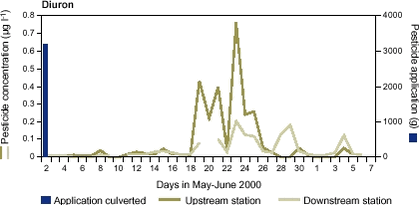
This pattern cannot be related directly to wind drift of MCPA to the open stream channel as the application took place two days before the rise in MCPA concentration to a maximum of more than 600 ng/l at the downstream station (Fig. 10.4). Another explanation could be related to the cleaning of spraying equipment or percolation of MCPA through the soil from wet areas close to the stream channel. The concentration of MCPA increased during the periods with increasing discharge at both stream stations during the remaining part of the study period (Fig. 10.4). The increase in the concentration of MCPA with increasing discharge was, however, more evident during the first two storm events on the 19-21 May and 23-24 May than during the two events on 27-28 May and 3-4 June (Fig. 10.4). This pattern show that part of the MCPA applied was available for leaching with soil water via tile drains to the stream but that the availability declined with time after application. 10.6 Concentration of the herbicide Diuron at the two stream stations in LillebækThe average concentration of diuron was 79 ng/l at the upstream station and 44 ng/l at the downstream station during the 36 days study period. Diuron was applied on the 25th April and the first May in the upstream catchment and on the 15th March in the downstream sub-catchment. Water samples analysed on the 13th March and 10th April taken during steady flow conditions at both stations had diuron concentrations below the detection limit. On contrary, diuron was measured in water samples taken from the upstream station during a rain event on the 22nd and 23th April in concentrations uo to 780 ng l-1 even though diuron had not been applied in the catchment since 2nd quarter of 1999. The very high concentration of 780 ng l-1 was measured in a water sample having very high particulate matter thus pointing at a delivery of diuron with soil lost via tile drains presumable from macropore flow. A diuron concentration of 135 ng l-1 was also measured on the 25th April at the downstream station. This relatively high concentration could be due to the application of diuron in the downstream sub-catchment on the 15th March. The concentration of diuron was low at both stations during May/June except during storm events where the concentration increased to a maximum of 760 ng/l during the storm event on the 23rd May at the upstream station (Fig. 10.5). The chemograph for diuron clearly shows that the substance is delivered to the stream with soil water presumably through tile drains. The higher concentration detected during the early storm events (20-22nd May and 24th May) at the upstream station than at the downstream station could reflect the recent application in the upstream sub-catchment. The lower concentration at the downstream station can merely be explained by a dilution as discharge was 4 times higher at the downstream station and the concentration of diuron nearly 4 times lower. Another possibility is that diuron is lost to the stream from point source polluted areas in the upstream sub-catchment. 10.7 Concentration of the herbicide Terbuthylazine at the two stream stationsThe average concentration of terbuthylazine was much higher (147 ng/l) at the upstream station than at the downstream station (23 ng/l) during the 36 days study period (Fig. 10.6).
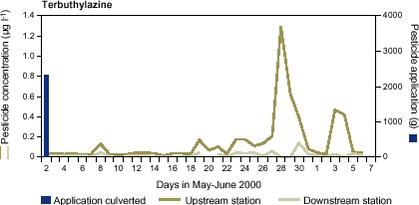
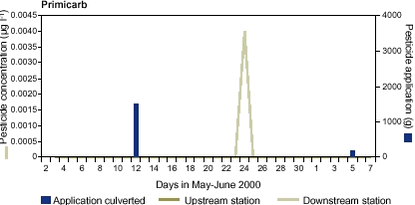
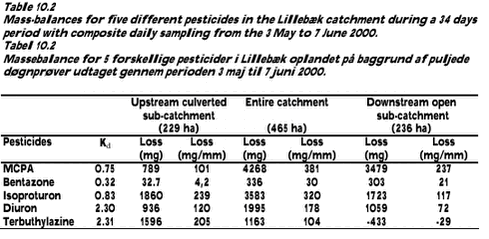
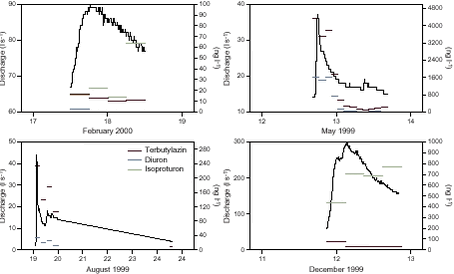
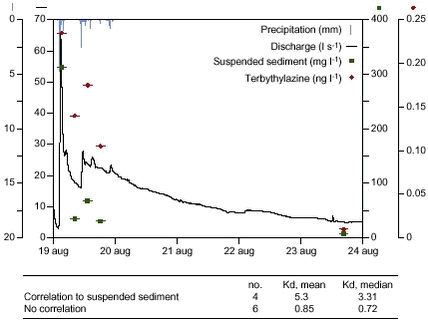
Terbuthylazine was applied in the upstream sub-catchment on the 1st May but not in the downstream sub-catchment. This could explain the large difference in concentration of terbuthylazine between the two stations. The concentration of terbuthylazine increased during storm events at the upstream station especially the late storm events on the 28-29th May and 3-4th June (Fig. 10.6). Terbuthylazine is either lost to tile drainage water from the two fields being sprayed in the upstream catchment during the rain periods or lost from a point source in the catchment. 10.8 Concentration of the fungicide Fenpropimorph at the two stream stationsFenpropimorph was the pesticide applied most widely and in the greatest quantity during the 36-day investigation period (see Table 10.1). Never the less, fenpropimorph was not measured at any of the two stream stations. Accordingly, neither wind drift nor leaching through the soil of fenpropimorph to the stream seems to have occurred despite the high application of fenpropimorph both in terms of area and amount of active substance (see Table 10.1). The fact that fenpropimorph was not lost through the soil column to tile drainage water during the storm events in May can be explained by the large sorption coefficient of fenpropimorph (Kd value of 34.5). 10.9 Concentration of the insecticide pirimicarb at the two stream stationsPirimicarb was applied in the downstream sub-catchment on the 12th May and the 5th June during the investigated period. Pirimicarb was only measured during the storm event on the 23th May and only at the downstream station (Fig. 10.7). 10.10 Mass-balance for pesticides in the two sub-catchments in LillebækA pesticide mass-balance was calculated for a 34 days period of composite daily sampling at the two stations in the Lillebæk catchment (Table 10.2). The mass-balance covered all the diurnal samples from the two stations during the period 3rd May to 7th June except two days where samples were missing (11th May and 21st May). The mass-balance shows that the very soluble pesticides MCPA and bentazone experienced a much higher loss from the open sub-catchment than from the culverted sub-catchment both in absolute amounts and calculated as a loss per mm runoff (Table 10.2). MCPA was applied in both sub-catchments during the intensive study period, whereas bentazone only was applied in the upstream culverted sub-catchment (Table 10.1). The higher loss of MCPA and bentazone from the downstream catchment indicates that groundwater must be an important pathway for these two pesticides in this catchment. Isoproturon and diuron being also soluble pesticides (low Kd) had a higher loss per mm runoff from the upstream culverted sub-catchment than the downstream open catchment (Table 10.2). Isoproturon has not been used in both sub-catchments since the 4th quarter 1999 and diuron was only applied in the culverted catchment during the intensive sampling period (Table 10.1). In the case of terbuthylazine the loss was high from the upstream sub-catchment, whereas a negative loss (storage or transformation) seems to occur during the transfer of terbuthylazine through the open channel reach (Table 10.2). Isoproturon and diuron was detected in both suspended sediment and streambed sediment during May to June 2000 and in the streambed sediment in increasing concentrations during May. Terbuthylazine was detected in suspended sediment but not in streambed sediment. The only possibly explanation is that terbuthylazine undergoes rapid transformations when exposed in streambed sediments. 10.11 Concentration of pesticides during single storm events in the Lillebæk catchmentThe concentration of pesticides seems to rise especially during storm events for several of the compounds presented in the previous sections. Examples of the pesticide behaviour in streams during four storm events are shown in Figure 10.8. The concentration of terbuthylazine and diuron increases at the onset of the storm events and peaks together or near with the peak in maximum discharge (Fig. 10.8). However, the concentration of terbuthylazine and diuron was much higher during the storm event in May than in the other 3 storm events (Fig. 10.8). Both pesticides were also applied during the 2nd quarter of 1999. Terbuthylazine was detected during all four storm events, whereas diuron was not detected during the storm event in December 1999 experiencing highest discharge values and only as trace amounts during the storm event in February 2000 (Fig. 10.8). Isoproturon revealed another pattern than terbuthylazine and diuron during storm events, the maximum concentration lagging peak discharge. Such a delayed pattern is typical for substances being leached through the soil column to tile drainage water and further to the stream channel. Moreover, isoproturon had the far highest concentrations during the December 1999 and February 2000 storm events, whereas showed very low concentrations during the May and August storm events (Fig. 10.8). The reason for this seasonal pattern is explained to the application of isoproturon, which happened in the upstream sub-catchment during the 4th quarter of 1999. Both terbuthylazine, diuron and other pesticides with Kd values above 1-2 revealed relationships to the concentration of suspended sediment in the water samples during storm events, whereas no relationships could be established in the case of the more soluble pesticides isoproturon and bentazone (Fig. 10.9).
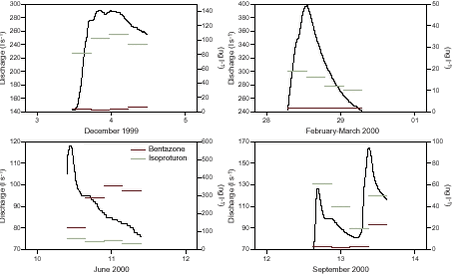
One main reason for the high concentrations of terbuthylazine and diuron during extremely flashy storm events in May 1999 must be one or a combination of two mechanisms: (1) Terbuthylazine and diuron are delivered to the stream via tile drainage water from the fields where the pesticides were recently applied during the intensive and heavy rainfall; (2) terbuthylazine and diuron from the water phase were sorbed to sediment stored in the culverted stream during the period between application and the storm event and then flushed out during the storm event. The reason for the much lower concentrations of terbuthylazine and diuron during the storm event in August 1999 must be that the pesticides were not applied during the 3rd quarter of 1999 and hence concentrations in the water or sediment phase were reduced due to less sorption and transformation of initial substances. The somewhat lower concentration of terbuthylazine and missing detections of diuron during the storm event in December 1999 and February 2000 must be due to the same reason as explained above for the August storm event, except that the longer time period since last application has given more time to transformation of the pesticides. The storm event in December 1999 reached higher maximum discharges than the other storm events in May, August and February and with nearly the same maximum concentration of suspended sediment as at least the August storm event. 10.12 Concentration of pesticides during single storm events in the Odderbæk catchmentThe concentration of isoproturon was high during the storm events in December 1999 and February 2000, whereas only trace amounts of bentazone was detected (Fig. 10.10). The reason for this is clearly that isoproturon was applied in the Odderbæk catchment during the 4th quarter 1999, whereas bentazone only was applied in the 2nd quarter 1999. The concentration of isoproturon more or less followed the variation in discharge during the storm events showing that it is rapidly carried from the soil to surface water.
The concentration of bentazone was higher than isoproturon during the storm event in June 2000 and bentazone concentration clearly lagged the peak discharge (Fig. 10.10). Bentazone was also applied in the catchment during the 2nd quarter of 2000, whereas this was not the case for isoproturon. The concentration of bentazone was the highest observed and higher than reached for isoproturon. This shows the impact of pesticide application and subsequent loss during the relatively low flow period of the autumn spraying season. Wind drift or bentazone being washed out of stream bank vegetation can not cause the concentration pattern observed in the stream as this would have caused a rapid increase in bentazone concentration peaking before maximum discharge (Fig. 10.10). During the storm event in September 2000 the concentration of isoproturon is again higher than for bentazone (Fig. 10.10). The explanation is simply that isoproturon was applied in the catchment during the 3rd quarter of 2000. |
