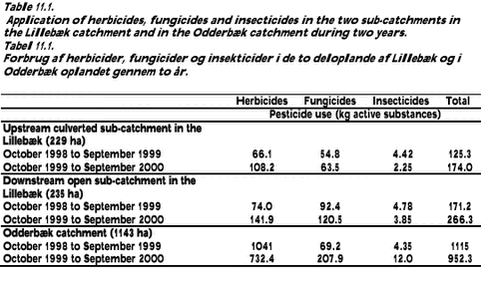
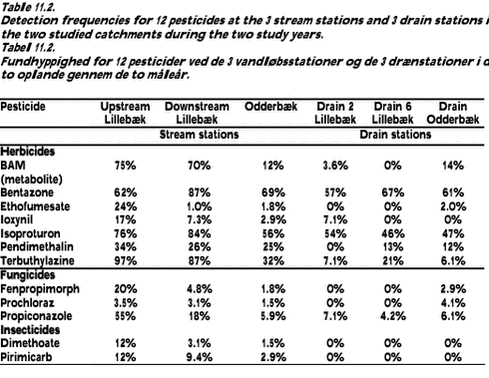
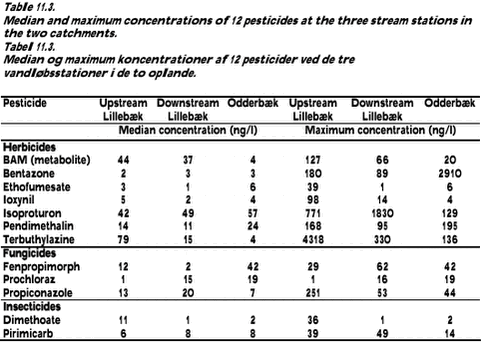
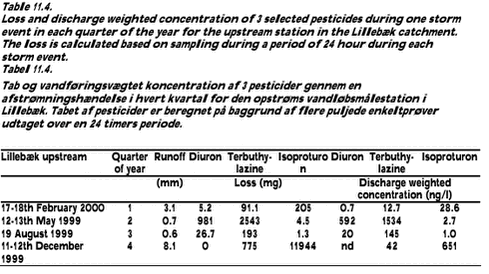
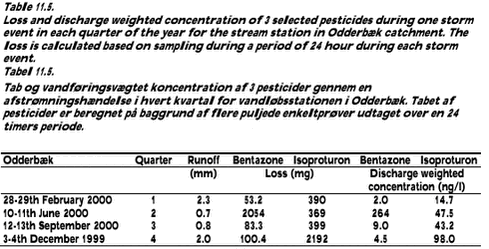
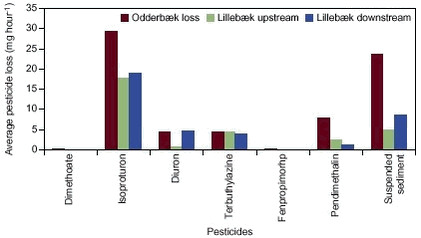
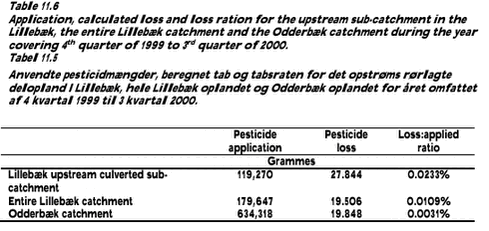
Pesticides in streams and subsurface drainage water within two arable catchments in Denmark: Pesticide application, concentration, transport and fate11 Comparison of pesticide fate in the two catchments and prediction of recurrence intervals for pesticide concentrations11.1 Pesticide application11.2 Pesticide detection and concentration in stream and tile drainage water 11.3 Pesticide loss 11.4 Prediction of recurrence intervals for different pesticide concentrations 11.1 Pesticide applicationThe amount of pesticides applied per hectare to the ten dominant crop types did not differ much between the Lillebæk catchment (1998/1999: 0.918 kg/ha and 1999/2000: 1.163 kg/ha) and the Odderbæk catchment (1998/1999: 1.013 kg/ha and 1999/2000: 1.042 kg/ha). Herbicides were, however, applied in much greater quantities in the Odderbæk catchment than in the two sub-catchments of the Lillebæk during the two study periods (Table 11.1). On the contrary, more fungicides and insecticides were applied in the Lillebæk catchment than in the Odderbæk catchment (Table 11.1). 11.2 Pesticide detection and concentration in stream and tile drainage waterMore pesticides and metabolited were detected in stream water than in tile drainage water within the two catchments during the study period. Of the total of 49 pesticides and metabolites analysed for in water samples nearly the same number of pesticides and metabolites was detected at the three stream stations. This amounted to 42 pesticides at the upstream station in the Lillebæk, 40 pesticides at the downstream station in the Lillebæk and 39 pesticides at the stream station in the Odderbæk catchment. The number of different pesticides detected at the two drain stations in the Lillebæk catchment amounted to 17 and 16, whereas 27 different pesticides were detected at the drain station in the Odderbæk catchment. The detection frequency for 12 selected key pesticides or metabolites varied, however, considerably between the two stream stations in the Lillebæk catchment and the stream station in the Odderbæk catchment (Table 11.2). Herbicides, fungicides and insecticides have a much higher detection frequency at the stream stations in the dominantly loamy and tile drained Lillebæk catchment than at the stream station in the dominantly sandy Odderbæk catchment. Exceptions are the widely used and very soluble herbicides bentazone and isoproturon that are found nearly with the same frequency in the two catchments. The herbicide pendimethalin that has a high sorption potential was, however, also found at a nearly similar frequency in the two catchments. No major differences were observed in the detection frequencies in the tile drains monitored in the Lillebæk and Odderbæk catchment. The only exception being BAM which was recovered more often in drain water from the station in the Odderbæk catchment. This could be explained with the much greater dominance of deeper groundwater in the large drain monitored in the Odderbæk catchment as opposed to the upper groundwater dominated drains in the Lillebæk catchment. The measured differences in detection frequencies in stream water for many of the key pesticides in the Lillebæk and the Odderbæk catchment suggest that applied pesticides are carried more easily and possibly with a shorter residence time from the field to the stream in the loamy, tile drained Lillebæk catchment than in the sandy and more groundwater dominated Odderbæk catchment. In the case of the metabolite BAM from TCA (banned 1992) and dichlobenile (banned 1997) the reason for the large difference in detection frequency between the two catchments can be that BAM has been detected in upper groundwater in Lillebæk and not in Odderbæk. If BAM only is delivered with deeper groundwater to the Odderbæk stream but both with deeper and upper groundwater to the Lillebæk stream then this can explain the large difference in the measured detection frequency. The median and maximum concentrations of 12 selected pesticides are shown in Table 11.3. No major differences can be seen between the median pesticide concentrations in stream water in the Lillebæk and Odderbæk catchment. The only exceptions are for the concentration of the metabolite BAM and terbuthylazine being considerably lower in the Odderbæk stream than in the Lillebæk stream. The maximum pesticide concentrations measured in stream water differed from substance to substance between the two catchments. The maximum concentration s were, however, generally highest in the stream draining the upstream culverted Lillebæk catchment. The maximum concentrations were more comparable between the two stream stations draining the Lillebæk and Odderbæk catchments although substance specific differences occured (Table 11.3). The concentrations of herbicides were, however, in general much higher than for fungicides which in turn was higher than for insecticides in both catchments. This can simply be explained by the large differences in the applied amount of herbicides, fungicides and insecticides, which normally decreases in this order (Table 11.1). The differences in Kd values for the group of pesticides shown in Table 11.3 is of course also an important factor for the differences between herbicides and fungicides. 11.3 Pesticide lossThe pesticide concentration and loss during the four storm events shown in chapter 10 is shown in Table 11.4 and 11.5. Each of the storm events was intensively sampled. We have chosen one storm in each of the quarters to represent the seasonal dynamics of water and pesticides. The loss and discharge weighted concentration of pesticides during the four storm events is highly correlated to the application time of the pesticides. Thus, both the loss and discharge weighted concentration of isoproturon was considerably higher during the storm event in the 4th quarter than in the other quarters in both catchments (Table 11.4 and 11.5). On contrary, diuron and terbuthylazine in the Lillebæk catchment and bentazone in the Odderbæk catchment experienced highest losses and concentrations in the 2nd quarter of the year (Table 11.4 and 11.5). Another marked difference between the fate of pesticides during storm events in the two catchments is that the loss and discharge weighted concentration is more extreme in the Lillebæk catchment than in Odderbæk catchment. The average loss of selected pesticides and suspended sediment from the 2 sub-catchments in the Lillebæk and the Odderbæk catchment during the period 3rd quarter 1999 to 3rd quarter 2000 is shown in Figure 11.1. The average loss is calculated per sampling hour and is, therefore, comparable between the catchments. The pesticide and suspended sediment loss is in many cases greater from the Odderbæk catchment than from the two sub-catchments in the Lillebæk (Fig. 11.1). However, the applied pesticide amount was much greater in the Odderbæk catchment than in the Lillebæk catchment. Consequently, the loss:applied ratio for the Odderbæk catchment was three times lower than for the entire Lillebæk catchment and nearly 8 times lower than for the upstream culverted sub-catchment when considering 18 applied pesticides during the year covered by the 4th quarter of 1999 to the 3rd quarter of 2000 (Table 11.6). Although the loss figures shown is only calculated for the sampling period and therefore is a minimum estimate (see chapter 8) the figures can be used to make comparison between the catchments. The ’true’ loss:applied ratio for the catchments is, however, higher than the results shown in Table 11.6.
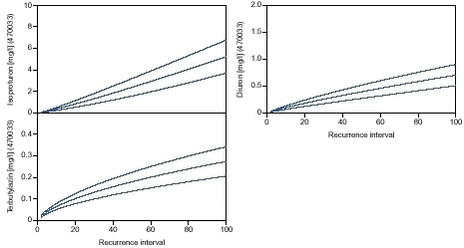
11.4 Prediction of recurrence intervals for different pesticide concentrationsWe fitted a generalized extreme-value (GEVD) distribution (Kite, 1978) to the samples of pesticides from the upstream station in the Lillebæk catchment by the maximum likelihood method. The GEVD distribution has three parameters (location, scala and shape) The distribution has been extensively used to fit maximum and minimum discharges in hydrological applications (e.g. Ovesen et al. , 2000). The GEVD distribution is in this report used to calculate the concentration with a 95% confidence interval at different recurrence intervals for the selected pesticides. The recurrence interval for concentrations of terbuthylazine and diuron at the upstream station in the Lillebæk catchment is shown in Figure 11.2. The statistical analysis for this stream station is based on a total of 97 water samples for the entire study period with 56 being sampled during storm events. The predicted recurrence interval for the concentration of terbuthylazine and diuron shows that extremely high concentrations can occur at the upstream station in the Lillebæk catchment (Fig. 11.2). An intensive sampling effort is, however, needed in order to measure these maxima (Fig. 11.2). Thus, a monthly sampling programme will only discover one tenth of the actual predicted concentration range for terbuthylazine and diuron.
The recurrence interval for concentrations of terbuthylazine, diuron and isoproturon at the downstream station in the Lillebæk catchment is shown in Figure 11.3. The statistical analysis for this stream station is based on a total of 79 water samples for the entire study period with 28 being sampled under storm events. The predicted recurrence interval for the concentration of terbuthylazine and diuron shows that far less extreme concentrations occur at the downstream station in the Lillebæk catchment than at the upstream station (Fig. 11.2 and 11.3). The predicted concentration range for isoproturon is, however, nearly as wide as that predicted at the upstream station (Fig. 11.3). Less sampling effort is needed to describe the actual concentration range and discover maximum concentrations for terbuthylazine and diuron at the downstream station in the Lillebæk. A monthly sampling programme for terbuthylazine and diuron will discover nearly half of the actual predicted concentration range of terbuthylazine and diuron.
|
