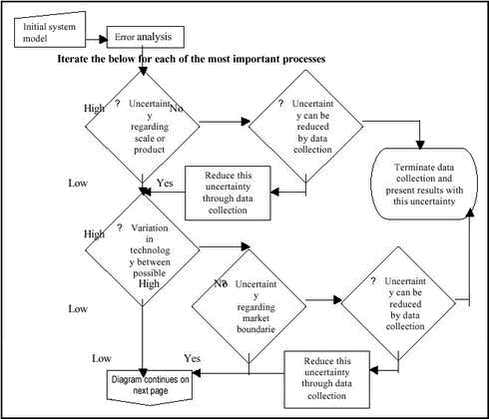
Reducing Uncertainty in LCI3 The uncertainty-based data collection strategy3.1 A procedure to identify the most important uncertainties3.2 Reducible and irreducible uncertainties 3.3 Determining the minimum uncertainty in a life cycle inventory 3.4 The influence of the decision maker 3.5 A procedure for reducing uncertainty 3.6 Reduction of uncertainty by modelling 3.7 Summary of the uncertainty-based data collection strategy 3.8 Application-specific circumstances 3.1 A procedure to identify the most important uncertaintiesUsually, the overall uncertainty of a life cycle inventory is dominated by a few major uncertainties. Likewise, the overall uncertainty of a specific process is typically dominated by one source of uncertainty. All other sources of uncertainty are then of minor importance, and may be ignored. A procedure for identifying the most important uncertainties should therefore begin with those sources of uncertainty that can be expected to be the largest, and can be terminated when further uncertainties can be expected not to contribute significantly to the overall uncertainty. The procedure takes as a starting point the initial system model in which the roughly defined processes are linked by intermediate product flows and rough order-of-magnitude indication of environmental impact is assigned to each process, e.g. using energy or eco-point indicators. The first step in the procedure is then to perform an error analysis of this system model, identifying and ranking the relative impact of these input-parameters on the total environmental output-parameter(s). An error analysis is most easily done by using statistical software, but may also be performed by manual calculation of the environmental impact indicators relating to each process. The same default uncertainty may be assigned to the input-parameters throughout the system model, but it is preferable to use roughly estimated uncertainties based on worst-case considerations, especially if the identification of the process is itself uncertain. The result of the error analysis is a list of the input-parameters in order of decreasing importance, i.e. in decreasing ability to influence the output. Typically, only a limited number of input-parameters - and thus a limited number of processes - will have a strong influence on the output, and only these processes need to be considered in the further analysis. The second step in the procedure is – for the important processes identified in the first step - to quantify any uncertainty in the identification of the processes to include (see section 2.1). The size of this uncertainty depends on the uncertainty in the market data underlying the identification and the actual variation between the possible processes to be included. This uncertainty is likely to be the dominating uncertainty for a process, except when the process can be unambiguously identified (due to a low uncertainty in the underlying market data) or when the variation between the possible processes is low (i.e. not likely to affect the result of the life cycle study). Only for these exceptions, there is a need to consider the further steps in the procedure. The third step in the procedure is to quantify the uncertainty due to mismatch between the desired data and the available data (see section 2.2). This uncertainty will dominate any uncertainty within the available data. Only for data which are truly the desired data, it will be relevant – as a last step in the procedure - to quantify the uncertainty within the available data (see section 2.3). 3.2 Reducible and irreducible uncertaintiesUncertainties can often be reduced by obtaining data of improved quality. This is the case when the cause of uncertainty is lack of data, a mismatch between the available and the desired data, or inadequate sampling procedures. However, in some cases, the uncertainty is inherent to the data, and cannot be reduced by further data collection. This is especially the case:
3.3 Determining the minimum uncertainty in a life cycle inventoryCombining the above distinction between reducible and non-reducible uncertainties with the procedures for identifying the largest uncertainties, as outlined in section 3.1, it appears that the minimum uncertainty of a life cycle inventory will most often be determined by the uncertainty involved in forecasting market data. Only when the most important processes can be unambiguously identified or when the variation between the possible processes is low, the minimum uncertainty may be determined by the uncertainty in forecasting process data, or – when forecasting is not relevant – the uncertainty of average data. When identified, this minimum uncertainty can be used as a boundary below which it is futile to quantify uncertainties further. If the result of a life cycle inventory is expected to be inconclusive at the level of the irreducible uncertainties, more detailed data collection should not be initiated. Especially for certain toxic emissions, and even for entire impact categories such as occupational health and animal welfare, the irreducible uncertainty of average data (e.g. resulting from the variation in management between individual plants) may be larger than the variation between different technologies or products. In such instances, it is futile to collect specific average data for these items. This should not be used as an argument for leaving out these items, but rather to report the items with their full range of general uncertainty, so that they can be seen in proportion to the other items in the life cycle study. The consequence of this inclus ion may then be a requirement for specific certification of all involved production sites with respect to these items. 3.4 The influence of the decision makerWhen the result of a life cycle study is implemented, it will typically affect specific processes. Thus, the more specific the life cycle study is able to identify the processes, which will actually be affected, the lower the uncertainty on the result. By placing specific requirements on the individual processes, the decision-maker may to some extent influence which processes are affected. The uncertainties of the life cycle study may be reduced by specifying the requirements that the decision maker is able and/or willing to make. The degree to which the decision-maker can reduce uncertainty by specifying requirements to the individual processes depends on:
3.5 A procedure for reducing uncertaintyA procedure for reducing uncertainty in life cycle inventory should focus first on the largest sources of reducible uncertainty. This implies:
3.6 Reduction of uncertainty by modellingWhen the main determining parameters of an uncertainty is known, it can be eliminated or at least reduced to the uncertainty by which the specific parameter values can be determined. The remaining irreducible uncertainty from measurement errors and minor unknown causes is often below +/-10%. Examples of models:
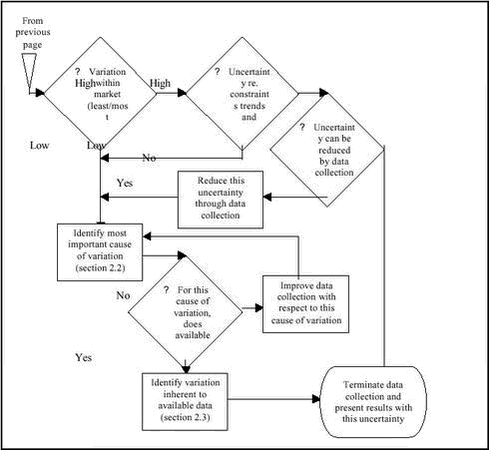
Also for technological choices, it may be possible to make meaningful models, when the causes of the choice of a specific technology are known. For example, fuel choice is to some extent dependent on the specific industrial sector, the size of plant, and the need for specific and easily controlled temperature (Doms 1993). However, it is not always easy to identify the causes of variation. For example, in a study of electricity use for oil transport by pipeline, a variation of +/-70% could only be reduced to +/-35%, even when taking into account height difference, pipe diameter, and capacity utilisation (Frishknecht 1996). Uncertainty may be introduced simply because the way different processes are split up and defined (and thereby how each process is delimited) may vary between data collectors. Also, even when the causes of uncertainty is known and a model is provided, the size of the actual data needed by the model may not be available, so that some model parameters must be estimated, which in itself introduces an uncertainty. 3.7 Summary of the uncertainty-based data collection strategyFigure 4 summarises the procedure for identifying and reducing the most important uncertainties, as described in the previous sections in this chapter. The entire procedure may be carried through with worst-case estimates, but the actual uncertainty of the result will be better reflected when using best estimates with a reasonable uncertainty.
 View the image in full size Figure 4(b). Decision tree showing the uncertainty -based data collection strategy. Figure continued from previous page. 3.8 Application-specific circumstancesThe dominating source of uncertainty in many life cycle studies is the determination of the relevant electricity production scenarios. This is due to the large variation in efficiency and environmental exchanges from different electricity producing technologies, combined with the dominating role of electricity in the production and use phases of many products. In life cycle studies with a long time horizon, the dominating uncertainty will be from forecasting, especially with regard to the determination of market constraints and market trends, but also technology development. Life cycle studies with a short time horizon, the uncertainty will typically be dominated by uncertainty on average data, especially distribution among different technologies at suppliers/customers/waste treatment options (incl. differences in age of technology), but also geographical uncertainty. Life cycle studies with a short time horizon will also be more sensitive to data mismatch and poor data quality, than studies with a longer time horizon. |
