|
Environmental Review No. 1 2004 Orientering fra Miljøstyrelsen Waste Statistics 2001Contents2 Waste generation and treatment
5 Imports and exports of waste
6 Waste sources and status compared to targets for 2004
7 Incineration plants and landfills 8 Projection of waste generation
Annex 1. Tables of waste generation Annex 2 Principles for distribution of waste received at recycling centres and transfer stations Annex 3 Hazardous waste generation 1 IntroductionThe ISAG (Information System for Waste and Recycling) The ISAG was used for the first time in 1993. The 2001 reports are the ninth consecutive reports. The ISAG is based on statutory registration and reporting from Danish waste treatment plants for all waste entering or leaving the plants. Information concerning waste in the previous year must be reported to the Danish Environmental Protection Agency each year, no later than 31 January. In order to avoid double registration, it is important to distinguish between waste from direct (primary) sources and waste from plant (secondary) sources. The principles behind the ISAG registration are shown below.
The Danish EPA carries out quality assurance of the information it receives and collects additional information from sector organisations and other sources. Each year the Danish EPA prepares a publication called Waste Statistics, which gives an overview of waste composition and waste arisings in Denmark. The publication also provides an outline of how much of the total amount of waste has been recycled, incinerated and landfilled. Information is analysed between commercial sources and waste types. New methods The principles for distribution of waste received from recycling centres/transfer stations for the two waste fractions "bottles & glass" and "paper & cardboard" have likewise been changed compared to the years 1994 to 2000. "Paper and cardboard" and "bottles and glass", registered as "industrial and commercial waste", were previously redistributed to the source "institutions, trade and offices" by the ISAG secretariat. The ISAG secretariat has deemed that a redistribution of these waste types to the source "households", will provide a truer and more realistic view of waste composition. See Annex 2 for a more detailed explanation of the principles for the redistribution. In the 2001 statistics, mineralisation of sludge is for the first time included with a dry matter content of 20 per cent. Thus mineralised sludge amounts are incorporated into the statistics with the same dry matter content as the remaining sludge. In previous years dry matter content for sludge for mineralisation has been 1.5 per cent. Please note that the changes mentioned above in reporting of data in 2001, mean that care should be taken when comparing 2001 figures with waste arisings at sector level from previous years. Reading guide Chapter 4 deals with generation and treatment of hazardous waste, and in Chapter 5 developments in imports and exports are described, both for ordinary waste and waste subject to mandatory notification. In Chapter 6, a detailed description of developments in waste arisings and treatment of waste from different sources is given. Furthermore, figures are compared to targets for treatment in 2004 in the Danish Government's Waste Management Plan 1998 - 2004, Waste 21. Chapter 7 gives an outline of Danish incineration plants and landfills. In Chapter 8, a baseline projection of developments in waste generation up to 2020 is presented. The baseline projection is supplemented with a projection including the effects of Waste 21 initiatives on the distribution of waste between treatment options. Conclusions The following statements summarise waste generation in 2001:
2 Waste generation and treatment2.1 Waste generation 2001 and developments 2000 – 2001Waste generation in 2001 and developments in waste arisings from 2000 to 2001 are presented in Table 1. In 2001, Danish waste generation amounted to 12,768,000 tonnes. This corresponds to a decrease of 2 per cent compared to waste generation in 2000. Reductions are primarily due to the fact that sludge for mineralisation in 2001 is stated with a dry matter content of 20 per cent, which is new compared to previous statistics. In previous years dry matter content for sludge for mineralisation has been 1.5 per cent. Sludge for mineralisation has been adjusted to a dry matter content of 20 per cent. Thus mineralised sludge amounts are incorporated into the statistics with the same dry matter content as the remaining sludge. This means that sludge amounts have been reduced by 808,886 tonnes. Part of the reduction stems from a fall in waste arisings from industry, [1] an 11 per cent reduction compared to 2000. This reduction is to a large extent due to a decrease of 223,000 tonnes in ferrous scrap.
Source: the ISAG, Danisco, Association of Danish Recycling Industries and other large scrap dealers, Elsam, Energi E2, and reports to the Danish EPA on sludge from municipal plants applied to farmland etc. and incineration of sludge at sludge incineration plants. (The figures for sludge for recycling and incineration are 2000 figures). Sludge amounts are stated in wet weight, excluding however sludge for mineralisation which has been adjusted to 20 per cent dry matter. Sludge for long-term storage has been included in sludge amounts applied to farmland etc. Sludge for recovery has been included in sludge amounts for incineration. The figures do not include imports of waste. Waste generation is stated as the amounts of waste delivered to treatment plants from all primary sources. Primary sources include waste generation from sources other than waste treatment plants (reprocessing plants, incineration plants, composting/biogas plants and landfills). Slag, fly ash and flue-gas cleaning products from waste incinerations plants have therefore not been included in the calculations, since this would mean a double registration of the waste. Waste generation from the primary source "recycling centres/transfer stations" has been allocated to other primary sources. The principles behind this allocation are explained in Annex 2. Waste from households amounted to 3,083,000 tonnes in 2001. This means that 2001 waste generation was virtually the same as in 2000. Domestic waste arisings remain almost unchanged from the previous year; except from a slight increase of 25,000 tonnes. As Table 1 shows, domestic waste arisings have remained almost unchanged throughout the period 1995 – 2000 – showing only very slight changes from year to year [2]. There is a fall in the three remaining subcategories under household waste. The amounts of bulky waste and garden waste have fallen by respectively 7 per cent, or 50,000 tonnes, and 12 per cent, or 61,000 tonnes, compared to 2000. Waste registered as "other" has fallen by 14 per cent - a total amount of 22,000 tonnes. Amounts of separated packaging waste were reported to the ISAG for the first time in 2001. The total amount of packaging waste reported to the ISAG is 142,898 tonnes. Of this amount, 107,000 tonnes have been registered as domestic waste generated by households in 2001. The generation of waste in the service sector [3]amounted to 1,307,000 tonnes in 2001, which is a 17 per cent increase compared to the 2000 amount – in absolute figures an increase of 188,000 tonnes. The increase is apparent in all fractions except bottles and glass, but it should be noted that the fractions "waste not suitable for incineration", "paper and cardboard", "food waste/other organic waste", "health-care risk waste" and "hazardous waste" increased by 54 per cent, 8 per cent, 25 per cent, 40 per cent, and 29 per cent respectively compared to 2000. Glass is the only fraction showing a fall. The decrease is equivalent to 38 per cent less glass being separated by the service sector. The fall can be explained partly by the changes in the registration of bottles and glass from recycling centres/transfer stations, meaning that around 37,500 tonnes of glass have been moved from the service sector to households. The amounts of waste from industry [4]have fallen. For this source of waste, amounts have fallen from 2,948,000 tonnes in 2000 to 2,616,000 tonnes in 2001 - a decrease of 332,000 tonnes or 11 per cent. The year before, industry experienced an 11 per cent increase in waste arisings. The fall is primarily due to reductions in the fractions "waste suitable for incineration", "waste not suitable for incineration", "paper and cardboard", "food waste/other organic waste", and "ferrous metals". These fractions were reduced by 29 per cent, 35 per cent, 7 per cent, 33 per cent, and 19 per cent respectively. By contrast, the fractions "beet soil", "sludge", "hazardous waste", and "other" have shown an increase of 16 per cent, 24 per cent, 90 per cent, and 38 per cent respectively. The 90 per cent increase in hazardous waste is due to shredder waste having been included in the statistics as a hazardous waste fraction for the first time. Shredder waste was previously registered as part of the non-hazardous fraction "various unburnable". The generation of waste in the building and construction sector was larger in 2001 than in 2000 – construction and demolition waste arisings reached 3,391,000 tonnes, which corresponds to 168,000 tonnes or 5 per cent more than in 2000. By far the major part, or 90 per cent, of waste generated by the building and construction sector is recycled. There has been a 24 per cent reduction in amounts of sludge from municipal wastewater treatment plants. In 2001 that figure was 1,123,000 [5] tonnes, calculated at a dry matter content of 20 per cent. This is 363,000 tonnes less than in 2000. The decrease is due to the new method of calculation mentioned above, used when calculating sludge for mineralisation. Waste generation at coal-fired power plants increased by 3 per cent - a rise from 1,176,000 tonnes in 2000 to 1,211,000 tonnes in 2001. This is due to the fact that energy generation was larger in 2001 than in 2000. Denmark had net exports of electricity in 2001. During the period 1995-2001, waste arisings from coal-fired power plants fell. For the first time in this period, Denmark had net imports of electricity in 2000. Another significant reason for the decrease in residues from coal-fired power plants is that energy to a still larger extent is generated from other fuels than coal and coke [6]. 2.2 Treatment of waste in 2001In the following, developments in treatment of total waste arisings are presented. Furthermore, treatment is related to targets for treatment in the Danish Government's Waste Management Plan 1998 – 2004, Waste 21. Table 2 shows that 8,101,000 tonnes, corresponding to 63 per cent of total waste arisings, were recycled in 2001. In actual figures this means a 360,000-tonne reduction, corresponding to 4 per cent in comparison to 2000.
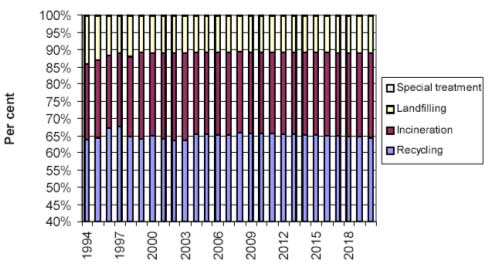
Source: Same as Table 1, plus the Danish Government's Waste Management Plan 1998 – 2004, Waste 21. The total sum of the percentage distribution on the different treatment options for 2001 does not add up to 100 per cent due to rounding. "Special treatment" includes treatment of hazardous waste, also health-care risk waste. Waste incinerated in 2001 amounted to 3,221,000 tonnes. This is actually an increase in amounts of 135,000 tonnes, which as a share of total waste arisings is 25 per cent, as compared to 24 per cent the previous year. Waste led to landfill in 2001 amounted to 1,317,000 tonnes, which is a decrease of 172,000 tonnes from 2000. The rate of landfilled waste amounts to 10 per cent of total arisings. The percentage share of waste led to landfill has fallen by 5 percentage points in the period 1998 to 2001 corresponding to a reduction in landfilled waste arisings of 551,000 tonnes. As the table shows, the relative distribution in recent years among treatment options has varied only little. Variations are often explained by developments in amounts of the different fractions. For example, variations in amounts of residues from coal-fired power plants and construction and demolition waste have large implications on the total rate of recycling, as these two waste types account for a large percentage of total waste arisings and typically have a rate of recycling of 90 per cent or more. According to Waste 21, short-term targets for stabilisation of waste generation are supplemented by a number of qualitative elements such as better exploitation of resources in waste, better quality in treatment of waste and mitigation of problems caused by environmental contaminants in waste. Overall, targets for sectors and fractions mean that the rate of recycling will increase, that more waste is incinerated, and that the need for landfilling will decrease. Overall targets in Waste 21 for waste management in year 2004 are 64 per cent recycling, 24 per cent incineration and a maximum of 12 per cent landfilling. As Figure 1 shows, overall targets for waste treatment were already reached in 1999. The year 2001 has shown a diversion among treatment options primarily due to the new method of calculation for sludge. This means that the rate of waste for recycling has fallen 2 per cent compared to 2000 and is now one percentage point from the target for year 2004. Correspondingly, the target for landfilled waste has been surpassed. This is believed to be attributable to the ban on landfilling of waste suitable for incineration that came into effect on 1 January 1997. However, other factors play a role.
Source: Same as Table 1. Note that total waste arisings in 2004 have been set to correspond to waste arisings in 2001. The figure is not intended as a projection of developments in total waste arisings for 2004. First of all, amounts of residues from coal-fired power plants have decreased significantly. Furthermore, they are recycled to a larger extent than in previous years when they were mainly landfilled. 2.3 Treatment of waste, WITHOUT residues and construction and demolition wasteAmounts of residues from coal-fired power plants not only depend on energy consumption in Denmark, but also on exports of electricity to Sweden and Norway. In addition, due to Energy 21 a still larger shift is taking place from use of coal and coke as fuel to use of natural gas and renewable energy. Since 1996, when Danish electricity exports to Sweden and Norway were particularly large, amounts of residues have decreased steadily. In actual figures this means a decrease of 1,120,600 tonnes, corresponding almost to an almost 50 per cent reduction. Naturally, this has an impact on developments of total waste arisings, but as residues have a very high rate of recycling, it also has an impact on compliance with overall treatment targets. A similar picture is seen for construction and demolition waste. As discussed in section 6.2, the rate of recycling of construction and demolition waste typically reaches around 90 per cent. Therefore, it is interesting to look at the distribution of waste between the different treatment options when residues and construction and demolition waste are kept apart from statistics. Figure 2 shows the distribution of the different treatment options when residues from coal-fired power plants are kept apart from statistics.
Source: Same as Table 1. When residues are kept apart it is seen that 60 per cent of the remaining waste was recycled in 2001, which is a decrease of 386,000 tonnes from 2000. The rate of remaining waste incinerated in 2001 was 28 per cent, which is to say that 157,000 tonnes more waste were incinerated in 2001 than in the year before. The rate of waste for landfilling is 11 per cent, which is a 182,000-tonne reduction compared to 2000. In absolute figures this means that in 2001, apart from residues, 11,556,000 tonnes of waste were generated. Of these, 6,899,000 tonnes were recycled, 3,221,000 tonnes were incinerated, and 1,307,000 tonnes were landfilled. Special treatment was given to 20,000 tonnes, and 109,000 tonnes were temporarily landfilled until incineration capacity becomes available [7]. Total waste amounts without waste from coal-fired power plants increased by 18 per cent from 1995 to 2001. In Figure 3 waste from the building and construction sector has also been kept apart from statistics. This causes a decrease in the rate of remaining waste for recycling, whereas the rates for incineration and landfilling increase. Residues from coal-fired power plants and construction and demolition waste are recycled to a very large extent: in 2001, 99 per cent and 90 per cent respectively, cf. Chapter 6. It is seen that these two fractions play a very significant role in the meeting of overall waste treatment targets in Waste 21.
Source: Same as Table 1. 2.4 Treatment by sources and waste typesFigure 4 shows total waste generation in 2001 distributed on sources and treatment options. Figure 5 shows waste generation distributed on waste types and treatment options. Tables with detailed figures are given in Annex 1. Figure 4 shows that especially waste from the building and construction sector, coal-fired power plants and wastewater treatment plants are characterised by a very high rate of recycling. Waste 21 targets for recycling have been met for waste from these three sectors. The rate of recycling of waste from industry is also relatively high: 65 per cent, which means the target for recycling is met. The high rate of recycling, however, is especially attributable to recycling of ferrous metals. Still too much waste from this sector is led to landfill - 22 per cent against the target of only 15 per cent, and there is a challenge ahead to divert larger amounts of the other fractions from landfilling to incineration or recycling. The rate of recycling of waste from the service sector is not sufficient compared to the target in Waste 21. In 2001, 36 per cent of waste was recycled compared to the target of 50 per cent. The target of 45 per cent incineration has been reached, but also in this sector too much waste is led to landfill; 12 per cent compared to the target of 5 per cent. The challenge here is to divert more waste from landfilling to recycling.
Source: Same as Table 1. Treatment of the waste type domestic waste does not comply with the targets in Waste 21, cf. Figure 5. Only 16 per cent of this waste was recycled in 2001. The recycling rate for the period 1995-2001 has oscillated between 15 per cent and 17 per cent. The target is to reach a recycling rate of 30 per cent in 2004, whereas the targets for incineration and landfilling are 70 per cent and per cent respectively. The rate of domestic waste incinerated in 2001 reached 82 per cent, whereas 3 per cent was led to landfill [8].
Source: Same as Table 1. 2.5 Developments in waste generation 1995 - 2001Table 3 shows total waste arisings in Denmark for the years 1995 - 2001. Waste generation analysed by commercial sources. There is an 11 per cent increase in total waste arisings in the period 1995-2001. Waste generation was largest in 2000. The reduction in 2001 in waste arisings should be seen in the context of the changes in the methods of calculation used. There was an increase of 13 per cent in amounts of waste from 1995 to 1996, after which amounts decreased by approximately 5 per cent up to 1999. From 1999 to 2000 waste arisings have increased by 7 per cent. From 2000 to 2001 waste arisings have fallen 2 per cent. The increase in the first half of the 1990s may partly be due to the fact that coverage of the ISAG system has increased and partly due to real increases in waste amounts. The large amounts in 1996 were primarily due to particularly high amounts of residues from coal-fired power plants in 1996 – which again was due to large exports of electricity to Sweden and Norway.
Source: Same as Table 1. 3 Recycling3.1 Recycling analysed by fractionsTable 4 shows the share of the different waste fractions that are separated for recycling in the form of either reprocessing, composting or bio gasification. The table is not an outline of total amounts generated of each fraction.
Source: The ISAG reports and (1) re ycling industries and other large scrap dealers. (2) Elsam and Energi E2. (3)Reports to the Danish EPA on sludge from municipal wastewater treatment plants applied to farmland etc. Figures from 2000 are used. Sludge for long-term storage has been included in amounts for recycling. (4) To avoid double registration, the figures have been corrected for amounts of ferrous metals that are removed from waste incineration plants. Some fractions, e.g. "other recyclable", "other construction and demolition waste" and "soil and stone" may contribute further to e.g. arisings of tiles and wood after they have been separated. As the table shows, 8,101,000 tonnes of waste were recycled in 2001, which is 4 per cent or 359,000 tonnes less than in 2000. This increase may be attributed to large decreases in recycling of food waste/organic waste, ferrous metals, wood and sludge. By contrast, there were slight increases in the recycling of hazardous waste, bottles and glass, automobile rubber, tiles, other construction/demolition waste, asphalt, soil and stone, and sludge from other sources. 3.2 Paper and cardboardConsumption of virgin paper and the rate of collection of waste paper in the period from 1995 to 2001 are shown in Table 5. Note that the figures for virgin paper consumption in 2001 are not yet available. Total collected waste paper in 2001 amounted to 709,000 tonnes. This is a decrease of 26,000 tonnes or 4 per cent from total amounts collected in 2000.
Source: (1) Material stream monitoring of collected waste paper. (2) The ISAG reports. (3) Statistics Denmark. (4) Some of the increase from 1999 to 2000 is explained by a correction of reporting to the ISAG. In connection with quality control of reports in 2000, 100,000 secondary sources were thus diverted to primary sources. The relevant waste treatment plants have (probably) also registered these sources incorrectly in previous years which may partly account for the differences in calculations of collected waste paper arisings by the ISAG and the material stream monitoring of collected waste paper . (Danish waste paper delivered to Danish paper mills and net exports). The increase in amounts of paper from trade/offices and the decrease in amounts of paper from households are probably due to problems with registration of waste on primary and secondary sources. In connection with the quality control carried out by the ISAG, Smørum Papir stated that they no longer receive waste paper from households. This alone means a decrease of 45,000 tonnes from 2000. No other plants have apparently registered similar increases. Table 6 shows the distribution of collected paper by source. It is no surprise that the largest amounts of collected waste paper come from households, the service sector, [9] and industry.
Source: the ISAG reports 1996- 2001. (1) Note that double registration in 1998 apparently explains why the total amounts are about 20,000 tonnes in excess. Amounts of waste paper collected from households increased by around 10,600 tonnes from 2000 to 2001. Since 1997, amounts of paper collected from households have remained stable at around 180,000 tonnes [10]. Amounts of waste paper collected from the service sector increased by around 17,600 tonnes or 8 per cent. The amount of paper collected from industry has fallen by around 55,100 tonnes corresponding to 17 per cent compared to 2000. In the ISAG, waste delivered to a recycling centre is registered as the commercial source "recycling centre/transfer station". Thus, it is not stated whether waste originated from households or other primary sources. From 2001 recycling centres/transfer stations must indicate a distribution scale for waste types and primary source. Since this is not yet routine, the ISAG secretariat has produced a distribution as shown in Annex 2. 3.3 PlasticPlastic collected for recycling registered in the ISAG amounted in 2001 to 43,000 tonnes, which is an increase of 3,000 tonnes from 2000. However, it is assumed that some plastic has been collected and exported directly for recycling abroad without having been registered at a Danish treatment plant. It is therefore probable that larger amounts have been collected for recycling in Denmark than the 43,000 tonnes. The fraction "plastic" covers both production waste and waste plastic packaging. Every year, detailed statistics are prepared for waste plastic packaging. Statistics for waste plastic packaging in 2000 [11]show that in that year 22,750 tonnes of waste plastic packaging were reprocessed in Denmark. Half of the amount was imported. In 2000, 19,650 tonnes of waste plastic packaging were collected in Denmark. Of this amount, 8,200 tonnes were exported for recycling abroad. Total amounts collected correspond to 12.5 per cent of total Danish consumption of plastic packaging. This is a slight increase from 1999, when 11 per cent of waste plastic packaging was collected for recycling. Waste plastic of the type polyethylene (PE) accounted for 80 per cent of collected amounts. 3.4 Bottles and glassAccording to the ISAG reports, 152,000 tonnes of bottles and glass were collected for recycling in Denmark in 2001. This is 44,000 tonnes more than in 2000. There is no explanation for this increase. However, the ISAG does not give a complete picture of total material streams. This is especially the case with recycling of bottles and glass - a process with several collection, reuse and treatment steps before glass becomes waste. As a consequence, in the following description of total recycling of glass, the ISAG information is supplemented with information from "Statistics on glass packaging 2000" [12], cf. Figure 6.
Source: "Statistics on glass packaging 2000", Ole Kaysen, Econet, Environmental Project No. 697, 2002. Note that total consumption for 1999 has been adjusted upwards compared to "Statistics on glass packaging 1999". The adjustment is due to a write up of amounts of glass packaging for food preservation. Apart from minor fluctuations, consumption of glass packaging has been on the increase throughout the 1990s. Also collection and recycling of glass packaging have been increasing. Collected glass amounted to 126,000 tonnes in 1999 and 129,000 tonnes in 2000. Amounts of recycled glass also increased - from 123,000 tonnes in 1999 to 125,000 tonnes in 2000. This means that the rate of collection of total consumption in 2000 was 66 per cent – a fall of 3 percentage points compared to 1999. The rate of recycling of total consumption in 2000 was 64 per cent, which is a somewhat lower rate than in 1999. Bottles for beer and soft drinks manufactured for reuse are not included in these figures. On average, refillable glass bottles are reused 30 times. If these bottles were manufactured as single-use bottles, it would give an increase in waste glass of around 310,000 tonnes. 3.5 Ferrous metalsTable 7 shows collected amounts of ferrous scrap analysed between consignees. For 2001, it is seen that 871,000 tonnes of ferrous scrap were recycled, and this is a significant decrease of 218,000 tonnes compared to 2000.
Source: (1) ISAG reports, (2) information from the Association of Danish Recycling Industries and other large scrap dealers. Note that calculations in Table 7 differ from those in Table 3. Amongst other things, correction for amounts of ferrous metals removed from waste incineration plants has not been made. The total potential of ferrous scrap is not known precisely. Recycling industries normally estimate a recycling rate in excess of 90 per cent for ferrous scrap. According to the ISAG reports, the Danish Steel Works and other Danish foundries imported 238,000 tonnes of ferrous scrap in 2001, whereas scrap dealers imported around 35,000 tonnes. Total imports in 2001 thereby amounted to 273,000 tonnes of ferrous scrap, which is 57,000 tonnes more than in 2000. Scrap dealers exported 532,000 tonnes of ferrous scrap in 2001, which adds up to net exports in 2001 of 497,000 tonnes. 3.6 Organic waste for composting, wood chipping and bio gasificationAmounts of organic waste led to reprocessing in the form of composting, wood chipping, bio gasification or fodder production are shown in Table 8. Organic waste led to reprocessing in 2001 amounted to 1,116,000 tonnes. This is 36,000 tonnes less than in 2000. This decrease is particularly attributable to a fall in amounts of other organic waste for bio gasification - 55,000 tonnes less in 2001 than in 2000 - and also to a fall of 37,000 tonnes in amounts of garden waste for composting/wood chipping.
Source: The ISAG does not contain information on whether organic materials are reprocessed via composting, wood chipping or bio gasification. Figures are based on assessments and calculations of data from the ISAG reports. (1) According to calculations in "Statistics on treatment of organic waste from households 2001", Econet, Environmental Project 2003, organic domestic waste led to composting and bio gasification amounts to 37, 000 tonnes. Amounts of bark/wood chips and compost removed from treatment plants do not reflect the total amount generated at the plants. Rather, the amounts removed indicate the quantity sold or delivered free of charge from the plants. It is seen from the table that amounts of sold/removed bark/wood chips were about 3,000 tonnes larger than in 2000, whereas amounts of sold/removed compost were 18,000 tonnes larger than in 2000. 3.7 TyresIn 1995, the Minister for Environment and Energy entered an agreement with a number of organisations, on a take-back scheme for used tyres from cars, vans, and motorcycles. The purpose of the agreement is to ensure collection and recycling of used tyres in Denmark. Landfilling is avoided and resource recovery ensured, whereby material recovery is prioritised to energy recovery. The scheme started 1 April 1995 and is financed by a fee on tyres which are covered by the agreement and marketed in Denmark. According to the agreement, the target is to achieve a take-back rate of at least 80 per cent. As per 1 April 2000 the scheme was extended to cover tyres for all types of motor vehicles. Therefore, there is a leap in figures from 1999 to 2000 in Table 9. The table shows a collection rate of about 97 per cent for 2001. This means that practically all types of tyres covered by the scheme are collected.
Source: The Danish EPA figures for the period 1 July 1995 – 31 December 1995 and reports from the Danish Tyre Trade Environmental Foundation in 1996, 1997, 1998, 1999, 2000, and 2001. Figures for the second half of 1995 include 1000 tonnes collected during the first half of 1995, which leads to a higher rate of collection. 4 Hazardous wasteTable 10 shows generation and treatment of hazardous waste in 2000 and 2001 by main groups. The figures cover waste from both primary and secondary sources. Detailed figures on hazardous waste analysed by the ISAG fractions are found in Annex 3. Waste from secondary sources, such as waste from incineration plants, is not included in total waste generation, cf. Table 1. This is due to the fact that waste would otherwise be counted in statistics twice: the first time upon reception at the primary treatment plant and the second time as a residue. However, it is reasonable to include waste from both primary and secondary sources in the assessment of capacity needs for management of hazardous waste.
Source: The ISAG reports 2000 and 2001, and (1) Registrations under the EU regulation on shipment of waste. (2) Danish EPA calculations. A potential collection rate of 120 tonnes has been used for 2000. Calculations for this potential figure are based on the number of batteries becoming defunct each year in combination with an assessment of the amount of time the battery is kept by the user and the amount of time it takes to go through the collection scheme. The difference between the potential collection rate and the actual amount collected (58 tonnes) indicates that some of the batteries have been collected under other sources. Potential collection rates have not been stated for 2001. It is assumed that the difference between amounts collected in 2000 and 2001 (58 tonnes and 91 tonnes respectively) is partly due to batteries collected in 2000 first being registered in 2001. (3) Elsam and Energi E2. (4) Based on the ISAG. It is probable that waste amounts from secondary sources will be exported for landfilling abroad. In Danish Statutory Order no. 660 of 24 September 1986 on asbestos from the Ministry of Labour (now Ministry of Employment), asbestos is divided into three categories: I) dust-emitting asbestos, II) asbestos that may emit dust, and III) non-dust-emitting asbestos. Only asbestos from Category I is hazardous waste - reports to the ISAG, however, cover asbestos from both Category I and II. The table shows that hazardous waste from primary sources amounted to 288,153 tonnes in 2001. This is an increase of 104,790 tonnes from 2000. The major part of the increase is, however, attributable to changes in methods of registration in the ISAG. From 2001, shredder waste must be reported to the ISAG separately. Shredder waste was previously registered in ISAG as part of the non-hazardous fraction "various unburnable". Shredder waste amounted to 92,101 tonnes in 2001. Thus there has only been an actual increase of 12,689 tonnes from 2000 in the amounts of hazardous waste from primary sources. Hazardous waste from secondary sources amounted to 86,149 tonnes in 2001, which is 7,123 tonnes more than in 2000. 5 Imports and exports of waste5.1 ImportsTable 11 shows amounts of waste imported in 2000 and 2001 analysed by waste fractions and treatment options. Denmark imported 316,500 tonnes of waste in 2001, which is 19,000 tonnes less than in 2000. Amounts of waste imported in 2001 correspond to around 2 per cent of total Danish waste generation. This is 2 percentage points less than in 2000 where amounts of waste imported corresponded to 4 per cent of total Danish waste generation.
Source: (1) ISAG reports, (2) Statistics Denmark, (3) Recycling industries and other large scrap dealers, (4) Registrations under the EU regulation on shipment of waste (Council Regulation No. 259/93 on the supervision and control of shipments of waste within, into, and out of the European Community). Around 63 per cent of waste imported is categorised under the EU regulation on shipment of waste [13] as so-called green waste for recovery. Green waste covers primarily glass, paper and cardboard, plastic, ferrous metals, as well as organic waste. Green waste is not subject to mandatory notification under the EU regulation on shipment of waste. Waste imported belonging to the category "other combustible" is destined for incineration with energy recovery and covers oil and chemical waste of different kinds. This type of waste is subject to mandatory notification and is consequently listed in Table 13. 5.2 ExportsTable 12 shows amounts of waste exported from Denmark in 2000 and 2001. Amounts of waste exported in 2001 corresponded to around 10 per cent of total Danish waste generation. In 2001, waste exports amounted to 1,357,687 tonnes or around 128,000 tonnes less than in 2000. The decrease is especially attributable to a decrease in exported amounts of glass, paper and cardboard, and ferrous metals, and in amounts of residues from waste incineration plants. Detailed figures on imported amounts of waste subject to mandatory notification are found in Table 13. Around 66 per cent of waste exported from Denmark in 2001 belongs to the category green waste for recovery. This applies in particular to the fractions "paper and cardboard" and "ferrous metals".
Source: (1) ISAG reports. (2) Statistics Denmark. (3) Recycling industries and other large scrap dealers. (4) Registrations under the EU regulation on shipment of waste (Council Regulation No. 259/93 on the supervision and control of shipments of waste within, into, and out of the European Community). (5) Elsam and Energi E2. (6) Danish-EPA-registered collectors of nickel-cadmium batteries. 5.3 Imports and exports of waste subject to mandatory notificationRegarding waste subject to mandatory notification, Table 13 shows countries Denmark exports to and countries Denmark imports from. Waste subject to mandatory notification means waste that must be notified to the competent authorities of dispatch and the competent authorities of destination according to Council Regulation No. 259/93 on the supervision and control of shipments of waste within, into, and out of the European Community. It is seen from the table that in 2001 Denmark imported around 550 tonnes for disposal, which is about 8000 tonnes less than in 2000. Most of this waste originated from Ireland, mainly consisting of different kinds of oil and chemical waste. The large reduction in 2001 amounts is due to faulty registration in the Danish EPA Transport Database in 2000. Actually, by far the major part of 2000 amounts was recovered at the hazardous waste treatment plant Kommunekemi. In 2001, Denmark imported around 116,000 tonnes of waste for recovery. Most of this waste originated from Norway, Sweden and Ireland and mainly consisted of oil and chemical waste. Amounts of waste imported for recovery thereby remained more or less unchanged from 2000 with imports amounting to around 107,000 tonnes. Waste subject to mandatory notification exported for disposal in 2001 amounted to around 245,000 tonnes or around 126,000 tonnes more than in 2000. This waste was exported to Norway and Germany and mainly consisted of residues from incineration plants. The large increase in exports of residues can not be explained by a similar increase in amounts of waste for incineration. The reason for the increase is that residues to a still greater extent are being removed from temporary landfilling underground and exported for final landfilling in Norway In addition, Denmark exported around 99,000 tonnes of waste subject to mandatory notification for recovery. This is 7000 tonnes less than in 2000. Countries of destination were primarily Finland, Spain, Sweden and Germany. This waste covered mainly metallic ashes and residues, oil and chemical waste, waste from processed cork and wood, and lead batteries. Table 13. Imports and exports in 2001 of waste subject to mandatory notification. Stated in tonnes.
Source: Danish EPA Transport Database. The registration is based on registrations of completed shipments under the EU regulation on shipment of waste (Council Regulation No. 259/93). The competent authorities of destination must submit copies of the completed consignment note to the competent authorities involved no later than 3 working days from receipt of the waste. No later than 180 days after receipt of the waste, the consignee must send proof that the waste has been recovered. OECD waste codes are described in detail in Commission Decision of 21 October 1994, (OJ 1994 L288/36). 5.4 OECD codesAA010 Dross, scalings and other wastes from the manufacture of iron and steel. AA020 Zinc ashes and residues. AA030 Lead ashes and residues. AA040 Copper ashes and residues. AA050 Aluminium ashes and residues. AA060 Vanadium ashes and residues AA070 Ashes and residues containing metals or metal compounds not elsewhere specified or included. AA080 Thallium waste and residues. AA090 Arsenic waste and residues. AA100 Mercury waste and residues. AA110 Residues from alumina production not elsewhere specified or included. AA120 Galvanic sludge. AA130 Liquors from the pickling of metals. AA140 Leaching residues from zinc processing, dusts and sludges such as jarosite, hematite, goethite, etc. AA150 Precious metal bearing residues in solid form which contain traces of inorganic cyanides AA161 Ash from incineration of printed circuit boards AA162 Photographic film ash. AA170 Lead-acid batteries, whole or crushed. AA180 Used batteries or accumulators, whole or crushed, other than lead-acid batteries and waste and scrap arising from the production of batteries and accumulators, not otherwise specified or included. AB010 Slag, ash and residues, not elsewhere specified or included. AB020 Residues arising from the combustion of municipal/household wastes. AB030 Waste from non-cyanide based systems which arise from surface treatment of metals. AB040 Glass waste from cathode-ray tubes and other activated glasses. AB050 Calcium fluoride sludge. AB060 Other inorganic fluorine compounds in the form of liquids or sludges. AB070 Sands used in foundry operations. AB080 Waste catalysts not on the green list. AB090 Waste hydrates of aluminium. AB100 Waste alumina. AB110 Basic solutions. AB120 Inorganic halide compounds, not elsewhere specified or included. AB130 Used blasting grit. AB140 Gypsum arising from chemical industry processes. AB150 Unrefined calcium sulphite and calcium sulphate from flue gas desulphurization (FGD). AC010 Waste from the production/processing of petroleum coke and bitumen, excluding anode butts. AC020 Asphalt cement wastes. AC030 Waste oils unfit for their originally intended use. AC040 Leaded petrol (gasoline) sludges. AC050 Thermal (heat transfer) fluids. AC060 Hydraulic fluids. AC070 Brake fluids. AC080 Antifreeze fluids. AC090 Waste from production, formulation and use of resins, latex, plasticisers, glues and adhesives. AC100 Nitrocellulose. AC110 Phenols, phenol compounds including chlorophenol in the form of liquids or sludges. AC 120 Polychlorinated naphtalenes. AC130 Ethers. AC140 Triethylamine catalyst for setting foundry sands. AC150 Chlorofluorocarbons. AC160 Halons. AC170 Treated cork and wood wastes. AC180 Leather dust, ash, sludges and flours. AC190 Fluff light fraction from automobile shredding. AC200 Organic phosphorous compounds. AC210 Non-halogenated solvents. AC220 Halogenated solvents. AC230 Halogenated or unhalogenated non-aqueous distillation residues arising from organic solvent recovery operations AC240 Wastes arising from the production of aliphatic halogenated hydrocarbons. AC250 Surface active agents (surfactants). AC260 Liquid pig manure; faeces. AC270 Sewage sludge. AD010 Wastes from the production and preparation of pharmaceutical products. AD020 Wastes from the production, formulation and use of biocides and phytopharmaceuticals. AD030 Wastes from the manufacture, formulation and use of wood preserving chemicals. AD040 Inorganic cyanides, excepting precious metal-bearing residues in solid form containing traces of inorganic cyanides. AD050 Organic cyanides. AD060 Waste oils/water, hydrocarbons/water mixtures, emulsions. AD070 Wastes from production, formulation and use of inks, dyes, pigments, paints, lacquers, varnish. AD080 Wastes of an explosive nature, when not subject to specific other legislation. AD090 Wastes from production, formulation and use of reprographic and photographic chemicals and materials not elsewhere specified or included. AD100 Wastes from non-cyanide based systems which arise from surface treatment of plastics. AD110 Acidic solutions. AD120 Ion exchange resins. AD130 Single-use cameras with batteries. AD140 Wastes from industrial pollution control devices for cleaning of industrial off-gases, not elsewhere specified or included. AD150 Naturally occurring organic material used as a filter medium (such as bio-filters). AD160 Municipal/household wastes. RA010 Wastes, substances and articles containing, consisting of or contaminated with polychlorinated biphenyl (PCB) and/or polychlorinated terphenyl (PCT) and/or polybrominated biphenyl (PBB), including any other polybrominated analogues of these compounds, at a concentration level of 50 mg/kg or more. RA020 Waste tarry residues (excluding asphalt cements) arising from refining, distillation and any pyrolitic treatment. RB010 Asbestos (dusts and fibres). RB020 Ceramic-based fibres of physico-chemical characteristics similar to those of asbestos. RC010 Any congenor of polychlorinated dibenzo-furan RC020 Any congenor of polychlorinated dibenzo-dioxin RC030 Leaded anti-knock compounds sludges. RC040 Peroxides other than hydrogen peroxide. RX100 Other wastes not specified with an OECD-code. 6 Waste sources and status compared to targets for 20046.1 Residues from waste incineration plantsFigure 7 shows amounts of residues (slag, fly ash, and flue-gas cleaning products) from waste incineration plants 1995 – 2001 in tonnes, including the treatment options used. Residues from waste incineration plants have not been included in calculations of total waste generation, since that would mean a double registration of the waste. However, residues are a large waste fraction and to secure adequate capacity for its treatment a calculation of amounts is required.
Source: See Tables 1 and 2. Note that arisings in 2004 have been set to correspond to arisings in 2001. The figure is not intended as a projection of developments in waste arisings for 2004. By far the largest part of residues is recycled – the rate of recycling was 88 per cent in 2001 which is 8 percentage points more than in 2000. Residues, however, are not recyclable when containing large quantities of heavy metals, which may leach into the environment and groundwater. In such cases landfilling of the residues is required. According to Waste 21, environmentally harmful waste fractions such as PVC, impregnated wood, waste electronic and electrical equipment must not be assigned to incineration in future. This means that contents of heavy metals in slag will be reduced significantly. However, recycling requirements will be made stricter out of consideration for groundwater. The target of a 70 per cent recycling rate in the previous action plan is therefore maintained in Waste 21. Table 14 shows further treatment of residues from waste incineration plants. Naturally, amounts of residues depend on the amount of waste that is incinerated. Slag and flue-gas cleaning products typically comprise around 20 per cent and 5 per cent, respectively, of waste amounts led to incineration.
Source: Calculations are based on ISAG reports and registrations under the EU regulation on shipment of waste. Note that Table 14 and Figure 7 are not comparable as Figure 7 does not include exports. Table 14 shows that residues from waste incineration amounted to around 539,000 tonnes in 2001 or 23,000 tonnes less than in 2000. Out of the 539,000 tonnes of residues that in total were removed from waste treatment plants, 203,000 tonnes were landfilled, and 406,000 tonnes were recycled. This means that stored amounts of fly ash and flue-gas cleaning products have been reduced by about 70,000 tonnes. From 1996 to 2001, amounts of landfilled residues have increased by 6 per cent and the rate of recycling has increased likewise by 6 per cent. 6.2 Waste from building and construction activitiesWaste from the building and construction sector amounted to 3,391,000 tonnes in 2001 - an increase of 168,000 tonnes or 5 per cent from 2000. By far the major part of waste from the building and construction sector is recycled. The distribution of waste on the different treatment options in 2001 remains unchanged from 2000; 90 per cent was recycled, whereas 2 per cent was incinerated and 8 per cent was led to landfill, cf. Figure 8.
Source: See Tables 1 and 2. Note that arisings in 2004 have been set to correspond to arisings in 2001. The figure is not intended as a projection of developments in waste arisings for 2004. As the figure shows, the recycling rate for construction and demolition waste has increased by 5 percentage points in the period from 1995 to 2001. At the same time the rate of waste for landfilling has dropped 5 percentage points. The figure also shows that the distribution of waste between the different treatment options has been in line with 2004 targets since 1997. The high recycling rate for construction and demolition waste is due partly to the fact that recycled waste, unlike landfilled or incinerated waste, is exempt from taxation, and partly due to a departmental circular on municipal regulation concerning the separation of construction and demolition waste intended for recycling [14]. In addition, the Danish Ministry of Environment and Energy (now Ministry of the Environment) and Danish Contractors' Association entered an agreement on selective demolition of building waste. However, waste treatment can still be improved. Therefore special efforts to separate and treat the most environmentally harmful waste types, such as PVC and impregnated wood, are needed in future. Finally, more use of a cradle-to-grave perspective and environmental planning in connection with new construction will be required. Figure 9 shows construction and demolition waste analysed between mixed and separately collected fractions in 2001. Most of the separately collected construction and demolition waste consists of concrete, other construction and demolition waste, and soil and stone.
Source: ISAG reports 2001. Note that the key to the diagram starts with "not suitable for incineration" shown as 5 % in figure, and should be read clockwise. The increase in total amounts of construction and demolition waste is due to an increase in the fractions "tiles", "other construction and demolition waste", and "soil and stone", which have increased by 30 per cent, 78 per cent and 26 per cent respectively compared to 2000. The increase in amounts of other construction/demolition waste can be explained partly by reductions in remaining fractions. One might suspect that less care has been taken in allocating the waste on specific separately collected fractions during the 2001 registration. Most waste from the building and construction sector is reprocessed at mobile crushing plants that are used for different assignments at shifting locations throughout Denmark. The owner of the mobile crushing plant is responsible for the ISAG reports to the Danish EPA, but sometimes the contractor also registers the waste. The Danish EPA is very much aware of this potential source of double registration and great efforts are made - in cooperation with the providers of the reports - to ensure quality control and avoid double registration. 6.3 Waste generated by householdsWaste from households covers the waste types domestic waste, bulky waste, and garden waste, which in turn are divided into individual fractions, e.g. paper and cardboard, bottles and glass, and food waste/other organic waste. Table 15 shows waste arisings by mixed and separately collected fractions to the extent these have been individually registered. This means that the stated amounts of e.g. paper and cardboard do not show the potential total amounts of paper and cardboard in household waste generation, but only the amounts of waste that have been separated and collected for recycling. The rest of the paper is part of the fraction "various suitable for incineration". Waste arisings in households in 2001 amounted to 3,082,507 tonnes, which means the figure is unchanged from 2000. Domestic waste amounts also remain virtually unchanged from the previous year - showing only a slight increase of 25,000 tonnes. The reductions in total household waste arisings are therefore to be found in amounts of bulky waste and garden waste, which have fallen by 7 per cent and 12 per cent respectively. Domestic waste, however, still makes up the largest part of total household waste generation, namely 55 per cent.
Source: ISAG reports. (1) For the year 1996, ferrous metals are included under "Other". Table 15 shows several changes among the different household waste fractions, so that paper and cardboard, bottles and glass, and ferrous metals have increased by 6 per cent, 38 per cent, and 41 per cent respectively compared to waste arisings in 2000. These increases are balanced by decreases in the fractions garden waste and hazardous waste, which have fallen by 10 per cent and 54 per cent respectively compared to the previous year. 6.3.1 Household waste per capita and per householdIn Table 16 household waste generation is stated per capita and per household. Amounts are moreover analysed between selected waste types and separately collected waste fractions. Total household waste generation stated per capita amounted to 567 kg in 2001, which is 11 kg less than in 2000. Stated per household, waste production amounted to 1261 kg in 2001, which is 33 kg less than in 2000. Domestic waste amounts per capita and per household were 318 kg and 696 kg respectively in 2001. Compared to 2000, this means a slight increase of 4 kg per capita, while the amount per household has decreased by 7 kg.
Source: ISAG reports. Statistics Denmark figures on population growth and number of households have been used. Note that Table 15 and 16 are not directly comparable, as Table 15 concerns waste production analysed by fractions while Table 16 also includes waste types. 6.3.2 Domestic wasteDomestic waste generated by households covers ordinary waste from private household consumption. This includes paper, bottles, glass, organic food waste, and other waste. Usually, domestic waste is collected from households at regular intervals once a week or once every other week. As mentioned above, domestic waste amounted to 1,701,000 tonnes in 2001, which is 25,000 tonnes more than in 2000. Since 1995, domestic waste arisings have varied slightly from year to year without showing any clear trend. Throughout the whole period from 1995 to 2000, arisings have been stable, cf. Table 1. In 2001, 16 per cent of domestic waste was recycled, while 82 per cent was incinerated and 3 per cent landfilled. Compared to 2000, this means a 2 per cent decrease in amounts led to landfill, which is balanced by a 2 per cent increase of the recycling rate. For the years before 2001, packaging waste is included as part of the waste type domestic waste. To make comparison with previous years possible, the 107,000 tonnes of packaging waste have been included in the calculations in Figure 10. As the table shows, the relative distribution in the period 1995 to 2001 among treatment options has varied slightly. If considering the whole period, the trend since 1996 has shown that around 80 per cent of domestic waste is incinerated, while 15 per cent is recycled and 5 per cent led to landfill. Thus, compared to Waste 21 targets, there is still too much waste being incinerated and landfilled. Note that assigning organic domestic waste to incineration is mandatory. However, for islands that do not have a land connection to the mainland there is an exemption from this obligation.
Source: Same as Tables 1 and 2. Note that arisings in 2004 have been set to correspond to arisings in 2001. The figure is not intended as a projection of developments in waste arisings for 2004. 6.3.3 Bulky wasteBulky waste generated by Danish households amounted to 680,000 tonnes in 2001. This is 50,000 tonnes less than in 2000 or a 7 per cent decrease in amounts. During the period from 1995 to 2001 bulky waste arisings increased by 10 per cent. The general increase was interrupted only by minor reductions in the 1997 and 1998 amounts, cf. Table 1. The general increase in amounts of bulky waste is partly due to a real increase in arisings, but the establishment of waste-collection and waste-delivery schemes also plays a significant role. Figure 11 shows the distribution of bulky waste arisings on the three treatment options: landfilling, incineration, and recycling for the period 1995-2001. The period 1995 – 1998 shows an almost unchanged distribution on treatment options: incineration around 40 per cent, landfilling around 43 per cent, and recycling around 17 per cent. The rate of bulky waste for incineration rose to 48 per cent in 1999 and 2000, while the rate of waste for landfilling fell to 36 per cent. In 2001, 49 per cent of bulky waste was incinerated; the rate for landfilling fell to 26 per cent, and the rate for recycling rose to 18 per cent. The remaining 6 per cent of bulky waste is stored temporarily until incineration capacity becomes available [15]. This means that the real rate of bulky waste for incineration is higher than 49 per cent. The target of a maximum landfilling rate of 37, 5 per cent has thus been reached. However, still too much bulky waste is being incinerated and not enough is being recycled. If targets for treatment in 2004 are to be reached, considerable efforts are required to individually separate and collect more of the different waste fractions in bulky waste. A number of initiatives covering e.g. cardboard, waste electronic and electrical equipment, impregnated wood and PVC-containing materials have or are in the process of being implemented.
Source: Same as Tables 1 and 2 Note that arisings in 2004 have been set to correspond to arisings in 2001. The figure is not intended as a projection of developments in waste arisings for 2004. 6.3.4 Garden wasteGarden waste collected from households in 2001 amounted to 458,000 tonnes, which is 61,000 tonnes less than in 2000, corresponding to a fall of 12 per cent. Throughout the 1990s garden waste arisings have increased steadily. During the period from 1995 to 2000 there was an increase of 59 per cent. This increase should not so much be understood as a real increase in garden waste amounts; rather it is the result of increasing opportunities for householders to dispose of garden waste at municipal treatment plants at the expense of home-composting of waste. This leads to larger amounts of waste that need to be treated in the municipal system. Garden waste treatment is presented in Figure 12. In 2001, 99 per cent of garden waste was recycled, and 1 per cent was led to landfill. Thereby, targets for recycling and incineration of garden waste from households have been met with a good margin. Estimates indicate that it is impossible to further increase the recycling rate. Therefore, future efforts with respect to garden waste will concentrate on maintaining the present high recycling rate and to reduce amounts treated in the municipal waste management system.
Source: Same as Tables 1 and 2 Note that arisings in 2004 have been set to correspond to arisings in 2001. The figure is not intended as a projection of developments in waste arisings for 2004. 6.4 Waste from manufacturing industriesWaste generation from industry amounted to 2,616,000 tonnes in 2001, which is 332,000 tonnes or 11 per cent less than in 2000. The distribution of waste from industry on mixed and separated fractions is shown in Figure 13. It is seen that "ferrous metals" by far is the largest single fraction followed by the mixed fraction "waste suitable for incineration", separated "paper and cardboard", and "beet soil". The relative distribution of total industrial waste on the different fractions remained almost unchanged in 2001 compared to 2000. However, as mentioned above there has been a decrease in amounts of industrial waste of around 332,000 tonnes. The fall is primarily due to reductions in the fractions: waste suitable for incineration, waste not suitable for incineration, paper and cardboard, food waste/other organic waste, and ferrous metals. These fractions were reduced by 29 per cent, 35 per cent, 7 per cent, 33 per cent, and 19 per cent respectively.
Source: ISAG reports 2001. Note that the key to the diagram starts with "suitable for incineration" shown as 13 % in figure, and should be read clockwise. By contrast, the fractions "beet soil", "sludge", "hazardous waste", and "other" have shown an increase of 16 per cent, 24 per cent, 90 per cent, and 38 per cent respectively. The increase of 90 per cent for hazardous waste is due to changes in the ISAG calculation methods. Shredder waste has been registered as hazardous waste in 2001, whereas previously shredder waste was reported as part of the non-hazardous fraction "various unburnable". Shredder waste amounted to 92,101 tonnes in 2001. This indicates that in 2001 there has been less separation of recyclable waste such as paper and cardboard, food waste/other organic waste, and ferrous metals, as compared to the previous year. The treatment of waste from industry is shown in Figure 14. In 2001, 65 per cent of the waste was recycled. In absolute figures, this means 1,688,000 tonnes were recycled in 2001 compared to 1,896,000 tonnes in 2000 - corresponding to a fall of 208,000 tonnes. The rate of industrial waste incinerated in 2001 reached 12 per cent, which is 3 percentage points less than in 2000. The rate led to landfill remained almost unchanged from 2000 at 22 per cent. This means that the target of landfilling a maximum of 15 per cent of industrial waste has not been met. Still far too much of waste from industry is landfilled. Even if the rates of recycling and landfilling have taken a positive direction since 1995, there is still some way to go before the targets for these two treatment options have been met. Amounts and composition of waste from manufacturing industries depend on the sector generating the waste, as well as size and number of enterprises. Possibilities of minimising or recycling waste will therefore differ from one waste fraction and sector to another.
Source: Same as Tables 1 and 2. Note that arisings in 2004 have been set to correspond to arisings in 2001. The figure is not intended as a projection of developments in waste arisings for 2004 In order to meet targets in Waste 21, the Danish EPA has selected a number of waste types from industry for special attention. One such waste type is shredder waste. New treatment technologies will contribute to diverting shredder waste from landfilling to recycling. Another waste type in focus is hazardous waste, for which collection schemes will be established with a view to separation and recycling. Through the latest amendment to the Statutory Order on Waste, The Danish EPA has implemented a number of changes to the ISAG system so that from year 2001 it will be possible to state figures for waste from industry in eleven different sectors. In future a number of enterprises [16] must in addition keep a register in a specific format with various information on their waste generation. This will enhance the possibility of conducting sector-specific analyses and initiatives in industry. Waste generation in industry stated by sector and treatment option can be seen in Table 17. As the table shows, almost 35 per cent of industry waste arisings in 2001 has been reported with the discontinued source "manufacturing industries etc." This is because a number of reporting plants, due to technical reasons, continued registering waste according to the provisions of the old Statutory Order during part of 2001. The 2001 figures are therefore only indicative of the distribution of waste between the different sectors.
Source: ISAG reports 2001. The Table does not cover beet soil and ferrous metals reported by large scrap dealers. Note that amounts have been rounded to the nearest hundred. "Manufacturing industries etc." covers amounts that for technical reasons have been reported according to provisions in the old Statutory Order. 6.5 Waste from institutions, trade and officesWaste generated by the service sector [17] amounted to 1,307,000 tonnes in 2001, which is 188,000 tonnes or 17 per cent more than in 2000.
Source: ISAG reports 2001. Note that the key to the diagram starts with "suitable for incineration" shown as 52 % in figure, and should be read clockwise. Waste from the service sector analysed between mixed and separated fractions is shown in Figure 15. The relative distribution is almost the same in 2001 as in 2000. "Waste suitable for incineration" and "paper and cardboard" are the two largest waste fractions generated by institutions, trade and offices, making up respectively 52 per cent and 19 per cent of waste from this source. The increase in waste arisings from the service sector in 2001 is noticeable in all fractions. However, the increase is most significant in the following fractions: waste not suitable for incineration, paper and cardboard, food waste/other organic waste, health-care risk waste, and hazardous waste. These fractions increased by 54 per cent, 8 per cent, 25 per cent, 40 per cent, and 29 per cent respectively compared to 2000. Glass is the only fraction showing a fall. The decrease is equivalent to 38 per cent less glass being separated by the service sector. The fall can be explained partly by the changes in the registration of bottles and glass from recycling centres/transfer stations, meaning that around 37,500 tonnes of glass have been moved from the service sector to households. Of the 1,307,000 tonnes of waste generated by the service sector in 2001, 36 per cent was recycled and 49 per cent was incinerated, whereas 12 per cent was led to landfill and 3 per cent was stored temporarily, cf. Figure 16. The rate of service sector waste led to incineration has increased by 3 per cent compared to 2000 and 3 per cent is in temporary storage until incineration capacity becomes available [18]. Thus the rate of waste for incineration is actually higher than the 49 per cent mentioned above. Compared to the previous year, the recycling and landfilling rates have fallen by 4 per cent and 2 per cent respectively. This means that there has been a diversion from landfilling and recycling to incineration. Compared to the 2004 targets for treatment in Waste 21, still too little waste from the service sector was recycled and too much landfilled in 2001. If targets are to be met, separation and collection of waste must be improved so that a larger proportion of recyclable materials can be recycled and so that environmental contaminants can be separated and treated separately.
Source: Same as Tables 1 and 2. Note that arisings in 2004 have been set to correspond to arisings in 2001. The figure is not intended as a projection of developments in waste arisings for 2004. 6.6 Residues from coal-fired power plantsThe generation of residues at coal-fired power plants varies from one year to the next due to variations in Danish imports/exports of electricity to and from Sweden and Norway. Imports/exports of electricity to and from Sweden and Norway depend largely on precipitation in these countries – if there is much precipitation much electricity is generated from hydropower in Sweden and Norway, and Danish exports will be correspondingly lower. For example, in 1996 exports of electricity were particularly high, which is reflected in amounts of residues in that year, cf. Figure 17. In 2000, there was much precipitation in Sweden which resulted in so much cheap hydroelectricity on the market that power plants in both Denmark and Norway had to cease operations temporarily. Amounts of residues have decreased steadily since 1996. This decrease is explained partly by less power exports in the years since 1996, and partly by the Danish Government's Energy Action Plan, "Energy 21", according to which natural gas and renewable energy sources, including bio-fuels, shall substitute coal in the long-term perspective. Energy statistics [19] show that a decreasing part of electricity generation is based on coal. Also in future, Energy 21 will result in a decrease in residues from coal-based energy generation, whereas there will be an increase in fly ash and bottom ash from bio-fuels. Residues from coal-fired power plants amounted to around 1,211,000 tonnes in 2001, which is an increase of 3 per cent from 2000. As Figure 17 shows, 99 per cent of residues was recycled and 1 per cent was landfilled.
Source: Same as Tables 1 and 2. Note that arisings in 2004 have been set to correspond to arisings in 2001. The figure is not intended as a projection of developments in waste arisings for 2004. Table 18 states recovery of residues in 2001 in more detail. More than 90 per cent of residues is used as raw materials in industrial manufacture of, for example, cement, concrete and plaster board, whereas the remaining part is primarily used as backfilling either in accordance with the provisions of Statutory Order no. 655 of 27 June 2001 from the Ministry of the Environment, or as backfilling with special approval under the Danish Environmental Protection Act.
Source: Reports from Elsam and Energi E2. 6.7 Sludge from municipal wastewater treatment plantsAs mentioned above, it was decided to state amounts of sludge for mineralisation with a dry matter content of 20 per cent, so that sludge for mineralisation would be stated with the same dry matter content as the remaining sludge. As a consequence, sludge amounts have been reduced by 808,886 tonnes. Sludge from municipal treatment plants amounted to 1,123,000 tonnes in 2001, which is a decrease of 24 per cent or 353,000 tonnes from 2000. The figures only include sludge, excluding sand and screenings. If stated in wet weight, sludge arisings from municipal wastewater [20]would have amounted to 1,932,000 tonnes in 2001, which is 456,000 tonnes more than in 2000 or equivalent to a 31 per cent increase. The larger figures for sludge amounts when stated in wet weight are primarily due to new treatment technologies for sludge. They do not indicate that sludge arisings in general are increasing but that higher water content is included in the statistics. Treatment of sludge from municipal wastewater treatment plants is shown in Figure 18. According to the Figure, 67 per cent of the sludge is recycled, 27 per cent is incinerated, and 6 per cent is landfilled. The figures for recycling include 65,585 tonnes of sludge with a dry matter content of 20 per cent, corresponding to 874,471 tonnes when stated in wet weight, which is treated in long-term storage with the objective of further mineralisation. Amounts are included in recycling as it is expected that this sludge will be recycled in some years. In connection with treatment in sludge mineralisation plants (long-term storage), sludge is registered with around 0.5 – 1 per cent dry matter, whereas alternatives typically contain 20 per cent. Sewage sludge is mainly recovered as fertiliser on farmland. In future, more stringent requirements for the contents of certain organic and chemical substances will be made in relation to application to farmland. In the short-term perspective, the rate of recycling is therefore expected to decrease. However, in future, the quality of sludge is expected to improve due to the general policy of phasing-out of xenobiotic substances.
Source: Same as Tables 1 and 2. Note that arisings in 2004 have been set to correspond to arisings in 2001. The figure is not intended as a projection of developments in waste arisings for 2004. Figures for recycling include 65,585 tonnes of sludge with a dry matter content of 20 per cent, corresponding to 874,471 tonnes when stated in wet weight, for long-term storage. Figures for incineration include 116,927 tonnes for other recovery (production of Carbogrit and concrete). Furthermore, it seems that alternative methods for the recovery of sludge are being developed to an ever greater extent. After sludge incineration, the inorganic residue is recovered in the production of, for example, sand blasting agents or cement. Sludge recovered by such alternative methods in 2001 [21] amounted to around 117,000 tonnes. In Figure 19 these 117,000 tonnes have been included in incineration, as these treatment methods are considered as recovery and not recycling. 7 Incineration plants and landfills7.1 Incineration plantsIn 1999, total waste incineration capacity was around 2,726,000 tonnes, distributed between 31 plants, cf. Table 19. This is an increase in capacity of 253,000 tonnes compared to the 1996 capacity. In the beginning of the 1990s, an extensive conversion of waste incineration plants from heating generation to combined power and heating generation took place. In this connection, capacity adjustments were effected in relation to expected waste amounts for incineration in future. As a result of the ban on landfilling of waste suitable for incineration that took effect on 1st January 1997, there is now increasing pressure on incineration capacity. Amounts of non-recyclable waste suitable for incineration will be surveyed regularly in order to ensure necessary incineration capacity.
Sources: Rambøll & Hannemann 1990: Analysis of data for energy plants based on waste, for the Danish EPA and the Danish Energy Agency. The Danish EPA and the Danish Energy Agency 1994: Waste resources for waste incineration 1993 and 2000. The Danish EPA and the Danish Energy Agency 1997: Waste amounts for incineration year 2000. The Danish EPA and the Danish Energy Agency 2001: Waste incineration in 2004 and 2008. Amounts and capacities. Figures for 1989 and 1995 are calculated on the basis of nominal capacity at 7,000 hours/year. Figures for 1996 and 1999 are based on actual hours of operation of plants. District heating capacity (DH) may be subject to restrictions under the Danish Heat Supply Act. CPH = combined power and heating. In figures for 1999 the nominal capacity includes plants built in 1999. This gives a larger nominal capacity as furnaces were not fully implemented in 1999. 7.2 LandfillsToday, there are 134 landfill facilities in Denmark with an environmental approval, according to a questionnaire study conducted by the Danish EPA in February/March 2001, cf. Table 20. In addition, there are a small number of landfill facilities for harbour sludge. Of these, 100 facilities are owned by public authorities, whereas 34 are under private ownership. The 100 public facilities cover 51 landfills, 25 inert waste landfills, and 24 mono-landfills. The privately owned facilities cover 3 landfills, 10 inert waste landfills, and 21 mono-landfills. According to the study the legal protection period has expired for just below half of the 134 landfill facilities. A landfill is defined as a site receiving waste that, immediately, or over time, presents a risk of pollution of groundwater, surface water and/or air. A landfill for inert waste is a site receiving waste that does not, or only to a very limited extent, presents a risk of pollution of groundwater, surface water and/or air. A mono-landfill is a site receiving only one or a limited range of waste types with known composition. As a consequence of the above-mentioned ban on landfilling of waste suitable for incineration, in combination with an increased and further differentiated waste tax, a large drop in landfill capacity needs is expected. However, this may be counterbalanced by more stringent requirements for dredging of harbour sludge and recycling of residues.
Source: Danish EPA: Working Report no. 54, Landfill Capacity 1992. Danish EPA 1997: Working Report no. 33, Landfills in Denmark, plus own calculations. Questionnaire study carried out by the Danish EPA in February/Marchs 2001. 8 Projection of waste generation8.1 Model suitability for describing historical developmentsSection 8.2 presents a baseline projection of waste generation up to year 2020. The so-called Risø model has been used for the projection. The projection is based on the Budget Statement projection 2001, the latest projection from March 2001 from the Danish Energy Agency and a calibration of the model for ISAG data for 2000. Before making the projection, the suitability of the model for describing historical developments in waste generation was evaluated. This was done by calibrating the model for Waste Statistics 2000, and having it calculate developments in waste arisings from 1994 – 2000. Actual waste arisings for the period 1995 - 2000 have increased by about 14 per cent. [22]However, model calculations show waste arisings as unchanged. A significant part of this deviation is due to the fact that the model calculates a larger decrease in the generation of residues from coal-fired power plants than what was actually the case. As to generation stated endogenously [23] in the model, economic developments may explain around half of the increase in total generation from 1995 to 2000. Around 250,000 tonnes of the deviation of 977,000 tonnes in 1995 may be explained by a larger collection of garden waste which is described exogenously in the model [24]. In addition, the increase in recyclable fractions is considerably larger than the decrease in the generation of "various non- combustible". A significant part of this increase is due to increased recycling of construction and demolition waste. If this is adjusted, there is a deviation in 1995 of around 400,000 tonnes between the model and actual generation registered. This deviation is due to significantly higher waste arisings in 2000, particularly in the fractions ferrous metals, wood, soil and stone, and sludge. 8.2 Baseline projection of waste generation 1994 – 2020The baseline projection of waste generation estimates an increase in total waste generation from 2000 to 2020 of 27 per cent, corresponding to an increase from 13 million tonnes in 2000 to 16.5 million tonnes in 2020, cf. Figure 1 [25]. The baseline projection describes expected developments in waste generation on the basis of estimated economic activity. It is assumed that no new political initiatives on waste are launched. An increase in production and consumption of 43 per cent and 53 per cent respectively is, however, expected. Thus, the model projects waste generation to increase less than economic activity. Significant reasons for this are the decreasing use of coal at power plants and expected low growth in building and construction activities. Figure 1. As Figure 1 shows, the baseline projection estimates a steeper increase in amounts of "combustible" waste and "non-combustible" waste than in recyclable fractions such as paper and cardboard, glass and plastic. Amounts of ferrous metals and automobile tyres are expected to increase relatively much due to the expected increase in industrial production and the expected increase in the number of private cars and motor cycles. The modest increase in amounts of slag is due to an expectation of an almost constant use of coal in the period. Amounts of beet soil are expected to decrease due to new technologies causing less soil to stick to the beets during harvesting. However, depending on weather conditions during harvesting there are normally large variations from year to year. Amounts of sludge from municipal wastewater treatment plants are expected to increase due to new treatment technologies causing water contents in the sludge to increase with unchanged amounts of dry matter. This is expected to lead to an increase of 500,000 tonnes in the next five years without a corresponding increase in dry matter amounts. This means that the rate of waste for recycling decreases from around 64.8 per cent in 2000 to around 62.5 per cent in 2020. Correspondingly, the rate led to incineration passes from around 24 per cent in 2000 to around 26.4 per cent in 2020. The rate led to landfill will remain relatively constant around 11 per cent, cf. Figure 2. Figure 2.
8.3 Waste 21 projection 2000 – 2020In the Danish Government's Waste Management Plan, Waste 21, a number of targets for treatment of waste up to 2004 have been set. Many of the initiatives in Waste 21 focus on increased separation of specific waste fractions with a view to diverting waste from incineration to recycling. But an equally important target of Waste 21 is to stabilise total waste generation. Based on the baseline projection, a Waste 21 scenario has been drawn up, cf. Figure 3. In the Waste 21 scenario the initiatives contained in Waste 21 for increased separation and recycling of paper and cardboard, glass, plastic and organic waste have been included for the years 2000 to 2004. No further assumptions for increased separation for the period 2004 – 2020 have been made. Therefore, based on the Waste 21 adjustments, this period is only based on the projection suitability of the model. Initiatives relating to developments in total waste generation have not been included in the Waste 21 scenario, as a draft strategy for waste prevention is only expected to be available in early 2003. Figure 3. A comparison with the baseline projection of Figure 1 primarily shows a reduction in the generation of the mixed fraction "combustible" waste and an increase in the generation of the recyclable fractions "paper and cardboard", "glass" and "plastic", cf. Figures 4 and 5. Figure 4.
Figure 5.
Assuming no further measures are taken against developments in waste generation after 2004 [26] the Waste 21 adjustments for 2000 – 2020 mean that the rate of waste in 2020 for incineration will be reduced from 26.4 per cent to 24.6 per cent, whereas the rate of waste for recycling will increase from 62.5 per cent to 64.4 per cent. This means that Waste 21 will ensure that the rate of recyclable fractions will be the same in 2000 and 2020, causing the distribution on treatment options to be largely the same in 2000 and 2020, cf. Figure 6. Without the initiatives in Waste 21, cf. the baseline projection, there would be a decreasing rate of fractions for recycling. Figure 6. 
Annex 1. Tables of waste generation Table 1. Waste generation in Denmark in 1999, 2000 and 2001, and target for year 2004. Stated by source and treatment option. Stated in `000 tonnes and in per cent.Source: ISAG reports, Waste 21 - the Danish Government's Waste Management Plan 1998 - 2004, Danisco, Association of Danish Recycling Industries and other large scrap dealers, reports to the Danish EPA on sludge applied to farmland etc. and incineration of sludge at sludge incineration plants (figures from 1999). Waste amounts from wastewater treatment plants include sand and screenings. Table 2. Waste generation in Denmark in 1999, 2000 and 2001 stated by waste type and treatment option. Stated in `000 tonnes and in per cent. Annex 2 Principles for distribution of waste received at recycling centres and transfer stationsRecycling centres/transfer stations The ISAG includes a commercial source "recycling centres/transfer stations". This means that waste from households, for example, delivered via transfer stations is not registered as waste from "households". Waste generation from the primary source "recycling centres/transfer stations" has therefore been allocated to other primary sources. This distribution is obviously based on estimates. - All domestic waste from "recycling centres/transfer stations" is converted into domestic waste from the source "households". - All bulky waste, from "recycling centres/transfer stations", apart from the fractions "paper and cardboard" and "bottles and glass", is converted into bulky waste from the source "households". - All bulky waste covering the fractions "paper and cardboard" and "bottles and glass" is converted into "domestic waste" and transferred from the source "recycling centres/transfer stations" to the source "households". - All garden waste from "recycling centres/transfer stations" is converted into garden waste from the source "households". - 75 per cent of all industrial and commercial waste from "recycling centres/transfer stations" covering the fraction "paper and cardboard" is converted into "domestic waste" from the source "households". - 25per cent of all industrial and commercial waste from "recycling centres/transfer stations" covering the fraction "paper and cardboard" is converted into industrial and commercial waste from the source "institutions, trade and offices". - All industrial and commercial waste from "recycling centres/transfer stations" covering the fraction "bottles and glass" is converted into "packaging waste" from the source "households". - All industrial and commercial waste from "recycling centres/transfer stations", apart from the fractions "concrete", "tiles", "other construction and demolition waste", "asphalt", "wood", and "asbestos", is converted into industrial and commercial waste from the source "institutions, trade and offices". - All industrial and commercial waste from "recycling centres/transfer stations" covering the fractions "concrete", "tiles", "other construction and demolition waste", "asphalt", "wood", and "asbestos" is converted into industrial and commercial waste from the source "building and construction sector".- All hazardous waste from "recycling centres/transfer stations" is converted into hazardous waste from the source "households". - All waste of the type "treatment residues" and "not informed" from "recycling centres/transfer stations" is converted into a new source: "other". Bulky waste - All waste of the type "bulky waste" from the sources "institutions, trade and offices", "manufacturing industries", and "building and construction sector" is converted into "industrial and commercial waste", although deriving from the same sources. Glass - Irrespective of waste type all waste belonging to the fraction "bottles and glass" from the source "households" is converted into "packaging waste" from the source "households". Sludge - Conversion of dry matter content in sludge. Contents of dry matter in sludge for mineralisation are converted from 1.5 per cent dry matter to 20 per cent dry matter. Ferrous metals - Reports to the ISAG on ferrous metals are made according to the Danish Statutory Order on Waste by enterprises, including smelting works, that reprocess collected and separated ferrous metals by remelting. Scrap dealers that collect ferrous metals are not subject to mandatory reporting to the ISAG, but are requested to keep a register in accordance with the ISAG provisions. - The Danish EPA receives information from scrap dealers directly from the Association of Danish Recycling Industries and other large scrap dealers. In waste statistics, such ferrous scrap has been attributed to the source "manufacturing industries". Annex 3 Hazardous waste generationFootnotes[1]Manufacturing industries etc. [2]Developments from 1995 to 2001 are described in more detail in section 2.5. [3]Institutions/trade and offices. [4]Manufacturing industries. [5] The 2001 figures from municipal wastewater treatment plants of amounts of sludge applied to farmland and incineration of sludge at sludge incineration plants is not yet available. For recycling and incineration, 2000 figures from the Danish Environmental Protection Agency's sludge statistics have been used, whereas for landfilling the ISAG figures for year 2001 have been used. [6] The Danish Energy Agency's preliminary statement of energy generation, consumption and CO2 emissions. [7] Exemption clause in Section 37(3) Danish Statutory Order on Waste (Statutory Order No. 619 of 27 June 2000). [8] Note that organic domestic waste is to be be assigned to incineration. However, for islands that do not have a land connection to the mainland there is an exemption from this obligation. [9] Institutions/trade and offices. [10] Amounts registered in 1998 are probably 20,000 tonnes in excess due to double registration. [11] Environmental Project No. 602, 2001. [12] The figures for 2001 are not yet available. [13] Council Regulation No. 259/93 on the supervision and control of shipments of waste within, into and out of the European Community [14] Circular no. 94 of 21 June 1995. [15] Exemption clause in Section 37(3), Danish Statutory Order on Waste (Statutory Order No. 619 of 27 June 2000) [16] Enterprises under the duty of notification and approval, cf. Appendix 1 to Statutory Order no. 367 of 10 May 1992 on other activities than listed activities, with later ammendments, and Appendix 1 to Statutory Order no. 646 of 29 June 2001 on approval of listed activities. [17] The service sector covers institutions, trade and offices. [18] Exemption clause in Section 37(3), Danish Statutory Order on Waste (Statutory Order No. 619 of 27 June 2000) [19] The latest Energy Statistics publication is found on the Danish Energy Agency homepage: www.ens.dk [20] 2001 figures from municipal wastewater treatment plants on amounts of sludge applied to farmland and incineration of sludge at sludge incineration plants are not yet available. For recycling and incineration, 2000 figures from the Danish EPA sludge statistics have been used, whereas for landfilling ISAG figures for year 2001 have been used. [21] Figures for 2001 are not yet available. [22] Part of the increase is attributable to extension of the statistical basis. [23] I.e. calculated within the assumptions of the model. [24] I.e. fixed beyond the model. [25] Note that e.g. amounts of paper and cardboard are not an expression of total potential of this fraction, but merely state amounts of paper and cardboard separated for recycling. Thus the fraction "combustible" may also contain paper and cardboard and other recyclable fractions. [26] Further initiatives in the waste management area are, however, to be exepceted for the period after 2004 once a successor to Waste 21 is available.
|
|||||||||||||||||||||||||||||||||||||||||||||||||||||||||||||||||||||||||||||||||||||||||||||||||||||||||||||||||||||||||||||||||||||||||||||||||||||||||||||||||||||||||||||||||||||||||||||||||||||||||||||||||||||||||||||||||||||||||||||||||||||||||||||||||||||||||||||||||||||||||||||||||||||||||||||||||||||||||||||||||||||||||||||||||||||||||||||||||||||||||||||||||||||||||||||||||||||||||||||||||||||||||||||||||||||||||||||||||||||||||||||||||||||||||||||||||||||||||||||||||||||||||||||||||||||||||||||||||||||||||||||||||||||||||||||||||||||||||||||||||||||||||||||||||||||||||||||||||||||||||||||||||||||||||||||||||||||||||||||||||||||||||||||||||||||||||||||||||||||||||||||||||||||||||||||||||||||||||||||||||||||||||||||||||||||||||||||||||||||||||||||||||||||||||||||||||||||||||||||||||||||||||||||||||||||||||||||||||||||||||||||||||||||||||||||||||||||||||||||||||||||||||||||||||||||||||||||||||||||||||||||||||||||||||||||||||||||||||||||||||||||||||||||||||||||||||||||||||||||||