|
Ozone depleting substances and the greenhouse gases HFCs, PFCs and SF6 1 Summary and conclusions1.1 Ozone-depleting substancesODP-weighted consumption for 2002 has been calculated at 42.97 ODP tonnes, which is a reduction of 42.19 ODP tonnes compared to 2001, which measured 85.16 ODP tonnes. The table below shows ODP-weighted consumption calculated on the basis of information on imports from Statistics Denmark, importers and producers. The ODP values are listed in Appendix 1, Table 1.A. Table 1.1 Overview of consumption and ODP-weighted consumption in 2001-2002, tonnes
(1) When calculating the ODP-weighted consumption of CFCs, only CFC-113 has been registered and included in the basis of the calculations. Danish consumption of methyl bromide has only been used as feedstock for other chemical production. Therefore it is not included as an emission. CFCs, tetrachloromethane, and trichloroethane are used exclusively for laboratory purposes. HCFCs are used as refrigerants or for foam production (system foam). The areas of application of HCFCs in 2002 are shown in Table 1.2. Table 1.2 Consumption of HCFCs by application area in 2002, tonnes
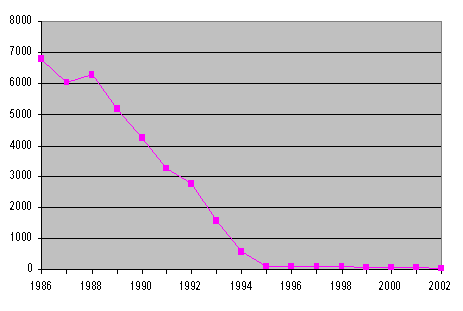
HCFC-22 is used as a refrigerant, and HCFC-141b is used for foam. Figure 1.1 shows the development of ODP-weighted consumption.
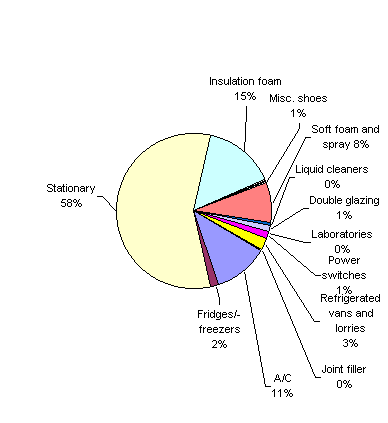
Figure 1.1 The development of ODP-weighted consumption 1986-2002, tonnes The specific consumption figures for individual substances and groups of substances and the ODP contribution calculated for the period 1986-2002 appear in Table 3.1 in Chapter 3. 1.2 Greenhouse gasesThe GWP-weighted actual emissions of HFCs, PFCs, and SF6 in 2002 measured approx. 715,000 tonnes CO2 equivalents. The equivalent emissions were approx. 698,900 tonnes CO2 equivalents in 2001, which is equivalent to a total increase of approx. 16,100 tonnes CO2 equivalents. Emissions of HFCs, PFCs, and SF6 in 2001 accounted for less than 1 per cent of the total Danish GWP contribution /18/. In Table 1.3 below, actual emissions and stock from products are summarised after making adjustments for any imports and exports of substances in products. In Figure 1.2 below, total GWP contributions from HFCs, PFCs, and SF6 are shown in relation to individual sources. The figure shows which sources were responsible for the greatest individual contributions in 2002.
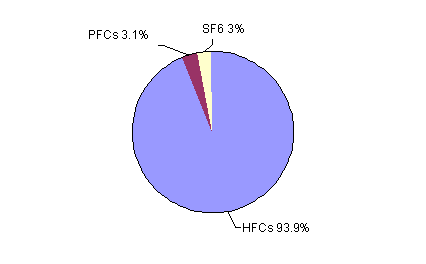
Figure 1.2 The relative distribution of the GWP contribution analysed by source The figure shows that emissions from refrigerants used in commercial stationary refrigerators account for the largest GWP contribution. Such refrigerators make up approx. 58 per cent of the total actual contribution in 2002. The contribution is primarily due to HFCs, and, to a lesser degree, PFCs. The second largest GWP contribution, measuring 21 per cent, comes from continuing emissions of HFCs from the insulating foam in fridges and freezers. 11 per cent of the GWP contribution derives from HFC emissions in the production of soft foam and the use of aerosol sprays employing HFCs. The primary sources of SF6 emissions in 2002 are from power switches, accounting for about 1 per cent of the total GWP contribution. HFCs comprise approx. 93.9 per cent of the total GWP contribution in 2002. Emissions of SF6 make up 3 per cent and emissions of PFC contribute 3.1 per cent to the total contribution. Compared to the level in 2001, the relative proportion of HFC emissions has risen slightly. The relative distribution is shown in Figure 1.3 below.
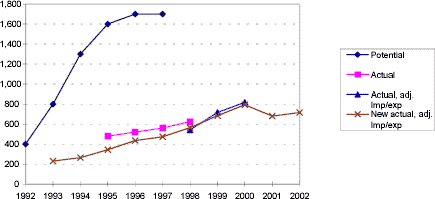
Figure 1.3 The relative distribution of the GWP contribution from HFCs, PFCs, and SF6, 2002 1.2.1 HFCsThe total consumption of HFCs measures 713.2 tonnes in 2002, which is an increase compared to the consumption of approx. 676 tonnes in 2001. Primarily, consumption of HFC-404a and HFC-407c has risen. The total GWP contribution from HFCs is approx. 671,200 tonnes CO2 equivalents, which is an increase of approx. 24,800 tonnes (calculated according to the most recent calculation method) compared to the GWP contribution from HFCs in 2001. 1.2.2 Sulphur hexafluoride (SF6)Consumption of sulphur hexafluoride was 1.4 tonnes in 2002, which represents a significant drop in consumption when compared to 4.7 tonnes in 2001. This is due to significantly reduced consumption of SF6 for power switches (GIS stations) in the electricity sector. In 2001, a GIS station was installed and this alone represented 3 tonnes of the total consumption. Actual emissions have been calculated as 0.9 tonnes, equivalent to a GWP contribution of 21,600 tonnes CO2 equivalents. In 2001, emissions were approx. 30,400 tonnes CO2 equivalents. 1.2.3 Perfluorinated hydrocarbons (PFCs)Consumption of perfluorinated hydrocarbons (perfluoropropane) measured 1.9 tonnes in 2002. 0.5 tonnes are estimated to have been used for cleaning liquids, and the remaining 1.4 tonnes were used as refrigerants. The actual GWP-weighted emissions were 22,200 tonnes CO2 equivalents, which is almost the same as in 2001. 1.2.4 Trends in the total GWP contribution of potent greenhouse gasesFigure 1.4 shows the trend in Danish GWP contributions in 1992-2002 from HFCs, PFCs, and SF6. The relative difference in the calculation of the total GWP value, derived from the present and earlier calculation methods, is illustrated in the figure.
Figure 1.4 Developments in the GWP-weighted potential, actual and adjusted actual emissions 1992-2002, '000 tonnes CO2 equivalents The figure shows that, in 2002, there was again an increase in the total GWP contribution. Developments in the GWP contribution 1992-2002 can also be seen in Table 1.4 below. Table 1.4 Total GWP-contribution from HFCs, PFCs, SF6 '000 tonnes CO2 equivalents, determined using four different methods during this period
|


