|
| Front page | | Contents | | Previous |
Degradation of Estrogens in Sewage Treatment Processes
Appendix 2:
Batch reactor characterisation
In order to know how well the batch experiments simulate the conditions in sewage treatment plants several parameters that characterise the reactors conditions were measured during the experiment. These
parameters were the oxygen concentration, pH, nitrate concentration and BOD1.
Oxygen
In reactors with air as the oxidation source, the O2–concentration was 7.25 ± 1.25 mg/L during the experiments. At the experimental conditions the saturation concentration of O2 in contact with the
atmosphere is about 9 mg/L. In the aeration step of STP the typical concentration of O2 is around 2-3 mg/L (Joss, 2003). Thus, that consumption of oxygen took place apparent, but the oxygen
concentration in the reactors was higher than is common in the aeration tank of a real STP.
Further, since the active sludge density in the reactor is only about a tenth of the normal density in STPs the concentration of oxygen consuming bacteria is less in the batch experiment than in the real STP. If
the air flow was reduced sufficiently to reduce the oxygen saturation to 2-3 mg/L in the reactor the stirring that the air bubbles create was not sufficient to keep the active sludge particles (flocks) in
suspension. It is assumed that this difference does not affect the metabolic potential of the aerobic bacteria as the enzymes in aerobic sludge bacteria are already about 90 % saturated with O2 at an oxygen
concentration of 2 mg/L (Joss, 2003).
In reactors with nitrate as oxidation source O2–concentration was less than 0,1 mg/L throughout the experiment. At this low concentration of oxygen the bacteria would have to use nitrate as their only
oxidation source.
Nitrate
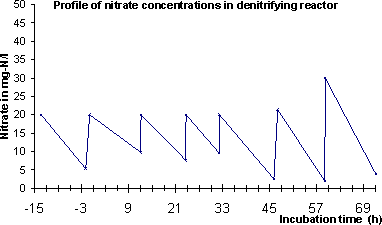
In reactors with nitrate as oxidation source the nitrate is consumed and has to be replenished twice daily. A high consumption of nitrate above 20 mg-N·l-1·d-1 is observed over the entire experimental
period as shown in figure 8. This shows that the bacteria are actively degrading the organic material of the artificial sewage by denitrification. Apparently the nitrate consumption increased in the last day of the
experiment. This could be due to an increase in the bacteria biomass or change of the species composition towards bacteria, which are more efficient metabolizers under denitrifying conditions.

Figure 0-1:
Profile of nitrate concentrations in the batch experiment with denitrifying bacteria.
pH
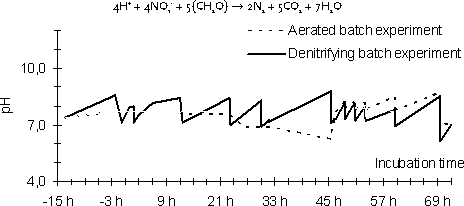
pH was measured at selected times during the experimental period. pH was almost stable in the aerobic reactors, while an increase in pH was observed in the denitrifying reactor over time. See figure 9. To
keep pH between 6,5 and 8,5, mineral acid was added two to four times daily.
In the denitrifying reactor the continuous tendency for increase of pH is explained by consumption of protons during denitrification:

Figure 0-2:
Profile of pH in oxygenated and denitrifying batch experiments. The pH of the denitrifying reactors was repeatedly adjusted to pH = 7 with acid.
Bacterial activity estimated by BOD1
If the bacterial biodegradation activity in the batch experiment reactors changed significantly over the time of the experiment the assumed first order degradation kinetics for the estrogens which is assumed in
the data treatment would not be valid.
To estimate how much the bacterial activity changed during the experiment a sample was taken from the aerated and the denitrifying reactors at the beginning of the experiment and every 24 h of the
experiment. The samples were transferred to WTW BOD bottles, which is normally used to measure oxygen consumption of water samples. The oxygen consumption was measured for 24 h for each
sample. The oxygen consumption profiles could then be compared between samples taken from the reactor on the three days of the experiment as shown in figure 10. It is seen that the biodegradation
activity of the active sludge suspensions did not change much between the three days of the experiment. However, the activity varies between sludge suspensions taken from the aerated and the denitrifying
batch experiments.
Click here to see Figure 0-3.
| Front page | | Contents | | Previous | | Top |
Version 1.0 November 2004, © Danish Environmental Protection Agency
|