Technical Documentation of PestSurf, a Model describing Fate and Transport of Pesticides in Surface Water for Danish Conditions
Appendix A
1 Measured and Fitted Wind Drift Curves
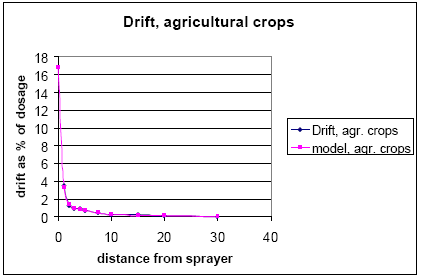
For agricultural crops:
| Distance | deposition, % of appl. Dose | ||
| m | measured | model | |
| 0 | 25.70 | ||
| 1 | 3.51 | 3.51 | |
| 2 | 1.24 | 1.23 | |
| 3 | 0.98 | 1.02 | |
| 4 | 0.94 | 0.90 | |
| 5 | 0.75 | 0.76 | |
| 7.5 | 0.42 | 0.44 | |
| 10 | 0.33 | 0.32 | |
| 15 | 0.2 | 0.19 | |
| 20 | 0.12 | 0.13 | |
| 30 | 0.11 | 0.11 | |

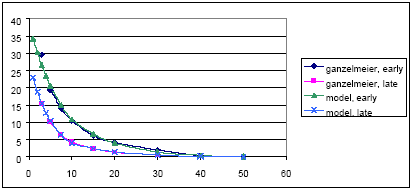
For apples:
| Distance | early stages | late stages | ||
| m | Measured | Model | Measured | Model |
| 1 | 34.3 | 23.0 | ||
| 2 | 30.3 | 18.9 | ||
| 3 | 29.6 | 26.6 | 15.5 | 15.5 |
| 4 | 23.5 | 12.8 | ||
| 5 | 19.5 | 20.7 | 10.1 | 10.5 |
| 7.5 | 14.1 | 15.0 | 6.4 | 6.4 |
| 10 | 10.6 | 11.0 | 4.4 | 4.1 |
| 15 | 6.2 | 6.7 | 2.5 | 2.5 |
| 20 | 4.2 | 4.0 | 1.4 | 1.5 |
| 30 | 2.0 | 1.5 | 0.6 | 0.6 |
| 40 | 0.4 | 0.5 | 0.2 | |
| 50 | 0.2 | 0.2 | 0.1 | |

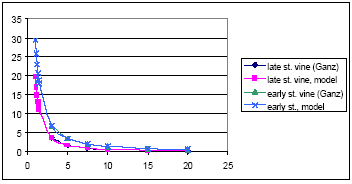
For Spruce:
The final equation is the average of the fitted curves for early and late wine.
| Distance | late vines | early vines | ||
| m | measured | model | measured | model |
| 1.0 | 19.7 | 29.4 | ||
| 1.1 | 17.0 | 25.8 | ||
| 1.2 | 14.8 | 23.0 | ||
| 1.3 | 13.1 | 20.7 | ||
| 1.4 | 11.7 | 18.7 | ||
| 1.5 | 11.1 | 17.9 | ||
| 3.0 | 3.6 | 3.6 | 6.8 | 6.8 |
| 5.0 | 1.6 | 1.6 | 3.4 | 3.4 |
| 7.5 | 0.9 | 0.9 | 2.0 | 2.0 |
| 10.0 | 0.6 | 0.6 | 1.4 | 1.4 |
| 15.0 | 0.3 | 0.3 | 0.8 | 0.8 |
| 20.0 | 0.2 | 0.2 | 0.5 | 0.5 |

Version 1.0 Maj 2004, © Danish Environmental Protection Agency