Technical Documentation of PestSurf, a Model describing Fate and Transport of Pesticides in Surface Water for Danish Conditions
Appendix H
1 Help File
The "Pesticide in Surface Water" model calculates the concentrations of pesticide in two typical streams or lakes of Denmark, based on the application conditions in the two catchments. The user has to specify the pesticide (and metabolite) parameters, while the parameters of the two catchments are permanently set in the models. In order to run the models, the following parameters should be defined:
Basic settings (e.g. whether or not a metabolite is included)
Catchment and type of surface water to be simulated
Width of protection zone along stream
Spraying data (dosage used, dates sprayed)
Pesticide data, and if a metabolite is included
Basic parameters
- With or without statistics
The model can be run only for the average conditions in the catchment. The "with statistics" option cannot presently be selected.
- With or without metabolites
The user may choose to run simulations with or without a specified metabolite. If no metabolite is specified, the menu lines related to metabolites are hidden from the user.
- Names of compound(s)
The user specifies the name of the pesticide (and metabolite, if relevant). The names are written in the parameter file and on the output to make it easier for the user to identify simulation results and parameter files.
- Detection limit
This value is presently not used by the programme.
Catchment and type of surface water
The user specifies whether simulations should be run for the sandy loam catchment (Sandy loam in a moraine clay setting, Lillebæk) or the sandy catchment (Sandy soils on mixed geology, Odder Bæk), and whether results are required for the stream or the pond present in the catchment. For the ponds it is possible to select simulations with and without presence of macrophytes. For ponds without macrophytes sediment is considered anaerobic.
Crop
The user specifies one crop to be included in the simulation. The crop will be present on the total arable area of the catchment. The user is only allowed to select the crops indicated in the menu. For Christmas trees (Spruce), the spraying pattern is determined by the age of the trees. The younger trees are sprayed for weeds - from above, while the older trees are sprayed against insects - from the side.
For each crop, leaf area index, root depth, deposition on soil etc. are specified as fixed time series in the model. The curves used are shown in the documentation to the program.
The transpiration factor is a figure between 0 and 1 specifying to which degree the pesticide is being taken up by the crop. The factor is multiplied onto the concentrations in water taken up by the plants.
Width of protection zone along stream
The protection zone is mainly of interest for drift and dry deposition. For large protection zones, the area sprayed may be slightly diminished, as the grids closest to the stream are left unsprayed.
Spraying data
- Consecutive spraying data
The user has to specify the dose as active substance, g/ha. If the pesticide is used more than once, additional lines can be added by clicking on the upper left button above the dosage box. For each additional application, the dosage is added, together with the number of days between the earlier and the present spraying. Thus, if the crop is sprayed on 1st and 15th of June, with 1 kg and 0.5 kg of active ingredient respectively, the box should be filled out as shown below:
| Dose (g a.i./ha) | Days between consequtive sprayings | |
| 1 | 1000 | |
| 2 | 500 | 14 |
Lines can be deleted with the X-button (stand on the application number, and click on the X-button above the dosage box), and the lines can be shifted around with the two arrow-buttons to the top right.
- Spraying period and displacement interval
The start and the end day of the spraying period have to be specified, together with a displacement interval. Presently, the model only utilises the first day selected for spraying. The other fields are not used. The user should manually run the model for more initial spraying dates if required. Please note that if pesticide is applied more than once, the spraying period should include both sprayings.
The dates can be set with the aid of a calendar, by pressing the large arrow to the right. Arrows on the top of the calendar moves the setting to the next (or previous) day or month. If part of the date is highlighed, the small arrows to the right will change the figures up or down.
If the "allow spraying while rain" box is not ticked off, the time of spraying is moved forward by 8 hours until no rain is encountered.
Pesticide data
Under this heading, all pesticide parameters are specified. These may be general physical or chemical properties of the pesticide, or related to processes in soil or in surface water. It is assumed that anaerobic conditions are present only in ponds without macrophytes. Menues for specification of properties under anaerobic conditions are thus only present when ponds have been selected.
Basic chemical and physical properties
- Cas. No.
Chemical Abstracts Services registry number. The programme is reading the number as a text string.
- Mol weight (g/mol)
Specify the mol weight of the pesticide
- Acid Properties
This refers to the pH dependent charge of pesticides showing basic or acid properties. Thus, for instance, pesticides containing the functional group of an amine might show basic or alkaline properties, whereas pesticides containing a functional carboxyl group show acid properties. Sometimes, it is difficult to evaluate, whether the substance has alkaline/neutral/acid properties. If the water solubility increases and/or the octanol-water partition coefficient decreases with pH, then the active substance has acid properties, if the water solubility decreases and/or the octanol-water partition coefficient increases with pH, then the substance has alkaline properties. Otherwise the substance is not expected to dissociate. An equilibrium between either a positive (alkaline) or a negative (acid) charged species and the neutral species will be present. Click off the right group.
- Henry's constant
Henry's constant may be either measured or estimated. If measured and if the substance is an acid or a base it should be ensured that the measured Henry's constant is for the neutral substance. The Henry's constant for a dissociating substance can be expressed by: H (neutral, dissociated) = α • H (neutral). If the Henry's constant is estimated, the field named "water solubility" has to be filled out. The field "vapor pressure" always has to be filled out, as this figure is used for the calculation of dry deposition. It should be noted that equation used for calculating the Henry's constant in general only holds for slightly water soluble substances.
- pKa
For acid and basic compounds, the pKa-value must be added to allow calculation of the amount of charged and neutral compound present for the pH-range of relevance for the soil. The Ka-value (pKa = -log10(Ka)) is for an acid defined by the equation:
Whereas Ka for a base is defined by the equation:
- Log KOW:
The 10 logarithm to the distribution coefficient between octan-1-ol and water with the unit of KOW is (l/kg). If the substance is either acidic or alkaline, the log KOW of both the neutral and the charged part should be specified. In general, the log KOW of the neutral part is much higher than the log KOW of the dissociated part. At pH, where the degree of dissociation is low: KOW (neutral, dissociated) ~(1-α )·KOW (neutral). At pH, where the degree of dissociation is close to 1: KOW (neutral, dissociated) ~ a ·KOW (dissociated) + (1-α )· KOW (neutral).
If the dataset on corresponding values of log KOW and pH is not sufficient, the following empirical equation may be used:
log KOW (dissociated) » log KOW (neutral) - 3.5
- Water solubility (mg/l) at 20 degree Celcius.
The water solubility should only be provided for the neutral compound, since charged compound is considered as easily dissolved in water at the applied concentration of pesticide. The water solubility is pH-dependent for acidic and alkaline substances. At concentrations below concentrations, at which the dissociated part of the base or acid precipitate as salts, the measured solubility can be approximated by: SW = SWneutral/(1-α), where a is the dissociated fraction. The solubility of the neutral part (SWneutral) can be estimated from the above equation.
- Vapor pressure in the unit of Pa (Pascal).
The vapor pressure should only be provided for the neutral compound, since the evaporation of the charged compound is considered as negligible. The vapor pressure should be specified at 20°C. If the vapor pressure is specified at another temperature, then an appropriate way of extrapolating to 20°C is to assume that the temperature dependency of the vapor pressure can be expressed by the Antoine-like expression: Ln Psat = A - B/(t + 273), where A and B can be calculated from the measured vapor pressure and the boiling point (Psat = 101325 Pa at the boiling point).
Pesticide in soil
The parameters to be specified under this heading relates to sorption and degradation of pesticides in a soil environment. To the largest extent possible, the formulation corresponds to what is used in the models recommended by the FOCUS-group on leaching to groundwater (FOCUS groundwater scenarios in the EU pesticide registration process), and the methods of parameter estimation given in their guidelines are recommended for use also for this model.
Sorption of pesticide in soil
- Choice of isotherm
The user must select whether to use a linear or a Freundlich sorption isotherm. It is recommended to use a linear isotherm - only if it is well documented that the Freundlich isotherm is well established for the lower concentration range of interest for leaching, should it be used. The default value for the exponent of a Freundlich isotherm is 0.9. The Freundlich isotherm is defined as x = Kfcref(c/cref)1/n, where x is the content of pesticide sorbed (mg/kg), and c is the concentration in the liquid phase (mg/l). cref is the reference concentration, which is usually 1 mg/l. K has to be specified in dm3/kg (or l/kg).
- The sorption coefficient
The unit of the sorption coefficient must be dm3/kg or l/kg. The sorption coefficient can be defined as a function of organic matter (KOM), as a function of organic carbon (KOC), as a function of clay (Kclay) or as a Kd-value of the soil. As % OC = % OM/1.724, KOC = KOM * 1.724. If KOC, KOM or Kclay is given, the sorption of each horizon in each soil profile is calculated as a function of the organic matter content or clay content of the respective horizon. The resulting values are shown in the spreadsheet of the menu. The equivalent Kd-value is the Kx * the fraction of the 'x' constitutent of the soil, i.e. Kd = KOC * % oc/100. If nothing else is known, sorption can be estimated from KOW in the following manner: log10(KOC) = 1.029*log10(KOW) – 0.18.
- Assistance to parameter choice
The following guidelines are specified in the report: FOCUS groundwater scenarios in the EU pesticide registration process:
"Soil sorption results (Kfoc, KOC or Kfom, KOM) are also required in four soils for parent compound and in three soils for relevant metabolites according to the environmental fate annexes to Directive 91/414/EEC (95/36/EC). Where these are all agricultural soils, the FOCUS group recommend that it is generally acceptable to use the mean value of the sorption constant normalised for organic carbon (Kfoc, KOC, KOM or Kfom) to derive the input to the model, unless the sorption is known to be pH-dependent. In situations where there are results from less than the recommended number of agricultural soils then it is generally appropriate to use the worst case result (lowest sorption). In cases where a large number of additional data points are available, a median value may be more appropriate. When characterising sorption behaviour of ionic compounds, the value will vary depending on the pH and a mean or median value is no longer appropriate. In this situation it is recommended that the choice of input parameter is made in relation to the pH of the soils in the scenario in the first instance.
In addition there will be certain compounds for which sorption and degradation are pH dependent and the values are linked (e.g. lower sorption at high pH but faster degradation). Under these conditions it is appropriate to use linked values of KOC and half life rather than average values of either. Inputs should be selected with the aim of obtaining a realistic rather than an extreme situation and the values used should be justified in the report.
For all model inputs derived from the regulatory data package, only studies of acceptable quality should be considered."
Degradation of pesticide in soil
- Half life
The degradation is specified as half life of the pesticide in days. The value has to be given according to a specific moisture content, which may be either pF 1 or 2, and with a reference temperature for the measurements. The default reference temperature is 20 oC, but the value can be changed by the user. Q10 is the relative increase in degradation rate with a 10 degree C increase in temperature. The default value is 2.2, equal to an exponent of 0.079, but other values of Q10 can be included.
In the model, the reference degradation rate is calculated as μ ref = ln2/(half life). The degradation rate is then modified according to temperature (Ft) and moisture content (Fw)according to the following formulas:
μ = μ ref* Fw*Ft, where
Ft = e α (T-Tref), &alpha: = ln(Q10)/10
Fw = (θ /θ b)0.7
- Distribution of degradation with depth
The degradation rates are modified with depth. The default values, according to the FOCUS report are 1 (0-30 cm depth), 0.5 (30-60 cm depth), 0.3 (60-100 cm depth) and 0 below 1 m's depth.
- Assistance to parameter choice
The environmental fate annexes to Directive 91/414/EEC (95/36/EC) recommend that degradation rate studies are undertaken in four soils for the parent compound and three soils for relevant metabolites (laboratory studies initially and then, if necessary, field studies). Therefore the FOCUS group recommend that where the parent compound has been studied in a minimum of four soils it is generally acceptable to use the mean degradation rate as input into the model. Similarly, the FOCUS group recommend that where the relevant metabolite has been studied in a minimum of three soils it is generally acceptable to use the mean degradation rate as input into the model.
In cases where a large number of additional data points are available, a median value may be more appropriate. In some cases the range of the results may be too large for this to be acceptable. This should be judged on a case by case basis and in this situation a value from a single study should be used, with appropriate justification of the study chosen.
In situations where less than the recommended number of soils have been studied it is generally appropriate to use the worst case result which is generated in a soil of agricultural use.
The FOCUS report recommends to calculate the degradation rate for each of the soils in the dossier at pF2, and to compare (and average) the values at this moisture content. The value found is then fed into the soils to be modelled, and modified according to moisture content and temperature within the model. This is the reason why degradation rates are not specified for each soil type in the catchments.
In order to be able to normalise the values provided in the study, the guide values in following table is recommended by the FOCUS groundwater report.
The Maximum Water Holding Capacity is expected to equal pF1 (the last column of the table). Moisture contents in % of MWHC can then be recalculated to a soil moisture content. If, for example, the degradation rate is determined for a sandy clay loam at 60 % of MWHC, the corresponding water content is 28 * 60/100 = 16.8. We would like to to know the half life at pF 2, that is a moisture content of 22 %. The correction factor is therefore (16.8/22)0.7 =0.83. The corrected halflife is then 0.83 * the half-life determined at 60 % MWHC.
Default values for moisture contents for soils at field capacity, maximum water holding capacity and 1/3 Bar (based on HYPRES [Wösten et al., 1998]; PETE)* (Source: Focus)
| USDA classification | Proposed UK/BBA equivalent classification | Volumetric water content at field capacity (θ v10) (%) | Gravimetric water content at field capacity (W10) (%) | Gravimetric water content at 1/3 Bar and pF 2.5 (W33)
(%) |
Gravimetric water content at MWHC (1kPa)
(%) |
| Sand | Sand | 17 | 12 | 7 | 24 |
| Loamy sand | Loamy sand | 20 | 14 | 9 | 24 |
| Sandy loam | Sandy loam | 27 | 19 | 15 | 27 |
| Sandy clay loam | Sandy clay loam | 31 | 22 | 18 | 28 |
| Clay loam | Clay loam | 38 | 28 | 25 | 32 |
| Loam | Sandy silt loam | 34 | 25 | 21 | 31 |
| Silt loam | 36 | 26 | 21 | 32 | |
| Silty clay loam | Silty clay loam | 40 | 30 | 27 | 34 |
| Silt | Silt loam | 37 | 27 | 21 | 31 |
| Sandy clay | Sandy clay | 40 | 35 | 31 | 41 |
| Silty clay | Silty clay | 46 | 40 | 36 | 44 |
| Clay | Clay | 50 | 48 | 43 | 53 |
* The PETE database gives average topsoil organic carbon content and undisturbed soil bulk density based on over 3000 UK soil profiles. The average of these bulk density values and those predicted by HYPRES (using mid-range sand, silt and clay percentage for the given soil classes) was used for the calculations. The pedotransfer functions from HYPRES were used to determine the soil water content at the given matric potentials based on bulk density, organic carbon content and particle size characteristics. It has been assumed that these data from undisturbed soil profiles provide an acceptable approximation to disturbed profile data which are generally stated in regulatory reports (water contents in disturbed soil profiles are likely to be higher and hence the generic data provided above would lead to more conservative [longer] standardisations of the DT50)
Pesticide in surface water
The parameters to be specified under this heading relates to sorption and degradation of pesticides in a lake or a stream environment.
Sorption of pesticide in surface water
Sorption relates to suspended material in the water or sediment at the bottom of the water body. The parameters to be specified for sorption can either be similar to what is given for the soil, or alternatively, KOC is calculated on the basis of KOW.
Degradation of pesticide in surface water
Degradation in surface water can be biological, or through hydrolysis or photolysis. For the ponds it is necessary to specify both an anaerobic and an aerobic biological degradation rate, while the conditions in the stream are defined to be aerobic at all times.
Aerobic pesticide degradation in surface water
Preferentially a total degradation rate for an experiment conducted as a shaking bottle experiment with suspended sediment (ISO 14952 Part 1) and the particle (suspended sediment) concentration at which the experiment was conducted should be entered. If the user prefer to use a degradation value obtained from a test without addition of suspended matter the particle concentration should be set to 0.
The reference temperature for the input has to be 20°C.
If only data on ready-biodegradability and/or inherently biodegradability data exist then it is suggested to used the recommended data from TGD (TGD: Technical Guidance Document. European Commission (1996): Technical guidance documents in support of the Commission Directive 93/67/EEC on risk assessment for new substances and the Commission Regulation EC 1488/94 on risk assessment for existing substances. Brussels, Belgium):
If the substance is ready biodegradable, use a half-life of 15 days, if the substance i ready biodegradable, but failing 10-d window, use a halflife of 50 days, if the substance is inherently biodegradable use a half-life of 150 days. Otherwise assume that the substance is persistent. The concentration of suspended matter should be set equal to 15 mg/L.
Anaerobic pesticide degradation in surface water
These values are only relevant for phytoplankton dominated ponds.The values for anarobic degradation are entered in the same way as the aerobic degradation.
Hydrolysis of pesticides in surface water
The model requires specification of acid, basic and neutral rates of hydrolysis at 20°C. The data request of the Danish EPA (Miljø- og Energiministeriet 1998) request that hydrolyis rates are determined in the interval of pH 4 to 9 and it should thus be possible to provide these rates through a solution of the matrix system shown below with repect to kacid, kbasic, kneutral, and one or two of the equations have to be omitted. Sometimes, it is not possible to use this strategy. For example, if it is specified that the no hydrolysis occurs at alkaline conditions, then kbasic should be set equal to zero, and if no hydrolysis occurs at acidic conditions, then kacid should be set equal to zero. If the rate of hydrolysis is almost independent of pH then kbasic and kacid should be set equal to zero, and the kneutral should be set equal to the measured rate of hydrolysis.
Photolysis of pesticides in surface water
Three types of parameters have to be specified:
- Quantum Yield
The quantum yield is the amount of compound degraded per quantum of light energy absorbed. The value of the quantum yield is thus between 0 and 1.
-Number of channels
Allows the user to specify the number of channels of the light absorption spectra.
- Standard Absorption Spectrum
The photolysis rate depends on the light absorption spectrum of the pesticide in the region of relevance to solar irridiation from 290 nm to 850 nm. It has been stated that the molar decadic absorption coefficient (L/mol/cm) has to above 10 at a wavelength above 295 nm if the direct photolysis is of relevance. The information on the standard absorption spectrum is supposed to be part of the dossier for the pesticide. At each wavelength, the molar extinction coefficient has to be specified with the unit cm-1mol-1.
Very often quantum yield is not reported. Instead a measured photolytic half-life of a substance is obtained from experiments with a xenon lamp or other lamps with a specified light intensity (W/m2) (or outdoor experiments at a specified latitude and time of year). The characteristics of the lamp (energy distribution across the wavelength spectrum of the irradiation lamp) should be reported. If the experiments were carried out outdoors, the data on the energy distribution across the wavelength spectrum may be obtained from e.g. Zepp (Environ.Sci.Techn. 12, p. 327, 1978) and Frank (Chemosphere 10, p 985, 1988).
The amount of light intensity absorbed by the substance is calculated from (I0 is incident light intensity, L is the optical path length (cm), A is absorbance of the solution = ε • Cx, Cx is the concentration of the substance (mol/L), e is the molar decadic absorption coefficient (L/mol/cm), δλ is appropriate wavelength intervals):
Iabs (photons/L/s) = 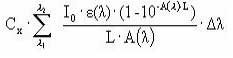
If A(λ )• L is below 0.02 then (1-10-A(λ )• L) » 2.3• A(λ)• L simplifying the above equation into:
Iabs (photons/L/s) = 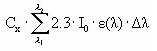
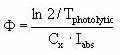
The quantum yield (Φ ), which is assumed to be independent of wave-length (which is an approximation) is then calculated from the measured photolytic half-life by:
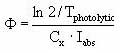
It should be ensured that the light intensity (I0) used in the above equations is the intensitity of the light actually reaching the solution, so the effects from the glass wall of the cuvette containing the test solution is excluded.
Metabolite data
This heading is only activated, if it is specified that metabolites are included in the simulation. Under this heading, all metabolite parameters are specified. These may be general physical or chemical properties of the metabolite, or related to processes in soil or in surface water. It is assumed that anaerobic conditions are present in the sediment of the phytoplankton dominated ponds and not in streams. Menues for specification of properties under anaerobic conditions are thus only present when ponds have been selected.
Basic chemical and physical properties
- Cas. No.
Chemical Abstracts Services registry number. The programme is reading the number as a text string.
- Mol weight (g/mol)
Specify the mol weight of the metabolite.
- Acid Properties
This refers to the pH dependent charge of metabolites showing basic or acid properties. Thus, for instance, metabolites containing the functional group of an amine might show basic or alkaline properties, whereas metabolites containing a functional carboxyl group show acid properties. Sometimes, it is difficult to evaluate, whether the substance has alkaline/neutral/acid properties. If the water solubility increases and/or the octanol-water partition coefficient decreases with pH, then the active substance has acid properties, if the water solubility decreases and/or the octanol-water partition coefficient increases with pH, then the substance has alkaline properties. Otherwise the substance is not expected to dissociate. An equilibrium between either a positive (alkaline) or a negative (acid) charged species and the neutral species will be present. Click off the right group.
- Henry's constant
If measured and if the substance is an acid or a base it should be ensured that the measured Henry's constant is for the neutral substance. The Henry's constant for a dissociating substance can be expressed by: H (neutral, dissociated) = α • H (neutral). If the Henry's constant is estimated, the field named "water solubility" has to be filled out. The field "vapor pressure" always has to be filled out, as this figure is used for the calculation of dry deposition. It should be noted that equation used for calculating the Henry's constant in general only holds for slightly water soluble substances.
- pKa
For acid and basic compounds, the pKa-value must be added to allow calculation of the amount of charged and neutral compound present for the pH-range of relevance for the soil.
- Log KOW:
The 10 logarithm to the distribution coefficient between octan-1-ol and water with the unit of KOW is (l/kg). If the substance is either acidic or alkaline, the log KOW of both the neutral and the charged part should be specified. In general, the log KOW of the neutral part is much higher than the log KOW of the dissociated part. At pH, where the degree of dissociation is low: KOW (neutral, dissociated) ~(1-α )·KOW (neutral). At pH, where the degree of dissociation is close to 1: KOW (neutral, dissociated) ~ a ·KOW (dissociated) + (1-α )· KOW (neutral).
If the dataset on corresponding values of log KOW and pH is not sufficient, the following empirical equation may be used:
log KOW (dissociated) » log KOW (neutral) - 3.5
- Water solubility (mg/l) at 20 degree Celcius.
The water solubility should only be provided for the neutral compound, since charged compound is considered as easily dissolved in water at the applied concentration of metabolite. The water solubility is pH-dependent for acidic and alkaline substances. At concentrations below concentrations, at which the dissociated part of the base or acid precipitate as salts, the measured solubility can be approximated by: SW = SWneutral/(1-α), where a is the dissociated fraction. The solubility of the neutral part (SWneutral) can be estimated from the above equation.
- Vapor pressure in the unit of Pa (Pascal).
The vapor pressure should only be provided for the neutral compound, since the evaporation of the charged compound is considered as negligible. The vapor pressure should be specified at 20°C. If the vapor pressure is specified at another temperature, then an appropriate way of extrapolating to 20°C is to assume that the temperature dependency of the vapor pressure can be expressed by the Antoine-like expression: Ln Psat = A - B/(t + 273), where A and B can be calculated from the measured vapor pressure and the boiling point (Psat = 101325 Pa at the boiling point).
Pesticide transformation to metabolite
- Transformation factor, P->M
The menu allows specification of how big a fraction of the degraded pesticide that is transformed to this metabolite for the different degradation process. If 80 out of 100 molecules are transformed to the metabolite in question, the fraction is 0.8.
- Relative molecular weight M/P
The relative molecular weight is calculated on the basis of the molecular weights specified for the pesticide and the metabolite.
- The conversion factor
The conversion factor is the product of the transformation factor and the relative molecular weight, and is used to calculate the mass of metabolite produced through degradation.
Metabolite in soil
The parameters to be specified under this heading relates to sorption and degradation of metabolites in a soil environment. To the largest extent possible, the formulation corresponds to what is used in the models recommended by the FOCUS-group on leaching to groundwater (FOCUS groundwater scenarios in the EU metabolite registration process), and the methods of parameter estimation given in their guidelines are recommended for use also for this model.
Sorption of metabolite in soil
- Choice of isotherm
The user must select whether to use a linear or a Freundlich sorption isotherm. It is recommended to use a linear isotherm - only if it is well documented that the Freundlich isotherm is well established for the lower concentration range of interest for leaching, should it be used. The default value for the exponent of a Freundlich isotherm is 0.9. The Freundlich isotherm is defined as x = Kfcref(c/cref)1/n, where x is the content of metabolite sorbed (mg/kg), and c is the concentration in the liquid phase (mg/l). cref is the reference concentration, which is usually 1 mg/l. K is usually given in dm3/kg (or l/kg).
- The sorption coefficient
The unit of the sorption coefficient must be dm3/kg (or l/kg). The sorption coefficient can be defined as a function of organic matter (KOM), as a function of organic carbon (KOC), as a function of clay (Kclay) or as a Kd-value of the soil. As % OC = % OM/1.724, KOC = KOM * 1.724. If KOC, KOM or Kclay is given, the sorption of each horizon in each soil profile is calculated as a function of the organic matter content or clay content of the respective horizon. The resulting values are shown in the spreadsheet of the menu. The equivalent Kd-value is the Kx * the fraction of the 'x' constitutent of the soil. If nothing else is known, sorption can be estimated from KOW in the following manner: log10(KOC) = 1.029*log10(KOW) – 0.18.
- Assistance to parameter choice
The following guidelines are specified in the report: FOCUS groundwater scenarios in the EU metabolite registration process:
"Soil sorption results (Kfoc, KOC or Kfom, KOM) are also required in four soils for parent compound and in three soils for relevant metabolites according to the environmental fate annexes to Directive 91/414/EEC (95/36/EC). Where these are all agricultural soils, the FOCUS group recommend that it is generally acceptable to use the mean value of the sorption constant normalised for organic carbon (Kfoc, KOC, KOM or Kfom) to derive the input to the model, unless the sorption is known to be pH-dependent. In situations where there are results from less than the recommended number of agricultural soils then it is generally appropriate to use the worst case result (lowest sorption). In cases where a large number of additional data points are available, a median value may be more appropriate. When characterising sorption behaviour of ionic compounds, the value will vary depending on the pH and a mean or median value is no longer appropriate. In this situation it is recommended that the choice of input parameter is made in relation to the pH of the soils in the scenario in the first instance.
In addition there will be certain compounds for which sorption and degradation are pH dependent and the values are linked (e.g. lower sorption at high pH but faster degradation). Under these conditions it is appropriate to use linked values of KOC and half life rather than average values of either. Inputs should be selected with the aim of obtaining a realistic rather than an extreme situation and the values used should be justified in the report.
For all model inputs derived from the regulatory data package, only studies of acceptable quality should be considered."
Degradation of metabolite in soil
- Half life
The degradation is specified as half life of the metabolite in days. The value has to be given according to a specific moisture content, which may be either pF 1 or 2, and with a reference temperature for the measurements. The default reference temperature is 20 oC, but the value can be changed by the user. Q10 is the relative increase in degradation rate with a 10 degree C increase in temperature. The default value is 2.2, equal to an exponent of 0.079, but other values of Q10 can be included.
In the model, the reference degradation rate is calculated as μ ref = ln2/(half life). The degradation rate is then modified according to temperature (Ft) and moisture content (Fw)according to the following formulas:
μ = μ ref* Fw*Ft, where
Ft = e α (T-Tref), α = ln(Q10)/10
Fw = (θ /θ b)0.7
- Distribution of degradation with depth
The degradation rates are modified with depth. The default values, according to the FOCUS report are 1 (0-30 cm depth), 0.5 (30-60 cm depth), 0.3 (60-100 cm depth) and 0 below 1 m's depth.
- Assistance to parameter choice
The environmental fate annexes to Directive 91/414/EEC (95/36/EC) recommend that degradation rate studies are undertaken in four soils for the parent compound and three soils for relevant metabolites (laboratory studies initially and then, if necessary, field studies). Therefore the FOCUS group recommend that where the parent compound has been studied in a minimum of four soils it is generally acceptable to use the mean degradation rate as input into the model. Similarly, the FOCUS group recommend that where the relevant metabolite has been studied in a minimum of three soils it is generally acceptable to use the mean degradation rate as input into the model.
In cases where a large number of additional data points are available, a median value may be more appropriate. In some cases the range of the results may be too large for this to be acceptable. This should be judged on a case by case basis and in this situation a value from a single study should be used, with appropriate justification of the study chosen.
In situations where less than the recommended number of soils have been studied it is generally appropriate to use the worst case result which is generated in a soil of agricultural use.
The FOCUS report recommends to calculate the degradation rate for each of the soils in the dossier at pF2, and to compare (and average) the values at this moisture content. The value found is then fed into the soils to be modelled, and modified according to moisture content and temperature within the model. This is the reason why degradation rates are not specified for each soil type in the catchments.
Metabolite in surface water
The parameters to be specified under this heading relates to sorption and degradation of metabolites in a lake or a stream environment.
Sorption of metabolite in surface water
Sorption relates to suspended material in the water or sediment at the bottom of the water body. The parameters to be specified for sorption can either be similar to what is given for the soil, or alternatively, KOC is calculated on the basis of KOW.
Degradation of metabolite in surface water
Degradation in surface water can be biological, or through hydrolysis or photolysis. For the phytoplankton dominated ponds it is necessary to specify both an anaerobic and an aerobic biological degradation rate since the sediment of the phytoplnakton dominated ponds is considered anarobic. The conditions in the stream are defined to be aerobic at all times. The reference temperature for the input has to be 20°C.
If only data on ready-biodegradability and/or inherently biodegradability data exist then it is suggested to used the recommended data from TGD (TGD: Technical Guidance Document. European Commission (1996): Technical guidance documents in support of the Commission Directive 93/67/EEC on risk assessment for new substances and the Commission Regulation EC 1488/94 on risk assessment for existing substances. Brussels, Belgium):
If the substance is ready biodegradable use a half-life of 15 days, if the substance i ready biodegradable, but failing 10-d window use a halflife of 50 days, if the substance is inherently biodegradable use a half-life of 150 days otherwise assume that the substance is persistent. The concentration of suspended matter should be set equal to 15 mg/L.
Aerobic metabolite degradation in surface water
Preferentially a total degradation rate for an experiment conducted as a shaking bottle experiment with suspended sediment (ISO 14952 Part 1) and the particle (suspended sediment) concentration at which the experiment was conducted should be entered. If the user prefer to use a degradation value obtained from a test without addition of suspended matter the particle concentration should be set to 0.
The reference temperature for the input has to be 20 oC.
Anaerobic metabolite degradation in surface water
These values are only relevant for phytoplankton dominated ponds. The values for anaerobic degradation are entered in the same way as the aerobic degradation.
Hydrolysis of metabolites in surface water
The model requires specification of acid, basic and neutral rates of hydrolysis at 20°C. The data request of the Danish EPA (Miljø- og Energiministeriet 1998) request that hydrolyis rates are determined in the interval of pH 4 to 9 and it should thus be possible to provide these rates through a solution of the above matrix system with repect to kacid, kbasic, kneutral. . Sometimes, it is not possible to use this strategy. For example, if it is specified that the no hydrolysis occurs at alkaline conditions, then kbasic should be set equal to zero, and if no hydrolysis occurs at acidic conditions, then kacid should be set equal to zero. If the rate of hydrolysis is almost independent of pH then kbasic and kacid should be set equal to zero, and the kneutral should be set equal to the measured rate of hydrolysis.
Photolysis of metabolites in surface water
Three types of parameters have to be specified:
- Quantum Yield
The quantum yield is the amount of compound degraded per quantum of light energy absorbed.
-Number of channels
Allows the user to specify the number of channels of the light absorption spectra.
- Standard Absorption Spectrum
The photolysis rate depends on the light absorption spectrum of the metabolite in the region of relevance to solar irridiation from 290 nm to 850 nm. It has been stated that the molar decadic absorption coefficient (L/mol/cm) has to above 10 at a wavelength above 295 nm if the direct photolysis is of relevance. The information on the standard absorption spectrum. This information is supposed to be part of the dossier for the pesticide. At each wavelength, the molar extinction coefficient has to be specified with the unit cm-1mol-1.
Very often quantum yield is not reported. Instead a measured photolytic half-life of a substance is obtained from experiments with a xenon lamp or other lamps with a specified light intensity (W/m2) (or outdoor experiments at a specified latitude and time of year). The characteristics of the lamp (energy distribution across the wavelength spectrum of the irradiation lamp) should be reported. If the experiments were carried out outdoors, the data on the energy distribution across the wavelength spectrum may be obtained from e.g. Zepp (Environ.Sci.Techn. 12, p. 327, 1978) and Frank (Chemosphere 10, p 985, 1988).
The amount of light intensity absorbed by the substance is calculated from (I0 is incident light intensity, L is the optical path length (cm), A is absorbance of the solution = ε • Cx, Cx is the concentration of the substance (mol/L), e is the molar decadic absorption coefficient (L/mol/cm), δ λ is appropriate wavelength intervals):
Iabs (photons/L/s) = 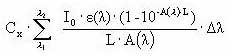
If A(λ )• L is below 0.02 then (1-10-A(λ )• L) » 2.3• A(λ )α L simplifying the above equation into:
Iabs (photons/L/s) = 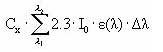
The quantum yield (Φ ), which is assumed to be independent of wave-length (which is an approximation) is then calculated from the measured photolytic half-life by:
It should be ensured that the light intensity (I0) used in the above equations is the intensity of the light actually reaching the solution, so the effects from the glass wall of the cuvette containing the test solution is excluded.
Version 1.0 Maj 2004, © Danish Environmental Protection Agency