|
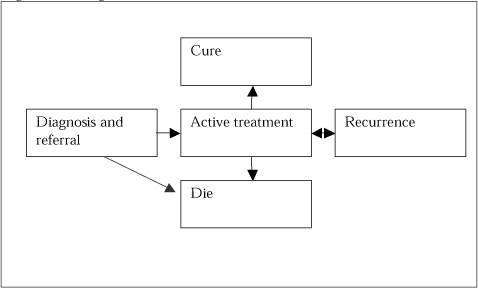
Valuation of Chemical related Health Impacts 8 Lung cancerLung cancer is defined as a malignancy within the lungs and may be localized or has spread to multiple sites (Bennet and Plum (1996)). 8.1 DefinitionThe lung cancers analysed in this section are classified as C33-C34 in the ICD-10 classification of diseases. Following this classification, the definition of lung cancer also includes tracheal cancer, a rare type of cancer. 8.2 Chemicals associated with Lung CancerThe far predominant cause of lung cancer is smoking. However, a number of chemicals are known or suspected to cause lung cancer as well (COI Handbook (2002)). EPA has developed a list of chemicals known or suspected to cause lung cancer. Most chemicals were carcinogenic in animal studies. These studies do not provide organ-specific data because it is not generally assumed that cancer induction will necessary occur at the site in humans as in animals (COI Handbook (2002))14. Hence, it is difficult to determine specific chemicals with specific types of cancer. However in Denmark, Arbejdsmiljøfonden has assessed the cancer evidence in related to chemicals (Hansen et al. (1998)). The overall conclusions in relation to lung cancer were that, there was a significant increased risk of lung cancer for epichlorhydrin and chlorinated paraffins. 8.3 Disease courseThe disease course of lung cancer is illustrated in Figure 8-1. Treatment of lung cancer can be divided into the following states: Referral and Diagnosis, Active treatment, Cure, Recurrence and Death.15 Figure 8-1 Lung cancer disease course
Referral and Diagnosis: Referral from general practitioner and activities related to diagnosis of the patient The treatment depends on the type of lung cancer, the patient's ability to receive the different kind of therapy, and on the stage of the disease. In order to estimate the lifetime costs it is necessary to provide data regarding the probabilities of moving from one stage to another. Here, this is done by utilising a Markov model. See section 4.2.1 for a further description. The Markov model for lung cancer is divided in three states:
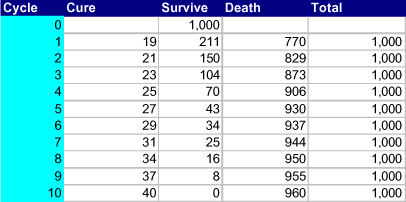
The utilised Markov model is a so called time dependent model where the transition probabilities vary over time. The state Survive is the state where a person has been diagnosed as having lung cancer but is neither dead nor cured. This state includes cost of diagnosis, referral, active treatment and recurrence. In the state Death, the person is dead from lung cancer. This state includes treatment costs the year in which the person dies. In the state Cure the person is cured from lung cancer. The states Death and Cure are absorbing states (i.e. when a person has entered the state, it is not possible to leave). Transition probabilities are derived from relative survival data for Danish people with lung cancer (Storm and Engholm (2002)). The relative survival data can be interpreted as the excess mortality from lung cancer. The available data cover relative survival for 1, 5 and 10 years following the diagnosis. The relative survival for these years is 23, 7 and 4 % respectively. As relative survival data beyond the 10th years were not available, and the impact of extending the model beyond this point is marginal, the simulation was done for 10 years. The 4 % being alive after 10 years are assumed to be cured. The probability of moving from Survive to Death is taken directly from the relative survival data. The probability of moving from Survive to Cure is modelled from the 4% being alive after 10 years. The resulting Markov simulation of the cohort is shown in Table 8-1. After 10 years 4% are Cured (40/1000=0.04) and 96% are in the state Death (960/1000 = 0.96). Table 8-1 Time dependent markov cohort simulation of lung cancer survival
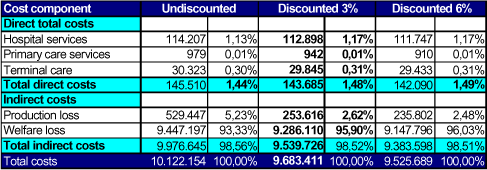
Cycle A cycle has the length of one year The expected costs are obtained by assigning costs to each person in each state, and then summing over all persons over the 10 year simulation period and dividing by the total cohort number. It is assumed that the persons cured and dying are entering these states uniformly over the year, meaning that they enter the states after 6 months in average. To the extent possible this is taken into account in the estimation of the costs. 8.4 Direct health care costsDirect lifetime costs are estimated from a large scale register study by (Gundgaard et al. (2002)). The advantage of register data is that they reflect actual use of resources. Therefore, the lifetime costs of lung cancer will be estimated from these data complemented with cost estimates for other services not included in this study. Cost of hospital and primary careThe costs estimates from Gundgaard et al. (2002) cover hospital and primary care services. The study is based on a 20% sample of the Danish population. Data on use of health care resources were retrieved from the Prevention Register at Statistics Denmark, the Cancer Register and combined through the unique personal identification number. The costs are estimated by following patients with the diagnosis ICD-10 C33-C34 during the years 1996 and 1997. These cost data reflect average costs of a person with lung cancer. Hence, also costs not related to the lung cancer per see are also included. Incremental costs due to lung cancer were estimated by subtracting average costs per person not having lung cancer from these values. The cost data include the following health care resources: In-patient hospital services, and out-patient hospital services (ambulatory visits, emergency room visits). Costs were estimated using the 1997 version of the Danish DRG-system. Costs of primary health care services coved through the health care reimbursement scheme were also included. Costs for 10 years following the diagnosis were estimated from cross sectional data. Combining these costs estimates with Danish relative survival rates in the Markov model expected costs for a person with lung cancer were estimated. Total expected costs hospital and primary care services are DKK 113,840 3% discount rate. There is not much difference whether 3 or 6% discount rates are used as most of the costs falls within the first years. Table 8-2 Total direct costs over 10 years (DKK 2002 values)
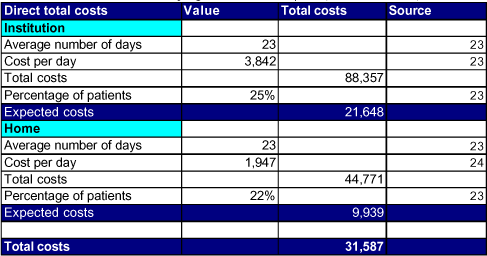
Results based on Markov simulation. The costs estimate for hospital services is higher than the estimate recently used by the Environmental Assessment Institute (DKK 66,000 in 2002 value) (Petersen et al. (2003)). The source for this estimate is Rasmussen et al. (2000). In their study only costs which can be directly attributed to smoking are included. The cost estimate in this report is based on Gundgaard et al. (2002) which include all costs for patients with the main diagnoses C43 and C44 irrespective whether the reason is smoking or another. Therefore, the scope of the analysis by Gundgaard et al. (2002) is broader and hence, yields a higher cost estimate per person. In addition to this, the study by Gundgaard et al. (2002) uses a later version of the DRG-system as well as the registration of ambulatory services has improved since the study by Rasmussen et al. (2000). Cost of terminal careCosts of terminal care outside the hospitals were not included in the study by Gundgaard et al. (2002). Costs of terminal care were estimated using data from the report concerning palliative efforts in counties and municipalities in Denmark (Amtsrådsforeningen et al. (2000)). According to this report, 49.7% of the patients die at the hospital. Costs of these patients are included in the costs estimates by Gundgaard et al. (2002). However, 24.5% die at nursing homes or other institutions, 22.2% at home and 3.6% at other places are not included. It is possible to estimate costs for those who die at home or at nursing homes. The 3.6% dying elsewhere are omitted in the calculations. Table 8-3 Direct total costs of dying outside the hospital (DKK 2002 values)
Institution includes nursing homes, hospices and other institutions The total costs of Terminal care are DKK 31,587 for a person dying outside the hospitals. When multiplying this cost estimate with the probability of dying, we can calculate the expected discounted costs of dying at institutions and at home. The total expected direct costs of lung cancer are DKK 143,685 using 3 % discount rate (Table 8-4). Costs of terminal care in Table 8-4 do not correspond exactly to costs of terminal care in Table 8-3. The reason for this is that, the estimations in Table 8-4 are based on the Markov simulation where 4% of the patients survive. Therefore, the cost estimate in Table 8-4 is slightly lower. Table 8-4 Total direct costs of lung cancer (DKK 2002 values)
Results based on Markov simulation. 8.5 Individual welfare LossIn the estimation of the welfare loss we distinguish between people that are cured and people that eventually die from lung cancer. Of main importance is the welfare loss of lung cancer death. This is estimated by the value of a statistic life of DKK 9.64 million., presented in section 4.3.8. In the case of people that are cured from the cancer, there is very limited empircal evidence on WTP estimates for non-fatal cancers. It is obviously lower than the WTP for the fatal cases, but probable also not insignificant, as the patient will not know the deasise cource in advance. In an EU study on air pollution, a value of 50% of the WTP for fatal cancers have been used16. They emphisize the high level of uncertainty attached to this value. The choice of a value for the WTP for the non-fatal lung cancers is quite limited an the total result. A value of 50 % of the WTP for a statisitical life amounts to less than 2% of the total direct and indirect costs. Although, there is limited evidence regarding this aspect, it is still an element that should be included. Thus, the value of 50% is used. The total welfare loss of lung-cancer must be a weighted average of the estimate of non-fatal lung cancer and cancer death respectively. This is estimated to be DKK 9.4 million. (at a discount factor of 3%), taken into account the average duration of the disease for person cured and the time of appearance of the death. It should be mentioned that the estimate of non-fatal lung cancer is subject to a high degree of uncertainty. As seen above, however, it does only to a limited extent affect the weighted average of lung cancer welfare loss estimate. 8.6 Production lossNo information on the absence from work in connection with lung cancer has been found in the literature. For the present purpose it is assumed that a patient that is cured during a certain year will be absent 50% of the day during the period of illness, which is 6 months in average. Following this, he will be absent 25% of the year, during which he is cured. Survivors likewise are assumed to be absent 50% of the time, and the period of illness lasts the whole year. For people dying within a certain year it is assumed that they are 100% absent from work. Since gross production loss should only be included until the day of death, it is taken into account, that people in average live 6 months within the year of death. Besides this, the net production loss due to mortality must be included. A person dying implies a net production loss to the society during the expected life time remaining in case of no lung cancer. For the present purpose it is assumed that the average age of patient achieving the diagnosis of lung cancer (in year 1) is 50 years. According to Statistics Denmark (2003a) the expected remaining life time at this age is 29 years. Thus, each patient that eventually dies will result in a net production loss from the day of death (in average after 6 months within the year of death) until the day he would have turned 79 years. The average production loss per case of lung cancer is estimated to DKK 253,616. 8.7 Unit cost estimateThe total result of the unit cost estimation of lung cancer is seen in Table 8-5 below. Table 8-5: Total unit cost estimate for lung cancer (DKK 2002 values)
At a discount rate of 3% the unit cost is DKK 9,683,411. The individual welfare loss contributes with no less than 95.9% of the cost, being far the most important cost element. This is mainly due to the high mortality risk of lung cancer along with the relatively high value of a statistical life used for valuation. It is further seen that choice of discount factor does not change the result very much, mainly do to the fact that the average remaining lifetime at the time of diagnosis settlement is rather low (during the first year no less than 77% of the patients die) and following this most cost will fall within the first year. Footnotes14 The entire list of chemicals known or suspected to cause lung cancer is available at http://www.epa.gov/oppt/coi/toc.html. See Chapter II.5. 15 Based on Olivier et al. (2001), Behandling af lungkræft (Kræftens Bekæmpelse (2003a)), and Braud et al. (2001). 16 AEA Technology (2001), page 71-72.
|


