|
Update on Impact Categories, Normalisation and Weighting in LCA 7 Acidification
Leif Hoffmann, dk-TEKNIK ENERGY & ENVIRONMENT 7.1 SummaryThis chapter summarises the presently available data on emissions of acidifying substances to the Danish and the European environment. The contributing emissions include:
Emission data for these substances are generally available for Denmark and the European countries (EU-15) as well as number of other European countries. The normalisation references for acidification are presented in Table 7-1. The worldwide normalisation references is calculated by extrapolation from the normalisation factor for EU-15. Table 7-1
SOx accounts for 30-45%, NOx for 30-35% and NH3 for 25-40% of the effect potential contributing to the normalisation reference. The normalisation reference is relatively certain as the relevant emissions to air have been measured through many years according to the Convention on Long-range Transboundary Air Pollution and the following Protocols. 7.2 Description of the impact categoryAcidification is a local and regional effect. Acidification is caused by releases of protons in the terrestrial or aquatic ecosystems. The acidifying substances are only contributing to acidification if the anion is leached out from the system. If the anion stays in the system, natural processes usually neutralise the acid. In certain areas acidification leads to increased mobility of heavy metals and aluminium. In the terrestrial ecosystem the effects are seen in softwood forests (e.g. spruce) but also in hardwood forests (e.g. beech) as inefficient growth and as a final consequence dieback of the forest. These effects are mainly seen in Scandinavia and in the middle/eastern part of Europe. In the aquatic ecosystem the effects are seen as clear acid lakes without any wildlife. These effects are mainly seen in Scandinavia. Buildings, constructions, sculptures and other objects worthy of preservation are also damaged by e.g. acid rain. The potential effects are dependent on the acidification potential of the specific substance as well as the nature of the receiving ecosystem e.g. nitrogen oxides (NOx) can be fixed in the ecosystem due to uptake in plants. This effect depends on the actual geographical area. Acidifying substances can be divided in different groups according to their chemical nature: strong acids, acidic anhydrides, ammonia, and organic acids. Examples on strong acids are hydrochloric acid (HCl), nitric acid (HNO3), and sulfuric acid (H2SO4) and they react with water as shown in the following example: H2SO4 → 2H+ + SO42- i.e. one mole of sulfuric acid release 2 mole of protons (H+). Examples on acidic anhydrides are SO2, SO3, and NOx and they react as e.g.: SO2 + H2O → H2SO3 → 2H+ + SO32- i.e. one mole of sulfur dioxide release 2 mole of protons (H+). Ammonia is normally considered as a base but in the presence of certain bacteria, ammonia is mineralised (nitrification) to nitrite and nitrate releasing protons: NH3 + 2O2 H+ + NO3- + H2O Organic acids are assumed to be mineralised rather than dissociated and leached. They are therefore not classified as contributors to acidification. See also Hauschild and Wenzel (1998) for further description of the impact category. 7.3 Substances contributing to the impact categorySubstances are considered to have an acidification effect if they result in (Hauschild & Wenzel 1998):
The substances normally considered as contributors to acidification are:
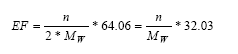
SO2 is used as basis for determination of the acidification potential or the equivalence factor. The method of establishing effect factors for acidifying substances is based on stoichiometric considerations and it is internationally accepted. The equivalency factors are determined as:
where MW is the molecular weight of the substance emitted [g/mole] n is the number of hydrogen ions released in the recipient as a result of conversion of the substance 64.06 g/mole is the molecular weight of SO2 The equivalency factors for the acidifying substances are compiled in Table 7-2. Table 7-2
1 x is assumed to have an average value of 2. The acidification potential (AP) can be estimated as SO2-equivalents:
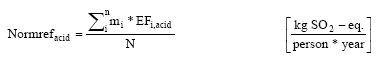
where EFi is the equivalency factor for the substance i mi is the emission of the substance i 7.4 MethodologyThe calculation of the normalisation reference for acidification has been carried out according to the methodology described in (Hauschild & Wenzel, 1998). The normalisation reference is calculated as:
where: Normrefacid is the normalisation reference for acidification mi is emitted quantity of the substance i EFi is the equivalence factor for the substance i N is number of capita in the considered area Included in the normalisation reference are the following substances:
as the substances are the only substances considered in the international regulations of acidifying substances. 7.5 Normalisation reference7.5.1 DenmarkThe emission data used in the calculation of the normalisation reference is presented in Table 7-3. Table 7-3
1 Hauschild and Wenzel (1998). 2 Ritter (1997). The Danish normalisation reference for acidification (1994) can be calculated as: 101 kg SO2-equivalents/year/capita The similar value for 1990 was 124 kg SO2-equivalents/year/capita. This means that the normalisation factor is reduced by 20%. The contribution of acidifying impact from the four substances included in the 1990 normalisation factor is 28%, 30%, 41%, and <1% for SOx, NOx, NH3, and HCl, respectively. In 1994 the distribution can be calculated to 30%, 37%, and 33% for SOx, NOx, and NH3 respectively. The quality of the data used for calculation of the Danish normalisation reference is expectedly of high quality, as the registration of the actual emissions has been performed in a number of years. According to Ritter (1997) the emission estimates are made on highest level e.g. level A (the emission estimates are fully detailed). 7.5.1.1 EU-15 The emission data used in the calculation of the normalisation reference is presented in Table 7-4. Emission data for approximately forty European countries is presented in Appendix B. Table 7-4
1 Hauschild and Wenzel (1998). 2 Ritter (1997). The European (EU-15) normalisation reference for acidification (1994) can be calculated as: 74 kg SO2-equivalents/year/capita The similar value for 1990 was 83 kg SO2-equivalents/year/capita. This means that the normalisation factor is reduced by 10%. The contribution of acidifying impact from the three substances included in the 1994 normalisation factor is 44%, 32%, and 24% for SOx, NOx, and NH3 respectively. Normalisation references for the fifteen European countries included in EU-15 are presented in Appendix C. The quality of the data used in the calculation of the European normalisation reference depends on the actual countries as the emission estimates are provided by the national authorities/national reference centres. Similar data can be found in a number of sources all based on the same national information. The CORINAIR report inform about the status of the presented emission estimates, and the 1994 emission are assessed as follows:
According to the update report including 1995 emissions (Koch 1998), the assessment of the status of the estimates are decreased for two countries and the data are missing for four countries at the time of publication. The process of making and publishing the emission estimates is continuous i.e. the national estimates are improved when better emission factors become available. 7.5.2 WorldAcidification has been used as case for investigation and illustration of relations between normalisation factors and different general available data as economical data, population, and production data etc. (see chapter 3, Development of normalisation references for different geographic areas, for details). By testing different relations between kg SO2-eq./capita/year and the considered factors the best relation is shown to be kg SO2-eq./capita/.year vs. ln(GDP/capita). This extrapolation method results in the following worldwide normalisation reference for acidification: 59 kg SO2-eq./capita/year The quality of the data used as basis for the extrapolation method is described in chapter 3. 7.5.3 SummaryThe normalisation references for acidification covering different geographical areas compared with the previous normalisation references; see Table 7-5. Table 7-5
1 Hauschild and Wenzel (1998). The normalisation references for Denmark and EU-15 are decreased by 10 - 20% in the years 1990 to 1994. 7.6 Recommendations for future updateAs mentioned above the information on and quality of emissions depend on the national estimates. The limit for improvement of the normalisation references is the speed of national collection/estimation of emissions. The national reporting to e.g. European Topic Centre on Air Emissions (ETC Air Emissions) or the Co-operative programme for monitoring and evaluation of the long range transmission of air pollutants in Europe (EMEP) is also a limiting factor. These centres collect and evaluate national information on air pollutants according to the Convention on Long-range Transboundary Air Pollution (UN-ECE 1979). Potential data sources to be used in future updating of the normalisation reference for acidification is compiled in Appendix A. 7.7 ReferencesHauschild, M. & Wenzel, H. 1998, Acidification as a criterion in the environmental assessment of products in Environmental assessment of products. Volume 2 Scientific background eds. Hauschild, M. & Wenzel, H. London: Chapman & Hall. Koch, D. 1998, Air emissions - Annual topic update 1997. Topic Report no.4. European Environment Agency. Ritter, M. 1997, CORINAIR 94 - Summary Report - European Emission Inventory for Air Pollutants. Copenhagen: European Environment Agency. UN-ECE 1979, Convention on Long-range Transboundary Air Pollution. United Nations, Economic Commission for Europe. Available: http//:www.unece.org. Appendix A: Data sourcesThe substances contribution to acidification (SO2, NOx, and NH3) are all systematically registered due to different conventions on air pollution (e.g. "Convention on Long-range Transboundary Air Pollution" (UN-ECE 1979)). Therefore, these emissions can be expected to be updated regularly e.g. yearly for most of the countries. The data sources can be divided in databases (paper) databases (electronic), and organisations. Databases (paper)
Databases (electronic)
Organisations
Appendix B: Emission dataThe date presented in the table is based on Ritter (1997)/Eurostat (1998) except where other references are given.
1 Hauschild and Wenzel (1998). Appendix C: Normalisation references for EU-15 countries
1 Ritter (1997).
|