|
Waste Statistics 2003 2 Recycling2.1 Recycling by fraction 2.1 Recycling by fractionTable 4 shows the amounts separated from the different waste fractions for the purpose of recycling in the form of either reprocessing, composting or biogasification. The Table does not show the total amount of waste generated by the individual fraction. 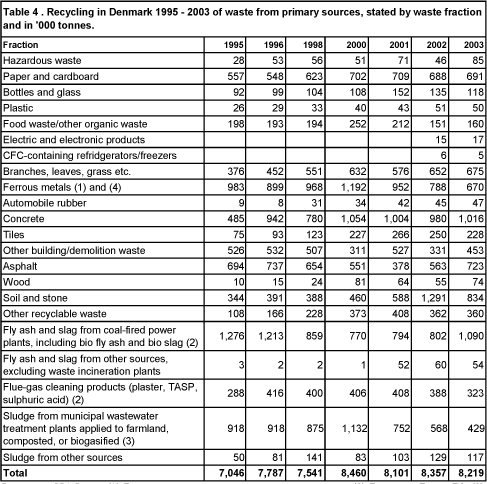
Source: the ISAG and (1) Recycling industries and other large scrap dealers. (2) Elsam and Energi E2. (3) Reports to the Danish EPA on sludge from municipal wastewater treatment plants applied to farmland etc. Data has been delayed a year so that 2002 figures are used for 2003, and 2001 figures are used for 2002, and so on. Sludge for long-term storage has been included in the amount for recycling. (4) To avoid double reporting, figures have been corrected for ferrous metals removed from waste incineration plants. As the table shows, 8,219,000 tonnes of waste were recycled in 2003, which is 2 per cent or 138,000 tonnes less than in 2002. This fall is especially due to less recycling of soil, stone, and sludge from municipal wastewater treatment plants, and ferrous metals. However, at the same time a number of waste fractions show increases, including concrete, asphalt, as well as fly ash and slag from coal-fired power plants. 2.2 Paper and cardboardConsumption of virgin paper and the rate of collection of waste paper in the period from 1994 to 2003 are shown in Table 5. Total collected waste paper in 2003 amounted to 691,000 tonnes. This is an increase of 3,000 tonnes, or of less than one per cent, compared to the total amount collected in 2002. 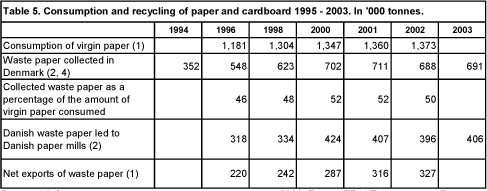
Source: (1) Statistics on collected waste paper and cardboard 2002. Danish EPA, Environmental Project No. 937, 2004. (2) The ISAG reports. (3) Statistics Denmark. In Waste Statistics 2001, net exports of collected waste paper were stated as 258,000 tonnes. The final figure from Statistics Denmark is 316,000 tonnes. (4) Some of the increase from 1998 to 2000 is explained by a correction of reporting to the ISAG. Thus, about 100,000 tonnes were diverted from secondary sources to primary sources in connection with a quality control of reporting in 2000. The relevant waste treatment plants have (probably) also reported incorrectly in previous years, which may account in part for the previous differences in amounts of collected waste paper in statements based respectively on the ISAG and material flow monitoring of collected waste paper (Danish waste paper delivered to Danish paper mills and Net exports of waste paper). The rise in the amount of waste paper from trade/offices and the drop in the amount of paper from households are probably due to problems with reporting of waste split between primary and secondary sources. In connection with quality control, e.g. Smørum Papir stated that they no longer receive waste paper from households. This alone means a fall of 45,000 tonnes from 2000. Apparently, no other plant has reported a compensating increase. Table 6 shows collected paper by source and by packaging waste and remaining waste types. Not surprisingly, the largest amounts of waste paper are collected from households, the service sector and industry. The largest amounts of packaging waste are collected from industry. 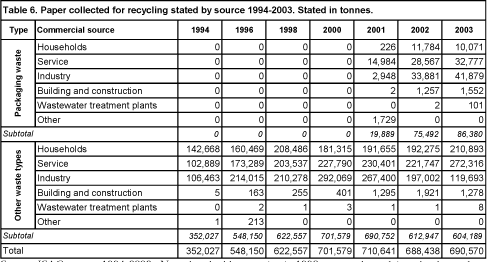
Source: ISAG reports 1994-2003. Note that double reporting in 1998 apparently explains why the total amount is 20,000 tonnes too high. The total amounts of waste paper and cardboard for 2000 and 2001 were reported incorrectly in Waste Statistics 2001. Corrected figures are shown in Table 6. Packaging waste is a new waste type in the ISAG and it does not yet reflect the total amount of cardboard packaging waste collected for recycling in Denmark. In 2002, 308,000 tonnes of paper and cardboard packaging waste were collected for recycling [12]. The amount of waste paper collected from households went up by 16,905 tonnes from 2002 to 2003. From 1998 to 2000, the amounts of collected waste paper from households remained stable at around 180,000 tonnes [13]. From 2001 and onward the amount increased to around 221,000 in 2003. The amount of waste paper collected from the service sector has gone up by around 54,779 tonnes, or 22 per cent, amounting to 305,093 tonnes in 2003. The amount of paper collected from industry has fallen by around 69,311 tonnes corresponding to 30 per cent compared to 2002. In the ISAG, waste delivered to a recycling centre/transfer station is reported with the commercial source “recycling centre/transfer station”. This means that it is not stated whether the waste originated from households or from other primary commercial sources. From 2001, recycling centres/transfer stations must indicate a split between waste types and primary source. Since this is not yet routine, the ISAG Secretariat has divided the waste as shown in Annex 2. 2.3 PlasticTable 7 shows the amount of plastic collected for recycling, reported to the ISAG. In 2003 this amount was 49,941 tonnes, which is a fall of around 682 tonnes from 2002. However, it is assumed that some plastic has been collected and exported directly for recycling abroad without having been registered at a Danish treatment plant. It is therefore probable that the amount of waste plastic collected in Denmark is higher than 49,941 tonnes. 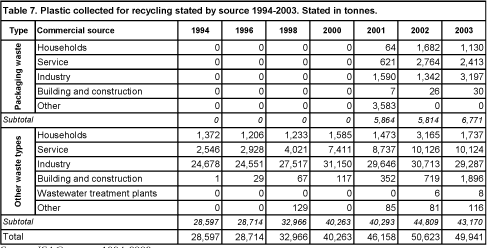
Source: ISAG reports 1994-2003. The fraction plastic covers both production waste, plastic packaging waste, and other plastic waste, with individual figures shown in Table 7. Packaging waste is a new waste type in the ISAG and it does not yet reflect the total amount of waste plastic packaging collected for recycling and reprocessing in Denmark. Therefore, in the following description of plastic recycling, ISAG figures have been supplemented with information from more detailed statistics on waste plastic packaging. Statistics for waste plastic packaging in 2002 [14] show that 21,104 tonnes of waste plastic packaging were reprocessed in Denmark in 2002. Half of this amount was imported. In 2002, 24,409 tonnes of waste plastic packaging were collected and recycled in Denmark. Of this amount, 14,382 tonnes were exported for recycling abroad. The total amount collected corresponds to 15.5 per cent of the total Danish consumption of plastic packaging. This is a slight increase from 2001, when 13.9 per cent of waste plastic packaging was collected for recycling. Waste plastic of the type polyethylene (PE) accounted for 83 per cent of collected amounts. 2.4 Bottles and glassAccording to the ISAG reports, 117,826 tonnes of bottles and glass were collected for recycling in Denmark in 2003. This is 17,175 tonnes less than in 2002. The fall is explained by the fact that glass as a packaging type increasingly is being replaced by other types of packaging, e.g., plastic. [15] As seen in Table 8, the amount of glass collected for recycling went up by 8,298 tonnes, or 8 per cent, during the period 1994 to 2003. However, the figures fluctuate somewhat throughout the period. At the same time it is seen that the amount of glass packaging collected from households has dropped significantly in the period 2001 to 2003. 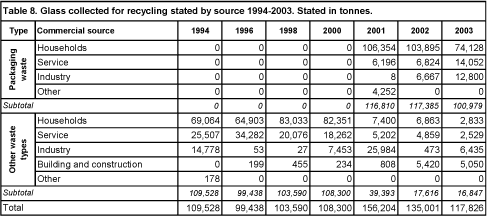
Source: ISAG reports 1994-2003. It is evident from Table 8 that by far the major part of the glass collected is packaging waste: thus, packaging waste accounted for 86 per cent of the total amount of glass in 2003. However, the ISAG does not provide a complete picture of the overall material flow. This is especially significant with regard to recycling of bottles and glass, which is a process comprising several collection, reuse and treatment steps before glass becomes waste. Therefore, in the following description of overall glass recycling, ISAG information is supplemented with information from Statistics on glass packaging 2002 [16], cf. Figure 6. 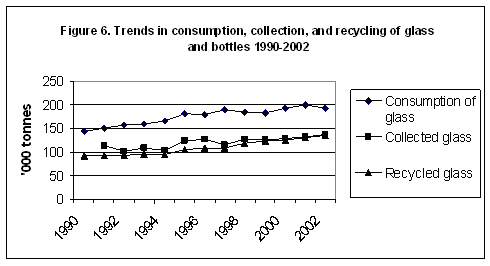
Source: Statistics on glass packaging 2002. Environmental Project No. 935, 2004. Note that total consumption for 1999 has been adjusted to reflect Statistics on glass packaging 1999. The adjustment is due to a write up of amounts of glass packaging for food preservation. Apart from minor fluctuations, consumption of glass packaging increased throughout the 1990s. Correspondingly, the amount of glass packaging collected and recycled has increased. Collected glass amounted to 132,000 tonnes in 2001 but rose to 137,000 tonnes in 2002. Amounts of recycled glass also increased, namely from 130,000 tonnes in 2001 to 135,000 tonnes in 2002. This means that in 2002 the collection rate as a percentage of total consumption reached 70 per cent, which is an increase of 5 percentage points compared to 2001. In 2001, the recycling rate as a percentage of total consumption reached 65 per cent. Bottles for beer and soft drinks manufactured for reuse are not included in this statement. Refillable glass bottles, on average, make 30 trips. If these bottles were manufactured as single-use bottles, it would give an increase in waste glass of around 310,000 tonnes. 2.5 Ferrous metalsTable 9 shows the overall amount of ferrous scrap collected, analysed between consignees. It is seen that 857,000 tonnes of ferrous metals were recycled in 2003, which is an increase of 139,000 tonnes, or 19 per cent, from 2002. Table 9 shows a drop of 106,000 tonnes, or 91 per cent, in the amount of ferrous scrap imported by foundries and the Danish Steel Works. The Association of Danish Recycling Industries has reported that ferrous scrap not sent to the Danish Steel Works has been exported. We do not have more precise data on the total recycling potential for ferrous scrap. However, the Association of Danish Recycling Industries normally estimates a recycling rate for ferrous scrap in excess of 90 per cent. According to reports to the Danish EPA, the Danish Steel Works and other Danish foundries imported 10,000 tonnes of ferrous scrap in 2003, whereas scrap dealers imported around 142,000 tonnes. In other words, total imports in 2003 amounted to 152,000 tonnes, which is 40,000 tonnes, or 21 per cent, less than in 2002. Scrap dealers exported 738,000 tonnes of ferrous scrap in 2003, which means that net exports in 2003 were 596,000 tonnes. This is an increase of 11 per cent from 2002. 2.6 Organic waste for composting, wood chipping and biogasificationThe amount of organic waste led to reprocessing in the form of composting, wood chipping, biogasification, or fodder is shown in Table 10. Organic waste led to reprocessing in 2003 amounted to 1,306,000 tonnes. This is 22,000 tonnes more than in 2002. The increase is due to in particular to the amount of branches, leaves etc. for composting, which rose by 31,000 tonnes. The amount of bark/wood chips and compost removed from treatment plants does not reflect the total amount generated at the plants. Rather, this amount indicates the quantity sold or delivered free from the plants. As is seen from the table, the amount of sold/removed bark/wood chips came to around 12,000 tonnes more in 2003 than in 2002, whereas the amount of sold/removed compost was 11,000 tonnes less than in 2002. 2.7 TyresIn 1995, the Minister for Environment and Energy entered an agreement with a number of organisations, on a take-back scheme for used tyres from cars, vans, and motorcycles. The purpose of the agreement is to ensure collection and recycling of used tyres in Denmark. Landfilling is avoided and resource recovery ensured, whereby recycling is prioritised over energy recovery. The scheme started on 1 April 1995 and is financed by a fee on all tyres covered by the agreement and marketed in Denmark. According to the agreement, the target is a take-back rate of at least 80 per cent. From 1 April 2000 the scheme was extended to cover tyres from all types of motor vehicles. This accounts for the leap in data from 1999 to 2000 in Table 11. The table shows that the collection rate for waste tyres surpassed 100 per cent in 2002. According to reports from the Danish Tyre Trade Environmental Foundation, this is presumably due to the fact that waste tyres have been imported from Germany, as well as to the fact that some waste tyres have been collected and stored for several years. 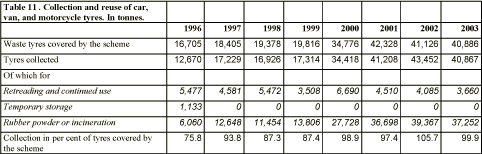
Source: reports from the Danish Tyre Trade Environmental Foundation in 1996, 1997, 1998, 1999, 2000, 2001, 2002 and 2003. Footnotes [12] Reporting of packaging waste to the EU. [13] The amount reported in 1998 is probably 20,000 tonnes too high due to double reporting. [14] Statistics for waste plastic packaging in 2002 Environmental Project No. 936, 2004. [15]There is a minor fall in the consumption of glass packaging from 2001 to 2002. Statistics on glass packaging 2002, Danish EPA, Environmental Project No. 935, 2004. [16] Statistics on glass packaging 2002. The Danish EPA. Environmental Project No. 935, 2004.
|