|
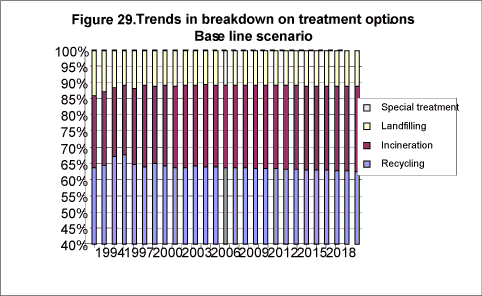
Waste Statistics 2003 8 Projection of waste arisings8.1 Model suitability for describing historical developments 8.1 Model suitability for describing historical developmentsSection 8.2 presents a baseline projection of waste arisings up to 2020. The so-called Risø model has been used for the projection. The projection is based on prospects in Finansredegørelse 2001 (Medium Term Economic Survey 2001), the latest projection from March 2001 from the Danish Energy Authority, and an adjustment of the model to accord with ISAG data for 2000. Before making the projection, the suitability of the model for describing historical developments in waste generation was evaluated. This was done by adjusting the model to accord with Waste Statistics 2000, and applying it to calculate developments in waste arisings from 1994 to 2000. Actual waste arisings for the period 1995 to 2000 increased by about 14 per cent . [35]However, model calculations show total waste arisings as unchanged. A significant part of this deviation is due to the fact that the model calculates a larger decrease in the generation of residues from coal-fired power plants than was actually the case. As to arisings stated endogenously [36] in the model, economic developments may explain around half of the increase in total arisings from 1995 to 2000. Around 250,000 tonnes of the deviation of 977,000 tonnes in 1995 may be explained by a larger collection of garden waste, which is described exogenously in the model [37] in the model. In addition, the increase in recyclable fractions is considerably larger than the decrease in the generation of “various non- combustible waste”. A significant part of this increase is due to increased recycling of construction and demolition waste. If this is taken account of, there is a deviation in 1995 of around 400,000 tonnes between the model and actual generation registered. This deviation is due to significantly higher generation in 2000, particularly in the fractions ferrous metals, wood, soil and stone and sludge. 8.2 Baseline projection of waste arisings 1994 to 2020The baseline projection of waste arisings predicts an increase in total waste arisings from 2000 to 2020 of 27 per cent, corresponding to an increase from 13 million tonnes in 2000 to 16.5 million tonnes in 2020, cf. Figure 28 [38]. The baseline projection describes expected developments in waste generation on the basis of estimated economic activity. It is assumed that no new waste political initiatives will be launched. However, an increase is expected in production and consumption of 43 per cent and 53 per cent respectively. Thus, the model projects waste generation to increase less than economic activity. Significant reasons for this are the decreasing use of coal at power plants and expected low growth in building and construction activity. As Figure 28 shows, the baseline projection estimates a steeper increase in the volumes of “combustible” waste and “non-combustible” waste than in recyclable fractions such as paper and cardboard, glass, and plastic. Amounts of ferrous metals and automobile tyres are expected to show a relatively high increase due to the expected increase in industrial production and the expected increase in private consumption of transport. The modest increase in volumes of slag is due to an expected relatively constant coal consumption in the period. Volumes of beet soil are expected to decrease due to new technologies causing less soil to stick to the beets during harvesting. However, depending on weather conditions during harvesting there are normally large variations over the years. Volumes of sludge from municipal wastewater treatment plants are expected to increase due to new treatment technologies causing water contents in the sludge to increase with an unchanged amount of dry matter. This is expected to lead to an increase of 500,000 tonnes in the next five years without a corresponding increase in dry matter volumes. This means that the rate of waste for recycling will decrease from around 64.8 per cent in 2000 to around 62.5 per cent in 2020. Correspondingly, the rate led to incineration will go from around 24 per cent in 2000 to around 26.4 per cent in 2020. The rate led to landfill will remain relatively constant at around 11 per cent, cf. Figure 29. 
Footnotes [35] Part of the increase is attributable to an extension of the statistical basis. [36] I.e. calculated within the assumptions of the model. [37] I.e. fixed outside the model. [38] Note that e.g. amounts of paper and cardboard are not an expression of the total potential of this fraction, but merely state the amount of paper and cardboard separated for recycling. The fraction “combustible” thus may also contain paper and cardboard and other recyclable fractions.
|