|
| Front page | | Contents | | Previous |
Substitution of cobalt driers in wood coatings
Appendix A - Statistical analysis of 26-3 fractional factorial designs.
1 Design and results
Click here to see table with design and results
2 Statistic analysis
General Linear Models
---------------------
Number of dependent variables: 7
Number of categorical factors: 8
Number of quantitative factors: 0
Analysis of Variance for YellowingOne
| Source |
Sum of Squares |
Df |
Mean Square |
F-Ratio |
P-Value |
| Model |
14871,5 |
9 |
1652,39 |
1015,40 |
0,0000 |
| Residual |
61,8388 |
38 |
1,62734 |
| Total (Corr.) |
14933,4 |
47 |
|
|
|
| |
| Type III Sums of Squares |
| Source |
Sum of Squares |
Df |
Mean Square |
F-Ratio |
P-Value |
| Anti skin |
0,259602 |
1 |
0,259602 |
0,16 |
0,6918 |
| Binder |
0,0462521 |
1 |
0,0462521 |
0,03 |
0,8670 |
| Color |
14790,8 |
1 |
14790,8 |
9088,95 |
0,0000 |
| Drier |
28,1515 |
2 |
14,0758 |
8,65 |
0,0008 |
| Fungicide |
0,0910021 |
1 |
0,0910021 |
0,06 |
0,8143 |
| HALS |
2,47975 |
1 |
2,47975 |
1,52 |
0,2246 |
| Thix binder |
49,5524 |
1 |
49,5524 |
30,45 |
0,0000 |
| UV abs |
0,155269 |
1 |
0,155269 |
0,10 |
0,7591 |
| Residual |
61,8388 |
38 |
1,62734 |
|
|
| Total (corrected) |
14933,4 |
47 |
|
|
|
All F-ratios are based on the residual mean square error.
R-Squared = 99,5859 percent
R-Squared (adjusted for d.f.) = 99,4878 percent
Standard Error of Est. = 1,27567
Mean absolute error = 0,92467
Durbin-Watson statistic = 2,28349
Residual Analysis
| |
Estimation |
Validation |
| N |
48 |
|
| MSE |
1,62734 |
|
| MAE |
0,92467 |
|
| MAPE |
7,60461 |
|
| ME |
-5,71765E-15 |
|
| MPE |
-1,41698 |
|
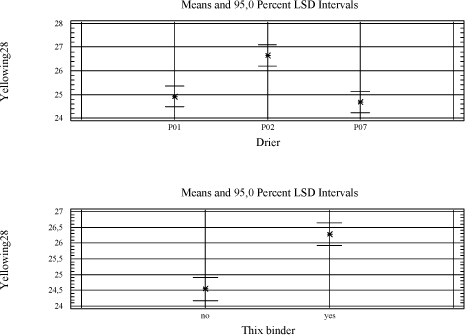
Analysis of Variance for Yellowing28
| Source |
Sum of Squares |
Df |
Mean Square |
F-Ratio |
P-Value |
| Model |
14318,0 |
9 |
1590,89 |
1033,84 |
0,0000 |
| Residual |
58,475 |
38 |
1,53881 |
|
|
| Total (Corr.) |
14376,5 |
47 |
|
|
|
| |
| Type III Sums of Squares |
| Source |
Sum of Squares |
Df |
Mean Square |
F-Ratio |
P-Value |
| Anti skin |
0,0229688 |
1 |
0,0229688 |
0,01 |
0,9034 |
| Binder |
0,00016875 |
1 |
0,00016875 |
0,00 |
0,9917 |
| Color |
14242,0 |
1 |
14242,0 |
9255,16 |
0,0000 |
| Drier |
37,1699 |
2 |
18,5849 |
12,08 |
0,0001 |
| Fungicide |
0,188752 |
1 |
0,188752 |
0,12 |
0,7281 |
| HALS |
2,31002 |
1 |
2,31002 |
1,50 |
0,2280 |
| Thix binder |
36,3138 |
1 |
36,3138 |
23,60 |
0,0000 |
| UV abs |
0,00175208 |
1 |
0,00175208 |
0,00 |
0,9733 |
| Residual |
58,475 |
38 |
1,53881 |
|
|
| Total (corrected) |
14376,5 |
47 |
|
|
|
All F-ratios are based on the residual mean square error.
R-Squared = 99,5933 percent
R-Squared (adjusted for d.f.) = 99,4969 percent
Standard Error of Est. = 1,24049
Mean absolute error = 0,908741
Durbin-Watson statistic = 1,87598
Residual Analysis
| |
Estimation |
Validation |
| N |
48 |
|
| MSE |
1,53881 |
|
| MAE |
0,908741 |
|
| MAPE |
6,32946 |
|
| ME |
-5,71765E-15 |
|
| MPE |
-1,25901 |
Analysis of Variance for Tack6
| Source |
Sum of Squares |
Df |
Mean Square |
F-Ratio |
P-Value |
| Model |
45,3281 |
9 |
5,03646 |
10,39 |
0,0000 |
| Residual |
18,4167 |
38 |
0,484649 |
|
|
| Total (Corr.) |
63,7448 |
47 |
|
|
|
| |
| Type III Sums of Squares |
| Source |
Sum of Squares |
Df |
Mean Square |
F-Ratio |
P-Value |
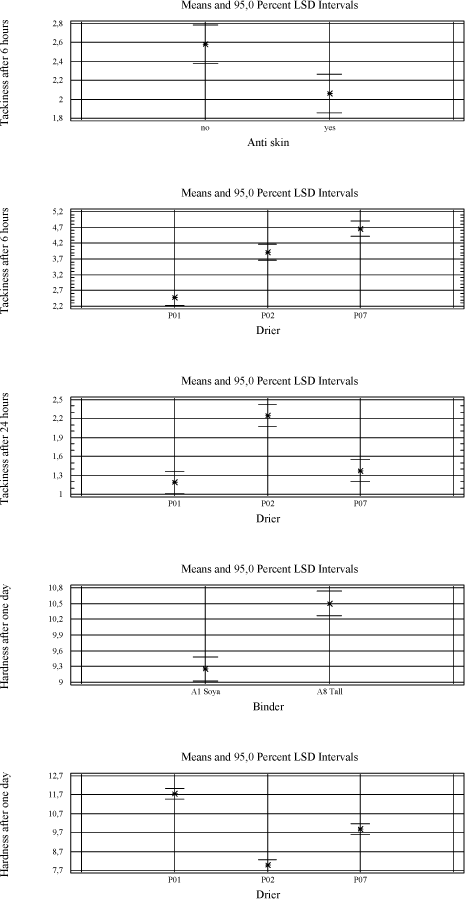
| Anti skin |
3,25521 |
1 |
3,25521 |
6,72 |
0,0135 |
| Binder |
0,130208 |
1 |
0,130208 |
0,27 |
0,6072 |
| Color |
0,046875 |
1 |
0,046875 |
0,10 |
0,7575 |
| Drier |
39,5417 |
2 |
19,7708 |
40,79 |
0,0000 |
| Fungicide |
1,17188 |
1 |
1,17188 |
2,42 |
0,1282 |
| HALS |
1,17188 |
1 |
1,17188 |
2,42 |
0,1282 |
| Thix binder |
0,00520833 |
1 |
0,00520833 |
0,01 |
0,9180 |
| UV abs |
0,00520833 |
1 |
0,00520833 |
0,01 |
0,9180 |
| Residual |
18,4167 |
38 |
0,484649 |
|
|
| Total (corrected) |
63,7448 |
47 |
|
|
|
All F-ratios are based on the residual mean square error.
R-Squared = 71,1088 percent
R-Squared (adjusted for d.f.) = 64,2661 percent
Standard Error of Est. = 0,696167
Mean absolute error = 0,471354
Durbin-Watson statistic = 1,44214
Residual Analysis
| |
Estimation |
Validation |
| N |
48 |
|
| MSE |
0,484649 |
|
| MAE |
0,471354 |
|
| MAPE |
27,0263 |
|
| ME |
0,0 |
|
| MPE |
-9,77203 |
|
Analysis of Variance for Tack24
| Source |
Sum of Squares |
Df |
Mean Square |
F-Ratio |
P-Value |
| Model |
11,6667 |
9 |
1,2963 |
5,59 |
0,0001 |
| Residual |
8,8125 |
38 |
0,231908 |
|
|
| Total (Corr.) |
20,4792 |
47 |
|
|
|
| |
| Type III Sums of Squares |
| Source |
Sum of Squares |
Df |
Mean Square |
F-Ratio |
P-Value |
| Anti skin |
0,1875 |
1 |
0,1875 |
0,81 |
0,3742 |
| Binder |
0,0833333 |
1 |
0,0833333 |
0,36 |
0,5524 |
| Color |
0,0208333 |
1 |
0,0208333 |
0,09 |
0,7660 |
| Drier |
10,2917 |
2 |
5,14583 |
22,19 |
0,0000 |
| Fungicide |
0,1875 |
1 |
0,1875 |
0,81 |
0,3742 |
| HALS |
0,520833 |
1 |
0,520833 |
2,25 |
0,1422 |
| Thix binder |
0,1875 |
1 |
0,1875 |
0,81 |
0,3742 |
| UV abs |
0,1875 |
1 |
0,1875 |
0,81 |
0,3742 |
| Residual |
8,8125 |
38 |
0,231908 |
|
|
| Total (corrected) |
20,4792 |
47 |
|
|
|
All F-ratios are based on the residual mean square error.
R-Squared = 56,9685 percent
R-Squared (adjusted for d.f.) = 46,7768 percent
Standard Error of Est. = 0,481568
Mean absolute error = 0,365451
Durbin-Watson statistic = 1,91465
Residual Analysis
| |
Estimation |
Validation |
| N |
48 |
|
| MSE |
0,231908 |
|
| MAE |
0,365451 |
|
| MAPE |
8,79998 |
|
| ME |
2,59052E-16 |
|
| MPE |
-1,10805 |
|
Analysis of Variance for HardnessOne
| Source |
Sum of Squares |
Df |
Mean Square |
F-Ratio |
P-Value |
| Source |
Sum of Squares |
Df |
Mean Square |
F-Ratio |
P-Value |
| Model |
133,833 |
9 |
14,8704 |
24,13 |
0,0000 |
| Residual |
23,4167 |
38 |
0,616228 |
|
|
| Total (Corr.) |
157,25 |
47 |
|
|
|
| |
| Type III Sums of Squares |
| Source |
Sum of Squares |
Df |
Mean Square |
F-Ratio |
P-Value |
| Anti skin |
0,0 |
1 |
0,0 |
0,00 |
1,0000 |
| Binder |
18,75 |
1 |
18,75 |
30,43 |
0,0000 |
| Color |
0,333333 |
1 |
0,333333 |
0,54 |
0,4666 |
| Drier |
112,5 |
2 |
56,25 |
91,28 |
0,0000 |
| Fungicide |
0,0833333 |
1 |
0,0833333 |
0,14 |
0,7151 |
| HALS |
0,0833333 |
1 |
0,0833333 |
0,14 |
0,7151 |
| Thix binder |
1,33333 |
1 |
1,33333 |
2,16 |
0,1495 |
| UV abs |
0,75 |
1 |
0,75 |
1,22 |
0,2769 |
| Residual |
23,4167 |
38 |
0,616228 |
|
|
| Total (corrected) |
157,25 |
47 |
|
|
|
All F-ratios are based on the residual mean square error.
R-Squared = 85,1086 percent
R-Squared (adjusted for d.f.) = 81,5817 percent
Standard Error of Est. = 0,785002
Mean absolute error = 0,586806
Durbin-Watson statistic = 2,70544
Residual Analysis
| |
Estimation |
Validation |
| N |
48 |
|
| MSE |
0,616228 |
|
| MAE |
0,586806 |
|
| MAPE |
6,17109 |
|
| ME |
0,0 |
|
| MPE |
-0,591566 |
|
Analysis of Variance for Hardness7
| Source |
Sum of Squares |
Df |
Mean Square |
F-Ratio |
P-Value |
| Model |
919,146 |
9 |
102,127 |
31,47 |
0,0000 |
| Residual |
123,333 |
38 |
3,24561 |
|
|
| Total (Corr.) |
1042,48 |
47 |
|
|
|
| |
| Type III Sums of Squares |
| Source |
Sum of Squares |
Df |
Mean Square |
F-Ratio |
P-Value |
| Anti skin |
1,02083 |
1 |
1,02083 |
0,31 |
0,5782 |
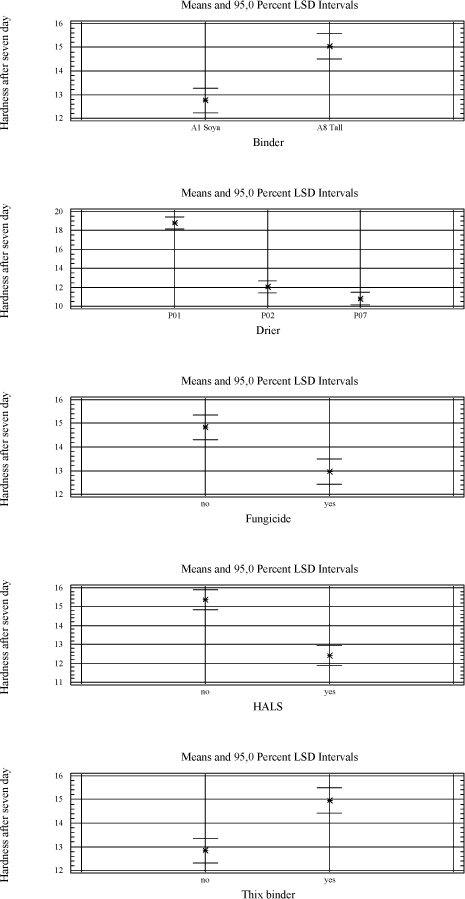
| Binder |
63,0208 |
1 |
63,0208 |
19,42 |
0,0001 |
| Color |
2,52083 |
1 |
2,52083 |
0,78 |
0,3837 |
| Drier |
592,667 |
2 |
296,333 |
91,30 |
0,0000 |
| Fungicide |
42,1875 |
1 |
42,1875 |
13,00 |
0,0009 |
| HALS |
105,021 |
1 |
105,021 |
32,36 |
0,0000 |
| Thix binder |
54,1875 |
1 |
54,1875 |
16,70 |
0,0002 |
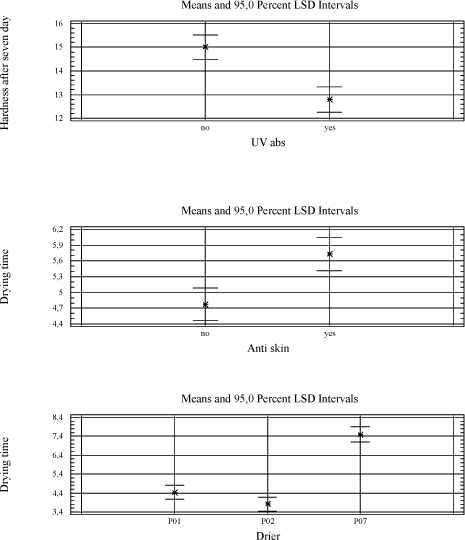
| UV abs |
58,5208 |
1 |
58,5208 |
18,03 |
0,0001 |
| Residual |
123,333 |
38 |
3,24561 |
|
|
| Total (corrected) |
1042,48 |
47 |
|
|
|
All F-ratios are based on the residual mean square error.
R-Squared = 88,1692 percent
R-Squared (adjusted for d.f.) = 85,3672 percent
Standard Error of Est. = 1,80156
Mean absolute error = 1,30903
Durbin-Watson statistic = 2,34626
Residual Analysis
| |
Estimation |
Validation |
| N |
48 |
|
| MSE |
3,24561 |
|
| MAE |
1,30903 |
|
| MAPE |
10,5103 |
|
| ME |
-7,03141E-16 |
|
| MPE |
-1,12406 |
|
Analysis of Variance for Drying time
| Source |
Sum of Squares |
Df |
Mean Square |
F-Ratio |
P-Value |
| Model |
141,904 |
9 |
15,7671 |
14,10 |
0,0000 |
| Residual |
41,3728 |
37 |
1,11818 |
|
|
| Total (Corr.) |
183,277 |
46 |
|
|
|
| |
| Type III Sums of Squares |
| Source |
Sum of Squares |
Df |
Mean Square |
F-Ratio |
P-Value |
| Anti skin |
10,6892 |
1 |
10,6892 |
9,56 |
0,0038 |
| Binder |
2,0086 |
1 |
2,0086 |
1,80 |
0,1883 |
| Color |
1,28211 |
1 |
1,28211 |
1,15 |
0,2912 |
| Drier |
118,325 |
2 |
59,1626 |
52,91 |
0,0000 |
| Fungicid |
7,36865 |
1 |
7,36865 |
6,59 |
0,0144 |
| HALS |
1,3163 |
1 |
1,3163 |
1,18 |
0,2850 |
| Thix binder |
1,62506 |
1 |
1,62506 |
1,45 |
0,2357 |
| UV abs |
0,0224921 |
1 |
0,0224921 |
0,02 |
0,8880 |
| Residual |
41,3728 |
37 |
1,11818 |
|
|
| Total (corrected) |
183,277 |
46 |
|
|
|
All F-ratios are based on the residual mean square error.
R-Squared = 77,426 percent
R-Squared (adjusted for d.f.) = 71,9351 percent
Standard Error of Est. = 1,05744
Mean absolute error = 0,714632
Durbin-Watson statistic = 1,76075
Residual Analysis
| |
Estimation |
Validation |
| N 47 |
|
| MSE |
1,11818
| |
| MAE |
0,714632
| |
| MAPE |
14,817
| |
| ME |
0,0
| |
| MPE |
-3,2546 |
|
The StatAdvisor
--------------------
This pane summarizes the results of fitting 7 general linear statistical model relating 7 dependent variables to 8 predictive factors. Since the P-value in the first ANOVA table for YellowingOne is less than 0.01, there is a statistically significant relationship between YellowingOne and the predictor variables at the 99% confidence level.
The R-Squared statistic indicates that the model as fitted explains 77,426% of the variability in YellowingOne. The adjusted R-squared statistic, which is more suitable for comparing models with different numbers of independent variables, is 71,9351%. The standard error of the estimate shows the standard deviation of the residuals to be 1,05744. This value can be used to construct prediction limits for new observations by selecting the Reports option from the text menu. The mean absolute error (MAE) of 0,92467 is the average value of the residuals. The Durbin-Watson (DW) statistic tests the residuals to determine if there is any significant correlation based on the order in which they occur in your data file. Since the DW value is greater than 1.4, there is probably not any serious autocorrelation in the residuals.
The output also summarizes the performance of the model in fitting the data, and in predicting any values withheld from the fitting process. It displays:
(1) the mean squared error (MSE)
(2) the mean absolute error (MAE)
(3) the mean absolute percentage error (MAPE)
(4) the mean error (ME)
(5) the mean percentage error (MPE)
Each of the statistics is based on the residuals. The first three statistics measure the magnitude of the errors. A better model will give a smaller value. The last two statistics measure bias. A better model will give a value close to 0.0.
Below is a graphical presentation of the significant factors
| Front page | | Contents | | Previous | | Top |
Version 1.0 August 2006, © Danish Environmental Protection Agency
|