Ecolabelling of printed matter - part II
Summary and conclusions
Studies covering the life cycle from cradle to grave of printed matter products have been carried out over the last ten years. Though the number of studies is limited, 4-5 of them include offset printed matter. All these life cycle assessments (LCAs) focus on energy consumption and energy related impact categories, whereas chemical related impact categories covering ecotoxicity and human toxicity are only included to a limited degree or not at all. Results of all these existing LCA’s point to paper as the dominating contributor to the potential environmental impact from the life-cycle of offset printed matter. In only one of the existing studies is sheet fed offset produced printed matter included as a separate entity, and in that particular case the chemical related impact categories are not included at all.
In this report we include the chemical related impact categories to a higher degree and focus on an LCA of generic sheet fed offset printed matter produced at a model sheet fed printing company.
The LCA methodology chosen in this study is the EDIP method. This methodology with its relatively simple key property based impact assessment part seems feasible for the LCA approach relevant for use in ecolabelling of products associated with many chemical emissions.
Goal and scope definition
The goal of the study is to identify the distribution of potential environmental impacts and consumption of resources during the life cycle of generic printed matter produced on a model sheet feed offset printing company in Europe. The results are to be used for developing ecolabelling criteria.
Main activities at all stages in the life cycle are covered to the degree that readily available data has made possible and average/typical data have been used, i.e. not from a specific printing company with a functional unit defined in details. However the stage of use for which only transport may be important is excluded but assessed on basis of existing studies.
There is a special focus on the production stage but upstream emissions assessed to be of possible significance are included (e.g. estimated emissions from pigment production) or dealt with in the sensitivity analysis. The data are assessed as being suitable for developing ecolabelling criteria from an LCA approach, especially if combined with sensitivity analyses.
The functional unit is 1 ton of sheet feed offset produced printed matter, i.e. printed communication covering books, pamphlets etc.
The impact assessment categories used includes global warming, ozone depletion, acidification, nutrient enrichment, photochemical ozone formation, chronic human toxicity via water and soil, chronic ecotoxicity in water and soil, acute human toxicity via air, acute ecotoxicity in water, hazardous waste, nuclear waste, slag and ashes, and bulk waste. Resource consumption is also included.
As the time scope for the production stage 1990 – 2002 has been chosen and the technological scope is mainly modern technology (not state-of-the-art) used at least in Northern Europe.
Marginal approaches are used for production of electricity (natural gas) and paper production (virgin fibres) as the main approach in the reference scenario. In all other cases an average approach is used.
Waste water treatment is not included in the reference scenario, making this scenario also relevant for Southern and Eastern Europe. However, a special scenario with waste water treatment is included and can be considered as being relevant for Northern Europe, especially Sweden and Denmark.
In the reference scenario the avoided energy consumption and avoided emissions from incineration and recycling of paper are either not allocated to the functional unit (designated paper gross) or allocated to the functional unit (designated paper net). For consumption of aluminium, it is assumed that recycled aluminium is used and the extra energy used to produce virgin aluminium to replace the loss during the recycling process is allocated to the functional unit. For both paper and aluminium the effect of changing the allocation used is discussed or investigated by the use of sensitivity analysis.
As this study is going to be used for ecolabelling, the main focus is on the production stage, i.e. page production (repro), plate making, printing, finishing and cleaning. The raw materials included in the production stage cover the dominant types typically used in ‘traditional’ sheet feed offset, i.e. film, film developer, fixer, biocides, plates, plate developer, gumming solution, paper, alcohol (isopropyl alcohol, IPA), printing ink, fountain solution, lacquer (varnishes), glue and cleaning agents. The composition of these raw materials is as far as possible based on known typical recipes, but due to lack of data and relevance simplifications and assumptions about the components have been made.
Due to the focus on the production stage and lack of data on consumptions and emissions, the material and disposal stages are only taken into account as far as they are covered by the unit processes included. This means that emissions of specific substances are typically not included. Ink, paper and energy production are exceptions for which emissions of specific substances are included at least to some degree.
The consumption of raw materials at the model printing company is mainly based on average values for 10 – 70 Swedish and Danish offset printing industries. The range in the consumption of the most important raw materials is typically well below (e.g. factor of 2 for paper) or just above (e.g. factor of 15 for ink) a factor of about 10.
The emissions to water and air at the model printing company are also mainly based on Swedish and Danish investigations. Non-volatile substances (e.g. biocides) appearing in rinse water and fountain solutions are assumed to be 100% emitted to water. 70 – 95% of volatile solvents are assumed to be emitted to air and in this case only 0.1% or 1% (depending on the type) is emitted to water with IPA as an exception, i.e. 14% emitted to water. The rest of the used solvents are disposed of as chemical waste.
Besides the reference scenario for which the conditions are described above, seven special scenarios have been drawn up. These scenarios are based on the reference scenario but are different in a few parameters. Scenario 1 makes use of an average electricity scenario in order to be able to compare with an existing LCA study. Scenario 2 assumes a saturated paper market with the purpose of being able to see the consequences of the use of recycled paper at the model printing company. Both scenarios 3 and 4 cover a sensitivity analysis making use of the observed ranges in the paper and ink consumption respectively. In scenario 5 waste water treatment is included and in scenario 6 the effect of substitution among biocides is shown. Finally scenario 7 deals with the situation where no waste water at all is emitted from the model printing company.
Methodology
The impact assessment used here comprises classification, characterisation, normalisation and weighting. During classification all the emissions mapped in the inventory and related to the functional unit are grouped substance wise and assigned to the relevant impact categories. Later in the characterisation step these values are multiplied by the corresponding characterisation factor (one for each substance emission) and then all these contributions are aggregated into one value called category indicator result within each impact category. Then during normalisation these category indicator results are normalised by dividing each one by the corresponding yearly total impact per world citizen (or country citizen depending on category) leading to a normalised value for each impact category expressed in units of person equivalents. Finally each normalised value is multiplied by a weighting factor which in the EDIP method is determined by political reduction targets (the higher the reduction the higher the weighting factor). For resource consumption something similar is done by dividing the consumption into groups of pure raw material (e.g. copper), normalising by dividing with yearly resource consumption per world citizen and finally weighting by factors based on the reciprocal of the supply horizon so that the weighted result is expressed in units of person-reserves.
For the chemical related impact categories (i.e. chronic human toxicity, chronic ecotoxicity, acute human toxicity, acute ecotoxicity) the chronic ones are aggregated into one category called ‘persistent toxicity’ during the normalisation step leading to only three chemical related impact categories after normalisation. No aggregation has been done for the other impact categories (i.e. the energy related ones) during normalisation. The weighting step makes it possible to aggregate contributions from each impact category into one aggregated value for potential environmental impact expressed in targeted person equivalents (PET) for one functional unit. In the same way the total resource consumption can be aggregated into one value expressed in person-reserves per functional unit.
The chemical related impact categories differ from the energy related ones because a very large number of chemical emissions may contribute to potential toxicological impact. Substances contributing to the energy related impact categories (e.g. global warming, nutrient enrichment and acidification) are limited in number and well-defined, and characterisation factors are already available. However for the chemical related impact categories only characterisation factors for a limited number of contributing emissions are available today.
In this study 33% and 26% of the number of mapped emissions to air are covered by characterisation factors for human toxicity and ecotoxicity respectively. If expressed in quantity (kg) 48% is covered by characterisation factors for human toxicity and 64% for ecotoxicity if the known main non-contributing emissions for ecotoxicity (such as SO2 and calcium) are excluded. The figures for emissions to water are 25% and 37% for the number of emissions covered by characterisation factors for human toxicity and ecotoxicity respectively and if expressed as quantity the figures are 48% for human toxicity and 53% for ecotoxicity when main non-substance specific (e.g. suspended solids and COD) and most probably non-contributing emissions are excluded. However the major part of the specific substances emitted to water for which no characterisation factors exist includes inorganic salts, polymers and acids/bases of the type that are generally assessed to be low in toxicity. It has not proved possible to include a few known substances belonging to groups such as siccatives and softeners which might contribute significantly to the chemical related impact categories. New characterisation factors on ecotoxicity for 11 substances covering pigments, biocides and others have been calculated as part of this study.
Results
The total category indicator results for one functional unit covering the reference scenario are shown in Table 17 (Section 3.3). The main results of analysing the background for these figures show that the energy related impact categories are dominated by contributions from energy production (material stage) especially for paper production but also from energy consumption at the model printing company. For the chemical related impact categories the main contributions come from emissions of solvents used during cleaning and printing at the model printing company (production stage) but also emission during pigment production and emission from energy production (e.g. heavy metals), which both belong to the material stage, do contribute significantly. For resources the major consumptions are of water (used mainly for paper production), of the group of energy carriers comprising natural gas, oil and wood, and of kaolin for production of paper.
By normalising the category indicator results a normalised LCA profile appears (see Figure 2 in Section 3.3.1.1). The dominant impact categories are ecotoxicity (i.e. acute ecotoxicity) and global warming followed by hazardous waste and persistent toxicity. Ecotoxicity accounts for about 400 mPE (milli-person-equivalents) and the main contributing activities are printing (240 mPE) and paper production (80 mPE). For global warming the value is about 240 mPE dominated by contributions from paper production (170 mPE) and energy consumption at the model printing company (60 mPE). Hazardous waste accounts for about 159 mPE and is almost fully dominated by paper production (154 mPE). Persistent toxicity accounts for 142 mPE dominated by cleaning (66 mPE), printing (43 mPE) and paper production (24 mPE). If negative contributions from paper incineration and paper recycling (due to avoidance of burning fossil fuels and avoidance of producing virgin paper) are allocated to paper in the profile (i.e. paper net is used) the contribution from paper to, for example, global warming is reduced from 71% to 43%.
The normalised profile for the non-renewable resources is shown in Figure 4 in Section 3.3.1.2. This profile is heavily dominated by consumption of kaolin (111000 mPE) during paper production (used as filler). However kaolin can easily be substituted by talc and/or chalk leading to a reduction by several orders of magnitude in importance of the filler. The second highest normalised resource consumption is consumption of natural gas, accounting for 1570 mPE dominated by consumption during paper production (967 mPE) and consumption at the model printing company (452 mPE).
The main effects of weighting the normalised profile are that the impact category on ecotoxicity becomes even more dominant than after normalisation and that persistent toxicity is now second most important and global warming is now only the third most important, see Figure 6 in Section 3.3.2.1. By weighting we have the opportunity to aggregate all the environmental impact category results into one common impact score. If we do that and further use the net value for paper, we can express the contribution of the different activities to the total aggregated weighted potential impact (hereafter called “aggregated impact”) in terms percent contribution. The result is that the highest contribution to this weighted profile (see Figure 9 in Section 3.3.2.1) comes from printing (41%) followed by paper net (31%), cleaning (17%), energy consumption at the model printing company (6%), plate making (2%), repro (2%) and finally finishing (0.4%).
After weighting of the resource profile kaolin is still dominant but especially natural gas, oil and uranium have increased importance (see Figure 11 in Section 3.3.2.2). If we exclude kaolin, as we did for normalisation, and use the net value for paper, and further aggregate all weighted resource consumptions and express the result in percentage of the total, we arrive at the profile shown in Figure 16 (Section 3.3.2.2.). In this case the highest share of resource consumption comes from paper net (48%) followed by energy consumption at the model printing company (33%), repro (6%), finishing (4%), printing (4%), cleaning (3%) and plate making (2%).
The result of the comparison between scenario 1 (average electricity scenario) and a previous LCA study of offset printed matter, i.e. a newspaper (cold-set) and a commercial (heat-set) shows that scenario 1 is pretty much at the same level for the energy related impact categories. However the dominant position of the chemical related impact categories in scenario 1 is not at all reflected in the previousstudies due to the fact that only one emission (IPA) is included.
The effect of using recycled paper exclusively (scenario 2) as compared to the use of virgin paper exclusively (reference scenario) is a reduction in the aggregated impact of about 16%.
If the waste paper amount (i.e. paper spillage in production) at the model printing company is reduced from 32% to 3.3% (scenario 3) the reduction in the aggregated impact is about 11%.
Reducing the ink consumption from 26.5 kg/functional unit (fu) to 1.8 kg/fu at the model printing company (scenario 4) leads to a reduction in the aggregated impact of about 56%.
Introducing the use of a waste water treatment plant (WWTP) (scenario 5) for waste water emitted from the model printing company results in a reduction in the aggregated impact of about 26%.
The effect of substituting chemicals at the model printing company is illustrated by substitution among biocides for preservation of rinse water (Scenario 6). Substitution of benzalkonium chloride with Kathon results in a reduction in the aggregated impact of about 21% (WWTP included) or about 69% (WWTP not included).
If no waste water at all is emitted from the model printing company (scenario 7) the reductions in the aggregated impacts are about 30% if compared to the reference scenario with no WWTP or 5% if compared to scenario 5 with WWTP.
Interpretation
In order to investigate the robustness of the reference scenario and the effect on the LCA profile of varying the consumption and emissions at the model printing company within observed ranges (relevant for ecolabelling) sensitivity analyses have been carried out.
The effect of using drafted new normalisation references and weighting factors covering the 15 current EU member states instead of the Danish ones as used in the reference scenario is investigated. The result is that changing to EU-15 values does not change the overall LCA-profile for the reference scenario significantly. So in this regard the weighted reference scenario used in this study is considered as robust and valid on a European scale.
For paper the use of other allocation principles (“cut-off” and quasi-co-product) than the paper gross and paper net used in this study is discussed. It is concluded that due to the dominant use of virgin paper within sheet fed offset the choice of paper net is most relevant for the reference scenario in our case.
In the previous LCA studies of offset printed matter which all only include the chemical related impact categories to a limited degree or not at all the importance of paper in the LCA profiles is at the level of 70 – 80%. In this study paper net accounts for only 31% but if the chemical related impact categories are excluded this figure is raised to 67% which is at the same level as in the previous studies.
One of the known emissions of toxic substances from paper production that it has not been possible to include in this study is AOX (chlorinated organic substances emitted to water). A very roughly estimate indicates that this emission might account for about 3% of the aggregated impact. However it is assessed that taking other emissions from other activities into account that have also not been possible to include (e.g. emission of siccatives at the printing process) the AOX emission will probably not change the overall LCA profile. However this assessment is of course based on existing available knowledge within the scope of this study.
The inclusion of a European paper disposal scenario is investigated. The main issue here is the land filling of paper waste leading to emission of methane that contributes to global warming. However consideration about a higher recycling rate (than average) for high grade graphic paper combined with considerations about oxidation and utilisation of methane leads to the assessment that inclusion of land filling of paper waste does probably not change the LCA profile for sheet fed offset printed matter substantially and that the reference scenario therefore is sufficiently robust to represent the average European situation regarding paper disposal.
The printing process accounts for 41% (production of printing ink included) of the aggregated impact in the reference scenario. Such a high importance is not shown at all in previous LCA studies of offset printed matter which is mainly due to a limited or absence of inclusion of the chemical related impact categories.
The production of printing ink accounts for 17% of the aggregated impact in the reference scenario, mainly due to estimated emissions during pigment production. Even though these estimations (not done as part of this study) are based on risk assessment tools they are assessed to be non-conservative. A short critical review of the estimations has revealed errors that after corrections lead to an increase in the importance of production of printing ink from 17% to 20%. This may point to a higher importance of pigment production.
The very high importance of printing ink consumption is illustrated by estimating the importance for the aggregated impact on basis of the observed range at printing industries, i.e. 1.8 kg/fu – 26.5 kg/fu. The result shows an importance of 23% at the lower range value and 74% for the upper range value. If it is assumed that emissions of printing ink residues at the model printing company are not proportional to the consumption but constant (probably most realistic) the corresponding importance becomes 34% and 63% respectively.
Looking at the emissions of printing ink at the model printing company separately and assuming a variation of a factor 10 (0.3% - 3%) for the 1% emission used in the reference scenario leads to a variation in the importance of 6% for the lower range value and 39% for the upper range value. Again this shows the high importance of printing ink and high sensitivity in the reference scenario to variation in this parameter. Anyway it is assessed that an emission of 1% of the consumption represents emission of ink residues for a generic sheet fed offset LCA fairly accurately.
The contribution from emission of IPA to the aggregated impact in the reference scenario is 6%. Variation in the emitted amount according to the observed range of consumption at the printing companies (0.0785 kg/fu – 10.4 kg/fu) leads to 0.1% contribution for the lower range value and 7% for the upper range value.
In the reference scenario, cleaning is the third most important activity, accounting for 17% of the aggregated impact. Full substitution of aliphatic based cleaning agents with vegetable oil based ones may reduce the contribution to about 0.8% whereas full substitution of cleaning agents (except surfactants) with light aliphatic types may increase the contribution to 27%.
The 2% contribution to the aggregated impact from the repro process at the model printing company is mainly due to emission of hydroquinone (1.4%) and to lesser degree biocides (0.25%). Emissions not covered are assessed as being insignificant.
For plate making the 2.4% contribution to the aggregated impact is especially due to biocide emissions (1.7%) whereas the use of aluminium plates only contributes 0.24%. If it assumed that the model printing company uses aluminium plates based on virgin aluminium exclusively, the importance of plate making increases to 3.7% and that of aluminium to 1.5% (full allocation of the potential impact to the functional unit).
The finishing activity at the model printing company only contributes 0.43% to the aggregated impact. Processes like laminating which are included in the existing Swan ecolabelling criteria are excluded here because they normally do not take place at the printing company but at special companies (e.g. book binders). Even though inclusion of these processes might increase the importance of finishing it is assessed that the overall LCA profile for sheet fed offset printed matter will not change substantially.
As described earlier, transport has not been included as a separate activity in this generic LCA study. However based on relevant existing studies it is assessed that transport accounts for around 5% of the aggregated impact covering the whole life cycle of the generic sheet fed offset printed matter.
Especially due to lack of data, waste, i.e. nuclear waste, chemical waste, bulk waste, and slag and ashes are only treated as total amounts (kg, not differentiated by characterisation factors) in this study. However for example chemical waste from the printing company and de-inking sludge (recycling of paper) might contribute significantly to the aggregated impact of the functional unit. Furthermore, the waste treatment processes should be included in an LCA study.
Conclusion
The goal of this study is to identify the distribution of potential environmental impacts and consumption of resources during the life cycle of generic printed matter produced on a model sheet feed offset printing company. This distribution is represented by LCA-profiles on overall results in Figures below. These results are based on average consumptions and emissions from primarily Scandinavian sheet fed offset printing companies but are assessed as being fairly representative for average modern technology in Europe. The functional unit (fu) is one ton of printed matter.
The contributions in the Figures below are divided into the activities at the model printing company. However paper is isolated because all previous studies focusing on energy related impact categories point to paper as the overall dominating factor, which is not the result of this study including the chemical related impact categories as shown in the Figures.
For the potential environmental impacts printing is dominant with a contribution of 41% (18% ink emission at the model printing company and 17% from emissions of synthesis chemicals at upstream pigment production) to the aggregated impact. Paper contributes 31% mainly due to emissions related to energy consumption.
For the aggregated weighted resource profile paper (48%) and energy consumption at the model printing company (33%) are dominant mainly due to consumption of energy carriers (natural gas and oil).
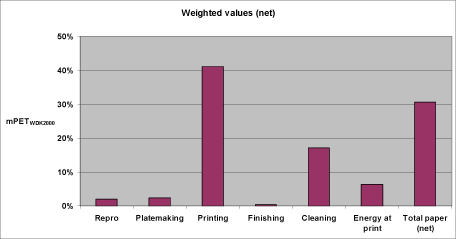
Aggregated impact profile for the reference scenario in relative figures and with total paper as net value.
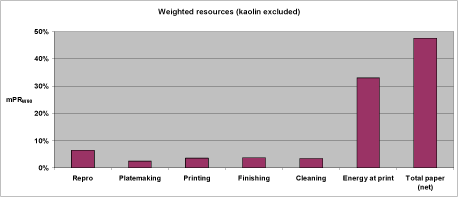
Aggregated weighted resource profile for the reference scenario in relative figures and with total paper as net value and kaolin excluded.
On the basis of a sensitivity analysis including European normalisation references, weighting factors and disposal scenarios, it is concluded that the results of this LCA study are valuable for both ecolabelling of offset printed matter (especially sheet fed) on a Nordic scale (Swan labelling) and a European scale (Flower labelling).
Furthermore, on the basis of the alternative scenarios and sensitivity analysis carried out it is concluded that the strength of the LCA approach used here on ecolabelling of printed matter is not only the exact LCA profile of the reference scenario based upon average values but to a high degree the possibilities of using sensitivity analysis based upon known or theoretical ranges within values of consumption, emissions or other parameters. By conducting a sensitivity analysis we arrive at an indication of how sensitive the distribution of the potential impact within the life cycle of the printed matter is to variation in the parameter in question and thereby can find guidance in how much weight to put on the parameter in the development of ecolabelling criteria. Furthermore this LCA approach is valuable when dealing with substitution.
The main issues that it has not been possible to include fully in this study and that might change the outcome significantly include upstream emissions (e.g. production of ink components), methane emission from land filling of paper and the fate of chemical waste (e.g. from printing company).
Research in these areas is needed if the reliability of the LCA on printed matter is to be further strengthened and thus improve the foundation for life cycle based ecolabelling criteria on printed matter.
Version 1.0 August 2006, © Danish Environmental Protection Agency