Health effects of predatory beneficial mites and wasps in greenhouses
5 Analyses of specific IgE
- 5.1 Screening for IgE
- 5.2 Material and methods
- 5.3 Reanalyses of the positive screening values for all the measurements
- 5.4 Statistical analysis
- 5.5 Results
- 5.6 Discussion
- 5.7 Conclusions
5.1 Screening for IgE
In order to test whether an IgE response to the different species could be detected, a screening was done on the samples from run 2 and run 3.
5.2 Material and methods
Allergen preparations of the following species were made;
Tetranychus urticae, Phytoseiulus persimilis, Hypoaspis miles, Amblyseius cucumeris, and Aphidius colemani. The invertebrates used for the analyses were purchased from Koppert BV, The Netherlands.
The detailed description of the methods of producing extracts and analysis of the specific IgE can be read in Appendix 1.
The results of the IgEs were presented in units of OD (Opticl densities) as there was no possibility for standardizing the values according to the normally used IUs (International units).
5.3 Reanalyses of the positive screening values for all the measurements
For all persons with positive IgE in either run 2 or run 3 all the samples from the person were analysed including reanalysis of the previously analysed. For datails see Appendix 1.
5.4 Statistical analysis
For each of the beneficial species (A. colemani, A. cucumeris, P. persimilis, and H. miles) the distributions of IgE values were graphically inspected. They were separated in groups according to the individual exposure in the actual run (no exposure, exposure in the greenhouse and handling predators themselves (“Applying”)) (see chapter 4). Differences were tested by a Kruskal-Wallis non-parametric analysis of variance.
Additionally a logistic regression analysis was made on IgE values dichotomized at the chosen detection value, 0.05 OD including the personal characteristics sex, seniority, and atopy, based on either information about atopic disease in the family or one or more positive reactions to the standard prick test at the entrance into the study. Besides, the total IgE measured in run 0 and run 1 was included (logarithmically transformed).
For the reanalyses a cross sectional time series analysis on negative binomial distribution was carried out.
5.5 Results
The values of IgE in response to the five species are shown in the figures 5.1 to 5.5. Each figure shows the distribution of the 680 values from run 2 and run 3. Each curve shows the distribution of subjects not exposed to the animal within the last year, exposed in greenhouse within the last year, and applying the beneficials more than once within the last year, respectively.
For T. urticae no exposure estimates were available. Therefore the curves were separated by the personal value atopy defined as one or more positive prick tests.
Table 5-1 shows the number of persons with positive IgE defined by a cut-off of 0.05 OD units (see Appendix 1) in run 2 and run 3. The numbers of positive values for A. cucumeris were 8.7 % and 4.3 %, for P. persimilis 2.6 % and 3.0 % and for H. miles 2.9 % and 2.6 %. The detailed values are described for each specimen in the following chapters 5.3.1 through 5.3.5.
Table 5-2 shows the odds ratios and confidence intervals of the logistic regression analysis for the five species. In this analysis the IgE values were dichotomized with a threshold value of 0.05 OD as proposed in Appendix A.
| Run 2 | Run 3 | ||||||
| No exposure | Exposed in greenhouse | Applying | No exposure | Exposed in greenhouse | Applying | ||
| Aphidius colemani | |||||||
| < 0.05 OD | 112 | 205 | 20 | 98 | 197 | 9 | |
| = 0.05 OD | 6 (5.4 %) | 7 (3.4 %) | 1 (5 %) | 3 (3.1 %) | 7 (3.6 %) | 0 (0 %) | |
| Amblyseius cucumeris | |||||||
| < 0.05 OD | 81 | 213 | 29 | 70 | 208 | 23 | |
| = 0.05 OD | 7 (8.6 %) | 19 (8.9 %) | 2 (6.9 %) | 3 (4.3 %) | 8 (3.8 %) | 2 (8.7 %) | |
| Phytoseiulus persimilis | |||||||
| < 0.05 OD | 214 | 116 | 12 | 195 | 103 | 7 | |
| = 0.05 OD | 6 (2.8 %) | 3 (2.6 %) | 0 (0 %) | 4 (2.1 %) | 5 (4.9 %) | 0 (0 %) | |
| Hypoaspis miles | |||||||
| < 0.05 OD | 161 | 164 | 16 | 138 | 150 | 18 | |
| = 0.05 OD | 4 (2.5 %) | 6 (3.7 %) | 0 (0 %) | 5 (3.6 %) | 3 (2 %) | 0 (0 %) | |
Table 5-1. The distribution of the IgEs against the four predatory species in the exposure groups in run 2 and run 3, respectively.
| Odds ratio | CI95% | Odds ratio | CI95% | |
| Aphidius colemani | ||||
| In greenhouse | 1.38 | (0.30-6.32) | 1.25 | (0.31-4.98) |
| Applying | *) | |||
| Positive prick test | 0.92 | (0.22-3.97) | 4.40 | (1.23-15.68) |
| Total IgE | 3.35 | (1.87-6.01) | ||
| Amblyseius cucumeris | ||||
| In greenhouse | 0.59 | (0.17-2.05) | 0.62 | (0.18-2.12) |
| Applying | 1.40 | (0.23-8.33) | 1.38 | (0.24-8.1) |
| Positive prick test | 1.27 | (0.35-4.63) | 2.46 | (0.79-7.62) |
| Total IgE | 1.54 | (1.02-2.31) | ||
| Phytoseiulus persimilis | ||||
| In greenhouse | 2.19 | (0.57-8.49) | 2.36 | (0.62-8.99) |
| Applying | *) | |||
| Positive prick test | 0.24 | (0.03-2.24) | 0.54 | (0.07-4.38) |
| Total IgE | 1.65 | (1.03-2.64) | ||
| Hypoaspis miles | ||||
| In greenhouse | 0.53 | (0.12-2.26) | 0.53 | (0.12-2.27) |
| Applying | *) | |||
| Positive prick test | 1.71 | (0.28-10.5) | 1.57 | (0.31-8.01) |
| Total IgE | 0.94 | (0.54-1.63) | ||
| Tetranychus urticae | ||||
| Sex (male>female) | 0.23 | (0.06-0.94) | 0.32 | (0.09-1.18) |
| Positive prick test | 0.36 | (0.07-1.82) | 1.58 | (0.39-6.34) |
| Total IgE | 2.70 | (1.59-4.58) |
Table 5-2. Logistic regression of the IgE of the five different specimens. The threshold of positive values is 0.05 OD. (run 2 and run 3 together n=629) The left column shows the odds ratios including total IgE in the model, the right column without total IgE.
* means that the model predicts perfect failure (no difference from non-exposed) and the observations are not included.
Significant effects (p<0.05) are shown in bold.
5.5.1 Aphidius colemani
The rate of sensitization of A. colemani was 4.2 % and 3.3 % in run 2 and run 3, respectively. Figure 5.1 shows the distribution of the actual values. There was no difference between the different exposure schemes, but those applying tended to have lower values than the others.
The IgEs were correlated with atopy (one or more positive prick tests) and total IgE. Significant correlations between IgE of A. colemani and prick test responses to birch, the two house dust mites, and Alternaria were shown. On the other hand there was a relatively low correlation with the IgEs against the mites. This was in agreement with the lack of inhibition by the mite antigens (see Appendix 1).
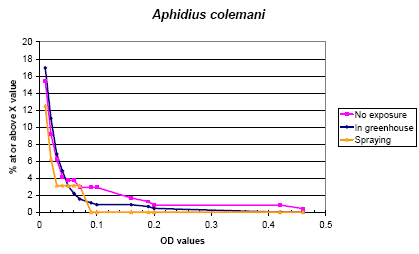
Figure 5.1. The cumulative distribution of IgE values against Aphidius colemani according to the exposure groups.
5.5.2 Amblyseius cucumeris
The rate of sensitization was 8.6 % and 4.3 % in run 2 and run 3, respectively. There was a tendency to a higher rate in the two groups of exposure (Mann-Whitney p= 0.07) although those with the possibly highest exposure had lower values than the others. The difference was mainly seen in a limited number of high levels, which might be indicative of a higher rate of sensitization. In the logistic regression no effect was seen on the dichotomized data.
The IgE of A. cucumeris correlated with the other mites and the prick tests for both house dust mites, while the cross inhibition analyses (Appendix 1) showed only partial cross inhibition from house dust mites, but not from any of the other mites.
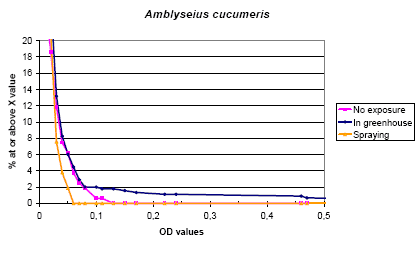
Figure 5.2. The cumulative distribution of IgE values against Amblyseius cucumeris according to the exposure groups.
5.5.3 Phytoseiulus persimilis
The prevalence rate of IgE values over the chosen limit (0.05 OD) was 2.5 % and 2.9 % in run 2 and run 3, while no relation to the exposure was seen. Generally the IgE values were lower than those of A. cucumeris. P. persimilis and T. urticae showed a high correlation and the cross inhibition experiments showed a considerable mutual cross inhibition while the inhibition from A. cucumeris was moderate.
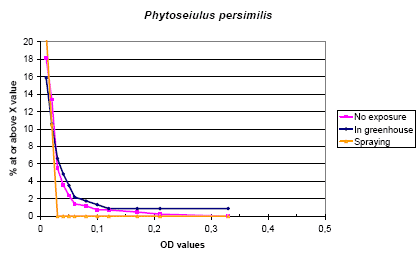
Figure 5.3. The cumulative distribution of IgE values against Phytoseiulus persimilis according to the exposure groups.
5.5.4 Hypoaspis miles
The IgEs of H. miles showed low values with 2.8 % and 2.5 % above 0.05 OD, only a single value was above 0.1 OD. In the cross inhibition study this did -not show any inhibition indicating this being caused by a non specific reaction.
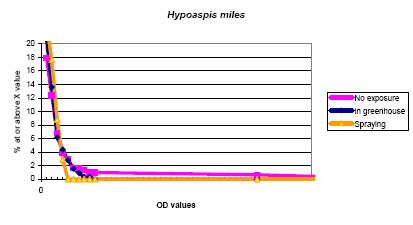
Figure 5.4. The cumulative distribution of IgE values against Hypoaspis miles according to the exposure groups.
5.5.5 Tetranychus urticae
This naturally occurring mite showed higher values than the beneficial mites and there was a clear difference related to atopy, probably primarily correlated with allergy to house dust mites (see fig 5-6). The inhibition experiments showed a clear inhibition from the mite itself and a less abundant inhibition from P. persimilis. Curiously the relation with atopy was only seen in run 2 while only 3 out of 68 atopics had positive values compared with 10 out of 74 in run 2.
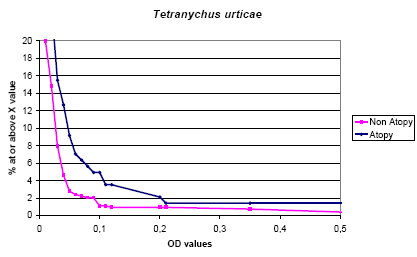
Figure 5.5. The cumulative distribution of IgE values against Tetranychus urticae according to status of the prick test (Atopy ~ 1+ positive test).
5.5.6 Correlation between the different IgEs
| ige_A. colemani | ige_A. cucumeris | ige_P. persimilis | ige_H. miles | |
| ige_A. cucumeris | 0.2373 | |||
| ige_P. persimilis | 0.1913 | 0.3265 | ||
| ige_H. miles | 0.2084 | 0.2181 | 0.1633 | |
| ige_T. urticae | 0.1843 | 0.1968 | 0.3749 | 0.1020 |
Table 5-3. The Spearman non-parametric correlation between the values of the five different IgEs in the last sample of each person (n=369). All correlations are significantly different from 0 (p<0.001).
Previous studies have indicated cross allergy between the different mites and house dust mites (Dermatophagoides).Therefore a correlation analysis was made between the results of the prick tests made at the persons first examination 1 to 3 years before the measurements of the IgEs.
Figure 5.6 shows the correlation coefficients between the five IgEs and the prick tests against the two house dust mites, birch and Alternaria. There were no coefficients above 0.10 with any of the other 7 prick tests (grass, mug worth, horse, dog, cat, Cladosporium, and Trichoderma).
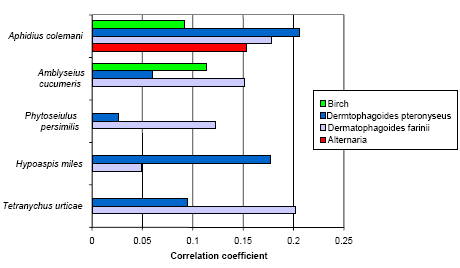
Figure 5.6. The Pearson correlation coefficients between selected prick tests made at the start of the study and the IgE dichotomized at 0.05 OD. n=363 and correlation coefficients above 0.10 are significant (p<0.01).
5.5.7 Correlation between the IgEs in the follow-up
The results showed a close correlation between the consecutive samples and there were only slight signs of change in sensitization following exposure. The change in the indivual measurements is shown in Appendix 1, chapter 1.
5.6 Discussion
The IgEs were analysed using extracts made from the whole animal as there was no previous standard of extracts and the antigens are not well defined. This may lead to a lot of unspecific effects and a considerable effort was needed to get a stable and low background. This may in part be the cause of the relatively low values measured. On the other hand the sensitization rate did not differ from those measured against A. cucumeris in the Dutch study (Groenewoud et al., 2002a). A strong correlation between the individual values in the two runs may support that the measured values represent a true biological sensitization.
The very limited correlation with the indicators of exposure may have different causes. Firstly, the exposure estimates were crude based on information on the use anywhere in the greenhouse. More refined information would be preferable but due to the use of historic data this could not be revealed. The greenhouse workers may previously have worked with beneficial species which had been introduced in larger scale from the late 1970´s. There may be an exposure in the other greenhouses or cross reaction with other unknown allergens. A study of persons without relation to greenhouse work can give a background level of the sensitization.
On the other hand none of those having reported to be in direct contact with the beneficial arthropods in the previous year and thereby the highest and best documented exposure, had high values of IgE. This low sensitization rate in handlers of beneficials might be caused by selection as those who has been sensitized stop applying or leave the job (healthy worker selection). The atopics being more sensitive and having more work related respiratory symptoms would then be a risk group. However, there was no indication of fewer atopics among handlers than among non-handlers.
Comparing the IgEs against the four different beneficial species showed some differences. The IgE against the parasitoid A. colemani seemed to be clearly different from the others; the levels were comparable with those of the mites. No previous information on the sensitization is available, why a further study of this specie is warranted.
A. cucumeris had the highest frequency of use; about 75 % of the persons were exposed. Some indications of an exposure relationship were seen although weak. In the Dutch study both sensitization and nasal reactions were seen, although the exposure estimates were very crude and all persons were exposed to bell pepper pollen as well (Groenewoud et al., 2002b; Groenewoud et al., 2002a). We have in our clinic seen a patient with a clear reaction to A. cucumeris followed by a very strong prick test reaction and histamine release. This mite therefore needs a further investigation of its health effects.
P. persimilis has in the Swedish study shown health effects comparable with those of A. cucumeris. In our study the IgEs against P. persimilis were clearly lower than that of A. cucumeris and there was a considerable influence of T. urticae. This may be due to a cross sensitization but T. urticae is used for prey in the production of P. persimilis, and there may therefore be a contamination of P. persimilis with T. urticae protein in our preparations. To avoid this P. persimilis fed on another diet is needed for the analyses.
The IgE against H. miles seems to be less stable than the others. Only little information of the health effects of this mite is available as the persons showing sensitization in the Swedish study were also sensitized to P. persimilis (Kronqvist et al., 2005).
Looking at the time course the positive values were stable over time, and there was a satisfactory analytical stability when the concentration was high enough. On the other hand the IgEs did only show limited information about the development of sensitization.
5.7 Conclusions
The IgEs against the beneficials all showed some positive values although with relatively weak relations to relevant exposure or personal characteristics. The parasitoid, Aphidius colemani and the mite Amblyseius cucumeris seem to be the best candidates for a further analysis, but the differences between the four species were limited and can not exclude any of the others.
As expected the naturally occurring mite Tetranychus urticae had an influence and needs to be taken into account. It is a well known allergen, but the actual study does not permit any estimate of individual exposure.
Version 1.0 August 2007, © Danish Environmental Protection Agency