Health effects of predatory beneficial mites and wasps in greenhouses
6 Histamine release tests
6.1 Background
As an alternative to IgE against the predators it is possible to measure histamine release from IgE-sensitized basophiles circulating in the patient’s blood. Two types of histamine release tests can be applied: 1) direct histamine release using fresh peripheral blood from the study subjects or 2) by passive sensitization of stripped basophiles using serum from the study subjects.
For practical and logistic reasons it was not possible to obtain fresh anticoagulated blood from the persons included in the study, and it was therefore decided to use the second type of histamine release (serum sensitization of stripped basophiles). In contrast to specific IgE determinations, histamine release from sensitized basophiles indicates the biological significance of the allergen specific reaction.
6.2 Material and methods
From the results in chapter 5, screening of IgE, a number of species were selected for further analysis.
Due to the very weak correlation with the measures of exposure on one hand and spurious correlations with the concomitant occurrence of symptoms there was no obvious candidate for the selection of persons for the second analysis. On the other hand there was a significant correlation between the two samples from the individual person and some cross reactivity between the mites, but not with the parasitoid Aphidius colemani. From the inhibition experiments IgE of A. colemani, Phytoseiulus persimilis, and Amblyseius cucumeris seem to be the most specific, while Hypoaspis miles seems to be more unspecific.
In the following investigations A. colemani, A. cucumeris and P. persimilis were chosen for investigation.
6.2.1 Selection of persons for analysis
Persons with at least 1 positive IgE (>=0.05 OD) towards A. colemani, A. cucumeris, P. persimilis, or H. miles were chosen (71 persons).
In order to get a contrast, controls were chosen as those having values below 0.025 OD in any of the IgE in any of the samples.
A match on atopy status (positive prick test), sex, smoking habits (smoker/non smoker), and age was made. Matching was carried out by sorting all the eligible persons according to the above mentioned criteria. The controls were then those just after the persons with positive values (n=37).
Hereafter only persons with three or four samples were chosen (70 positive and 30 controls) providing 261 and 119 samples, respectively, in total 380 samples.
The other group was 138 valid samples from the 149 participants from Funen in the population based RAV-study in the period September 2003 to February 2004 (see paragraph 3.4).
The persons in this group with job title or trade related to agriculture or horticulture (6 persons) or who in the questionnaire had mentioned that they had left any of these trades due to respiratory complaints (4 persons) were included, but marked in order to be excluded from some of the analyses.
| Group | No. persons | No. samples |
| 1+positive IgE | 70 | 261 |
| Controls | 30 | 119 |
| Population sample | 138 | 138 |
Table 6-1. The number of samples selected for further analysis of Histamine release and specific IgE.
6.2.2 Analytical methods
The passive sensitization method is based on the use of buffy coat from the blood bank (donor cells) where stripped basophiles in the cell suspension are passively sensitized with sera from study subjects. The passively sensitized cells are then incubated with allergen (i.e. extracts of predators) in different concentrations. To determine the presence of biologically active IgE in the serum samples, histamine release is measured.
In brief, buffy coat blood samples used for the sensitization were screened and selected for the capability to elicit an anti-IgE response (histamine release (HR) > 30 %) and with no histamine release reactivity towards 10 common inhalant allergens, 10 food allergens and the allergen with the unknown biological activity.
Sensitization of stripped basophiles is performed as described earlier (Dirks et al., 2005). In brief, peripheral blood monocytes (PBMC’s) from the selected buffy coat were isolated by Lymphoprep gradient centrifugation and contained 1-2 % basophiles. Cell bound IgE was removed by washing the PBMC’s in a phosphate buffer (pH 3.55). Stripped basophiles were then sensitized with sera from allergen sensitized patients and serum from a healthy non-allergic control, respectively.
The passively sensitized cells were then incubated with extracts of A. cucumeris, P. persimilis, A. colemani, and a mixture of the growth substrates for the predators. Extracts were tested in six concentrations (from 1:100 to 1:50.000, dilution factor 3.5) and histamine release was determined by the glass fibre method (HR-Test, RefLab, Denmark) according to the manufacturer’s standard procedure, and described in (Untersmayr et al., 2005). Results are expressed in percentage of total cellular histamine content, and a HR > 10 % is considered a positive response.
The histamine release responses were classified according to the highest sample dilution inducing > 10 % histamine release. This classification implies that cells responding to the lowest concentration will be a class 6 reaction and cells only responding to the highest concentration will be a class 1 reaction. No reaction to any of the dilutions is a class 0 reaction. It should be noted that extracts of predators in concentrations above 1:100 induced unspecific histamine release in healthy controls and these concentrations were therefore omitted.
6.2.3 Statistical methods
Due to the skew distribution and a variance larger than the mean a negative binomial distribution is suggested. The values were then tested with a regression analysis (prevalence data) and a cross sectional time series analysis (change in HR titres). As independent variables, besides the exposure status, sex, actual smoking habit and atopy (positive standard prick test) were chosen. The correlations between IgE and HR were tested using a non-parametric correlation analysis (Spearman).
6.3 Results
6.3.1 Persons without exposure to greenhouses
The histamine release test was obtained from 138 persons, 72 females and 66 males aged between 20 and 44 (average 34.3) years. The prick test results are shown in figure 6.1. 44 persons (32 %) had at least one positive prick test. Of the 12 persons with work in agriculture or gardening one person had one positive prick test while one had three.
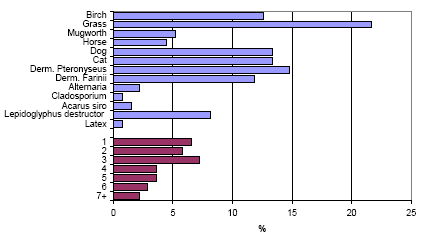
Figure 6.1. The number of positive prick tests (veal =3 mm) in the group of persons from the population sample (n=138). The upper part shows the frequency of sensitization against the different tests, while the lower part shows the distribution of number of positive tests.
The frequency of the positive titres of A. cucumeris, P. persimilis, and A. colemani according to positive prick tests (atopic), is shown in figure 6.2.
The figure shows a relatively high frequency of positive titres, for A. cucumeris higher in atopics than in non-atopics, a difference not seen in the other species. The correlations between the titres against any of the beneficial arthropods on one hand and positive reactions against storage mites Acarus siro and Lepidoglyphus destructor or against other prick test reactions were all negative.
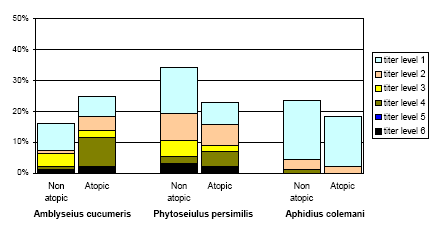
Figure 6.2. The frequency of positive titres against the three beneficial species (n=138) in persons with and without at least one positive prick test.
Among the twelve persons with relation to agriculture or gardening two non-atopics showed reaction to all three beneficial species.
6.3.2 Greenhouse workers
6.3.2.1 Amblyseius cucumeris
The frequency of titres of the HR measurements in each run for those not exposed the previous year and those exposed in greenhouse or applying themselves, are shown in figure 6.3.
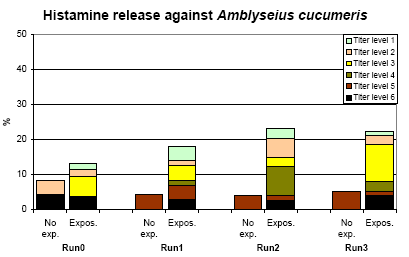
Figure 6.3. The frequency of titres (3.5 fold) of histamine reaction against A. cucumeris. No exp. = not using A. cucumeris in the previous year. Expos. = A. cucumeris used in the greenhouse or applied by the person.
There was a clear significant (p=0.002) difference between exposed and non-exposed persons in the titre levels of A. cucumeris. However, those having applied A. cucumeris during the previous year did not differ from the rest of the exposed persons.
The increase in HR titres was related to the exposure in greenhouse, although not significant (p=0.20). Restricting the analyses to those with a high validity of exposure characterization did not alter the results.
The positive titres were characteristically concentrated on relatively few persons (22 %) but they had in average relative high titres and titres within each person were closely related. As seen in Table 6-2 a set of significant increases in titres (increase >= 2 levels) were seen in 8 persons.
Persons with at least one positive standard prick test had higher titres than those with no positive prick tests, while the 8 episodes with significant increase in titres were seen in mostly non atopics.
The prevalence rates shown are biased estimates as the persons were selected by having a positive IgE. Minimal rates could be estimated by proposing that those not tested were negative thereby giving rates of A. cucumeris of 1.4 % and 6.0 %, P. persimilis of 9.5 % and 10.1 %, and A. colemani of 8.9 % and 7.7 %, for non-exposed and exposed persons in the last run, respectively. In comparison with the only other studies the rates are somewhat lower.
The time course of the sensitization to A. cucumeris was clear. The rates increased and a number of individuals showed rise in titre of more than two steps. Eight persons showed this by giving a sensitization rate of 8/1050 person years = 7.6 *10-3 (CI95%: 2.3 – 12.9*10-3 ).
| Subject | sex | Positive prick test | Exposure to A. cucumeris | Histamine release titre | ||||||
| Run0 | Run1 | Run2 | Run3 | Run0 | Run1 | Run2 | Run3 | |||
| 1 | f | yes | 2 | 1 | 1 | 1 | 2 | 3 | 2 | 2 |
| 2 | m | no | 1 | 1 | 1 | 1 | 0 | 0 | 4 | 4 |
| 3 | f | no | 1 | 1 | 1 | 1 | 3 | 5 | 4 | 4 |
| 4 | f | yes | 1 | 1 | 1 | 1 | 3 | 3 | 2 | 2 |
| 5 | f | yes | 0 | 0 | 0 | 0 | 6 | 5 | 5 | 5 |
| 6 | m | yes | 1 | 1 | 1 | 1 | 0 | 1 | 3 | 3 |
| 7 | m | no | 1 | 1 | 1 | 1 | 3 | 6 | 4 | 3 |
| 8 | m | no | 0 | 2 | 2 | 2 | 2 | 3 | 2 | 3 |
| 9 | f | yes | 1 | 1 | 1 | 1 | 6 | 6 | 6 | 6 |
| 10 | f | no | 1 | 2 | 2 | 2 | 1 | 1 | 2 | 3 |
| 11 | f | yes | 1 | 1 | 1 | 1 | 0 | 1 | 0 | . |
| 12 | f | no | 1 | 1 | 1 | 1 | 6 | 5 | 6 | 6 |
| 13 | f | yes | . | 1 | 1 | 1 | . | 4 | 3 | 3 |
| 14 | m | yes | . | 1 | 1 | 1 | . | 5 | 4 | 3 |
| 15 | f | yes | . | 1 | 1 | 1 | . | 0 | 4 | . |
| 16 | m | yes | . | 1 | 1 | 1 | . | 2 | 1 | 3 |
| 17 | m | no | . | 1 | 1 | 1 | . | 0 | 1 | 3 |
| 18 | f | no | . | 1 | 0 | . | . | 0 | 0 | 1 |
| 19 | f | yes | . | 1 | 1 | 1 | . | . | 5 | 5 |
| 20 | m | yes | . | 1 | 1 | . | . | . | 4 | 6 |
Table 6-2. Individual histamine release results of persons with at least 1 positive titer (20 persons out of 95 included). Bold numbers denote an at least two-step increase in titre from one observation to the next. Exposure - non-exposed, 1 - exposed in greenhouse, 2 - applying.
6.3.2.2 Phytoseiulus persimilis
The titre of HR tests against P. persimilis is shown in Figure 6.4. In comparison with A. cucumeris the frequency of positive titres was higher but the average titre lower and less consistent for the individual person. The relation to exposure was significant (p=0.001). Besides, the rate of sensitization was related to exposure (p=0.045). Very few persons were applying and this group did not differ from the rest.
The titres were slightly, but significantly higher in atopics, while no other significant relation with personal factors was seen.
Presuming that those not tested were negative, the minimal prevalence rates were P. persimilis of 9.5 % and 10.1 % for non-exposed and exposed persons in the last run, respectively.
Seven persons had a more than 2 step increase in P. persimilis giving a rate of sensitization of 6.7 *10-3 (CI95%: 1.7 – 11.6*10-3 ).
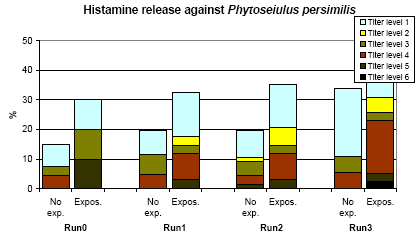
Figure 6.4. The frequency of titres (3.5 fold) of histamine reaction against Phytoseiulus persimilis. No exp. = not using P. persimilis in the previous year. Expos. = Amblyseius cucumeris used in the greenhouse or applied by the person.
6.3.2.3 Aphidius colemani
The distribution of the positive HR tests is shown in Figure 6.5. In comparison with the two mites, A. cucumeris and P. persimilis the titres were lower and no relation to the exposure variables was seen neither in the level (p=0.36) nor the rate of sensitization (p=0.54). Atopics had lower HR titres against A. colemani than non-atopics (p=0.002).
The prevalence rates were 8.9 % and 7.7 %, for non-exposed and exposed persons in the last run, while the incidence rate was 4.8*10-3 (CI95%: 0.6 – 8.9*10-3).
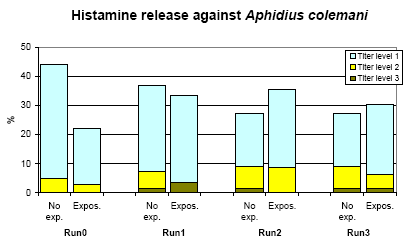
Figure 6.5. The frequency of titres (3.5 fold) of histamine reaction against Aphidius colemani. No exp. = not using Phytoseiulus persimilis in the previous year. Expos. = A. colemani used in the greenhouse or applied by the person.
6.3.3 Correlation between histamine release and specific IgE
Figure 6.6 shows the relation between Histamine release and IgE against A. cucumeris in the 218 measurements where both were analysed. As also shown by the statistical analysis a significant increase in IgE was only seen in those with the high titre in HR.
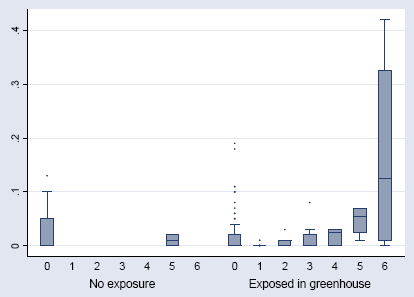
Figure 6.6. The IgE against Amblyseius cucumeris in relation to the HR titres. The median, interquartile range (box), 1.5 time the interquartil range (whiskers), and outliers (points).
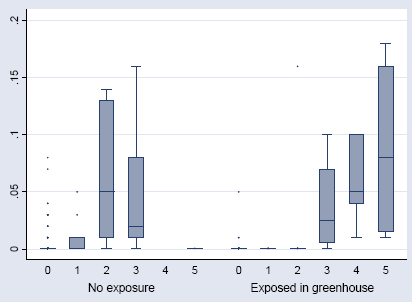
Figure 6.7. The IgE against Phytoseiulus persimilis in relation to the HR titres. The median, interquartile range (box), 1.5 time the interquartile range (whiskers), and outliers (points).
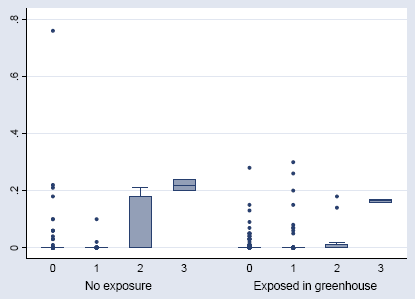
Figure 6.8. The IgE against Aphidius colemani in relation to the HR titres. The median, interquartile range (box), 1.5 time the interquartil range (whiskers), and outliers (points).
6.4 Discussion
Despite using the same extracts for analysis, the HR tests seem to be more discriminating between exposed and non-exposed persons than specific IgE. At least the reactions against the mites A. cucumeris and P. persimilis showed a significant relation to the exposure estimates, both in the cross section and the time course.
The prevalence rates shown are high estimates as the persons were selected by having a positive IgE. Minimal rates could be estimated by proposing that those not tested were negative thereby giving rates of A. cucumeris of 1.4 % and 6.0 %, P. persimilis of 9.5 % and 10.1 %, and A. colemani of 8.9 % and 7.7 %, for non-exposed and exposed persons in the last run. In comparison with other studies the rates are somewhat lower. This may depend on the actual exposure and the fact that sensitization in the Dutch study was based on prick tests (Groenewoud et al., 2002a).
There was a considerable difference between the distributions of sensitization against the two mites. The positive HR against A. cucumeris was restricted to relatively few persons who almost exclusively had been exposed while P. persimilis showed higher rates, still with a clear exposure relation, but distributed with more varied levels. This may imply a difference in specificity between the two measurements. On the other hand, in the population sample relatively high sensitization rates were seen for both mites, higher than in the non-exposed greenhouse workers. The reason for this was unclear, a relation to atopy was as would be expected, but this could not explain the difference. The only difference in preparation was that the population sample was based on plasma while the other was serum.
Sensitization against A. colemani seems to be less pronounced as the levels were lower and no relation to exposure was seen. This can be due to a number of reasons, the most probable is that the sensitization is unspecific against various insects and the actual exposure to this group was insignificant. A testing of persons with a higher exposure, i.e. in the production of the species may reveal a possible effect. In the actual study the sensitization seems to be a minor problem.
The time course of the sensitization to both A. cucumeris and P. persimilis was clear, the rates increased and a number of individuals showed a rise in titre of more than two steps. Eight persons showed this giving a sensitization rate of about 0.7 % for both A. cucumeris and P. persimilis. These rates are surprisingly high, because the persons at the start of the study had been exposed for several years. They may therefore have been sensitized already or been selected due to healthy worker effect as their sensitized colleagues have left the trade.
In comparison with the measurements of IgE the histamine release seem to be more sensitive as the exposure relationship was much clearer and the correlation between IgE and HR showed that IgEs were only increased at the two highest levels of HR against A. cucumeris and P. persimilis. Besides, it was shown that the IgEs did not show any significant changes in the persons over time.
The extracts used in the analyses of HR and IgE were the same, so the mechanism in the sensitization may imply more significant factors than the actual level of specific IgE.
6.5 Conclusions
In conclusion histamine release reaction against the mites A. cucumeris and P. persimilis seem to be valid measures of sensitization against the mites. An improvement of the technology, mainly by a better characterization of the antigens in the extracts, may increase the sensitivity and specificity.
Version 1.0 August 2007, © Danish Environmental Protection Agency