|
Vandforbrug og forbrugsvariationer Summary and Conclusions
0.1 Background and ObjectivesThis report presents results from a project which comprises two subprojects:
The two subprojects are presented separately in two main chapters. Water Consumption and Consumption Fluctuations IDA's (Danish Society of Engineers in Denmark) Standard for "Public Water Supplies", DS 442 from 1988, describes guidelines for design of potable water pipelines. Since 1988, a significant drop in water consumption has taken place within all consumer categories in Denmark. Moreover, the present Standard does not take into account that fluctuation of consumption for different consumer categories differs. Use of the existing Standard could result in design of too large pipelines with a risk of unacceptable water quality due to longer retention time in distribution networks. For these reasons, DEPA (Danish Environmental Protection Agency) wants to revise the present Standard. The objective is to obtain basic knowledge for a revision of water flow used for design of potable water pipelines. In addition, the validity of the present Standard's reference to another Standard, when numbers of downstream households are less than 200, is to be assessed. Retention Time of Potable Water in Blocks of Flats Departmental Order on Water Quality and Supervision of Waterworks – no. 871 of 21st September 2001 – states under "Quality Requirements for Content of Inorganics in Samples Taken at Consumer taps" that DEPA will specify method to be used. With long retention time in water installations, some metals including cobber and nickel, will be released to water in concentrations exceeding permit limits. Particularly for blocks of flats with long installation pipes, problems could occur. For these reasons, DEPA wants to put light on cold potable water's critical retention time in the water installations of blocks of flats. The objective is to develop a model for assessment of the critical retention times of cold potable water in the water installations of blocks of flats. Furthermore, critical retention times should be calculated by use of the model. 0.2 Water Consumption and Consumption Fluctuations0.2.1 ApproachBased on main and subcategories of consumers normally used for design practice today, categories to be studied have been prioritized, Table 0.1.
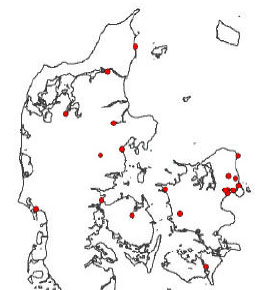
Table 0.1 Consumer categories studied in present project. Bold categories have highest priority Data has been collected from all Denmark, Figure 0.1 and Table 0.2.
Figure 0.1 Location of data collected during project
Table 0.2 Number of single and time series of consumption data, divided among consumer categories and types of consumption measurements 1) Non-specified Data processing has been based on the use of different statistical methods:
In processing consumption data, emphasis has been laid on:
Results are presented by use of graphs, and need no further explanations. Results are compared with the existing Standard's specifications, whenever possible. 0.2.2 Main Conclusions and Project ResultsRelevant Consumer Categories Based on analyses, it is recommended to divide households into two categories:
In addition, it is recommended to use separate consumer categories for day nurseries and kindergartens. It has not been possible to come up with recommendations on integrated institutions or after schools centres. A new consumer category, shopping centres, is recommended. In addition to the existing Standard's supermarkets, this new category covers large as well as smaller shopping centres. Otherwise, recommended consumer categories are similar to the existing Standard's specifications. Relevant Category Units For some of the studied consumer categories it has been possible to compare use of different category units, including:
Analyses are carried out by comparison of the correlation between size of annual consumption and the number of category units. For day nurseries, results of such analysis appear in Figure 0.2 and Figure 0.3.
Figure 0.2 Day nurseries. Relation between annual consumption and number of children
Figure 0.3 Day nurseries. Relation between annual consumption and area It appears that correlation between annual consumption and number of children is better than annual consumption and area. Following category units are recommended for the studied consumer categories:
Recommendations differ from the existing Standard with regard to holiday cottages. Unit Consumptions Unit consumptions are presented graphically to show the relation between annual consumption and the number of consumer units. Moreover, simple mean values are calculated and presented. Unit consumption of shopping centres appears in Figure 0.4.
Figure 0.4 Shopping centres. Relation between annual consumption and area, based on data from 12 centres Simple mean values of analysed consumer categories appear in Table 0.3, and compared with the existing Standard.
Table 0.3 Comparison of simple means of unit consumptions from the present project and the existing Standard 1) Not simple mean values, however 50 %-fractile for 3 persons per flat 2) Depends on physical forms of actual houses. However, unit consumption of detached and town houses is recommended when the average number of persons per house in actual compound is less than 2 Most unit consumptions from present project appear to be significant lower than specified by the existing Standard. Consumption Fluctuations Graphic presentations have been worked out for:
Furthermore, mean values for daily peak factors are calculated on the basis of consumption series of 30 days. Figures 0.5-0.9 show results for flats, a typical example of the present project's presentations.
Figure 0.5 Monthly fluctuations for flats
Figure 0.6 Daily fluctuations of consumption in flats, on week days and holidays/weekends, including fractiles
Figure 0.7 Hourly fluctuations of consumption in flats. Mean values for week days and holidays/weekends
Figure 0.8 Hourly fluctuations of consumption in flats for week days. Mean values and fractiles
Figure 0.9 Hourly fluctuations of consumption in flats for holidays/weekends. Mean values and fractiles Based on present project results, future design of pipelines can take into account the fact that peak consumption of different consumer categories takes place at different times. Calculated mean values of daily peak factors appear in Table 0.4, based on consumption time series of 30 days. Comparison with the existing Standard is questionable, however, due to the fact that the Standard refers to different categories of supply areas.
Table 0.4 Calculated mean values of daily peakfactos from present project compared with specifications of the existing Standard 1) Comprising 3 categories of built-up areas: a) Areas primarily with farms (2-3) - b) Smaller towns with trades (1.5-2) - c) Larger towns with trades and industries (1.3-1.5) 2) Areas with holiday cottages, including camping places, etc. Assessment of Design Consumption – an Example Use of the present project's results is compared with use of the existing Standard. The chosen example comprises a planned, smaller, built-up area, including detached and town houses, a day nursery, a kindergarten and an area with holiday cottages. Design consumption for the area can be calculated at 9 m3/hour, by use of the present project's results. Use of the existing Standard results in a design consumption of 14.5 – 64 m3/hour. Use of the existing Standard and an annual consumption as fixed by present project, results in a design consumption of 11 - 24 m3/hour. Hereby, the last 15-20 years' reduction in consumption is considered. Results appear in Table 0.5.
Table 0.5 Design consumption by use of results from present project and the existing Standard, and assessed for a smaller built-up area. 1) In brackets are specified results which consider observed reduction of consumption during last 15-20 years Use of the present project's results compared with the existing Standard's specifications results in significant lower design consumptions. Main reasons are that the present project considers:
Existing Standard's reference to another standard, DS 439 As part of present project, the validity of the existing Standard's reference to use the standard for water installations, DS 439, when number of the downstream households are less than 200, is analysed. Results indicate that the existing Standard's reference could be altered from 200 to 100 downstream households. 0.3 Retention time of Potable Water in Blocks of FlatsA model has been worked out with a view to assess critical retention times of cold potable water in water installations of blocks of flats. The model is empirically based on 6 main types of blocks of flats. 0.3.1 ApproachMain Types of Blocks of Flats All 6 main types consist of 5 stories, in addition to ground floor. The 6 main types are divided into two groups, one including typical blocks of flats built prior to 1990, and the other including typical blocks of flats built after 1990. In 1990, an updated Standard for water installations was launched. Subsequently, it had significant influence on design of water installations. For each of the 6 main types of blocks of flats, critical retention times have been calculated for built-up areas with one or several blocks. Consumption Input to Model Consumption fluctuation graphs covering hourly mean consumption during two week days and two holidays/weekend are used as input to the model. The graphs are based on results from the present project, including:
Data Processing and Limitations of used Method All data are implemented in an AQUIS computer model for water installations. Four different AQUIS computer models are used, comprising geometrical dimensions of the 6 main types of blocks of flats. Mean retention times from the main meter to the most distant tap in each flat are calculated. The used method implies clear limitations in use of results:
However, it is assessed that calculated critical retention times illustrate potential existence of problems regarding retention time in the studied blocks of flats. 0.3.2 Main Conclusions and Project ResultsCritical Retention Times Calculated retention times are presented graphically. In Figure 0.10 are shown graphs for "Type B1", i.e. blocks of flats built prior to 1990, and for an area with several blocks of flats.
Figure 0.10 Retention time's fluctuations in blocks of flats "Type B1", and for an area with several blocks An overview of maximum and minimum retention times appears in Figure 0.11.
Figure 0.11 Max. and min. retention times for blocks of flats "Types B1-B3", and for an area with several blocks Conclusion Main results comprise:
|
|||||||||||||||||||||||||||||||||||||||||||||||||||||||||||||||||||||||||||||||||||||||||||||||||||||||||||