Ukrudtsstriglingens effekter på dyr, planter og ressourceforbrug
Bilag B
1 Vegetation growth simulation in ALMaSS 4.0
Chris Topping¹ & Jørgen E. Olesen²
¹ Department of Wildlife Ecology and Biodiversity, National Environmental Research Institute, Grenåvej 12, DK-8410 Rønde, Denmark.
² Danish Institute of Agricultural Sciences, Dept. of Agroecology, Research Centre Foulum, P.O. Box 50,DK-8830 Tjele, Denmark.
This document describes the implementation of vegetation growth models in ALMaSS. These models have the aim of providing information on vegetation biomass and height for use by the animal model for which the system is designed.
Vegetation biomass and height are updated on a daily basis and independently for each vegetated element in the ALMaSS landscape. Biological systems are based primarily on photosynthesis, and are thus dependent on incoming radiation. However, the potential for production set by the radiation is greatly modified by temperature. Hence both incoming radiation and temperature were chosen as the driving factors for the vegetation models. Although also important, the current version of ALMaSS does not incorporate rainfall as a driving factor for vegetation growth, but assumes sufficient water availability. The main effect of temperature on plant growth is to control the duration of the period when growth is possible in each year (Olesen and Bindi, 2002), but other processes linked with the accumulation of dry matter (leaf area expansion, photosynthesis, respiration etc.) are also directly affected by temperature.
These effects are summarised in the following equation:

where W is accumulated dry matter (g/m²), ε is radiation use efficiency (g/MJ), φ is fraction of incoming light intercepted by crop canopy, ƒ(T) is effect of temperature T (°C) on dry matter growth, and R is incoming global radiation (MJ/m²).
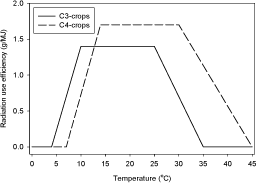
The maximum radiation use efficiency (ε) depends on the species. However, a general distinction may be made only between C3 and C4 species (Figure 1). For C3 species (most Danish species) ε can be generally estimated to be 1.4 g/MJ and for C4 species (in our case maize) 1.7 g/MJ should be used (Sinclair and Muchow, 2000). The temperature response ƒ(T) on DM growth is also different for the different species as illustrated in Figure 1.

Figure 1. The effect of temperature on radiation use efficiencies in c3 & c4 crops (Preening de Vries eta al, 1989; Sinclair & Muchow, 2000).
However, the use of ε of 1.4 for C3 species is too great a simplification. Olesen et al. (2004) used crop specific constants for light saturated photosynthesis per unit leaf area depending on leaf thickness (specific leaf area). These specific leaf areas increased in the order: grass < barley < wheat < rape. Assuming that these figures relate to light use efficiencies (RUE), the following RUE values would be applied to the C3 crops: 1.1 g/MJ for grass, 1.2 g/MJ for barley, 1.4 g/MJ for wheat, and 1.5 g/MJ for rape.
| Vegetation Type | c |
| Natural Grass | A |
| Set-aside | A |
| Young Forest | A |
| Carrots | A |
| Grass /Clover | A |
| Permanent Grass | A |
| Permanent Set-aside | A |
| Grass for seed | A |
| Field Peas | B |
| Beets (fodder) | B |
| Oats | B |
| Potatoes | B |
| Spring Barley | B |
| Winter Barley | B |
| Winter Rye | B |
| Spring Wheat | C |
| Triticale | C |
| Winter Wheat | C |
| Oil Seed Rape | D |
Table 1. The basic crop types currently used in ALMaSS and the constant applied to modify their light use efficiencies (see text for constant values)
In the model implementation this is achieved by using the standard C3 values, but multiplying by a constant ( c ). c may have one of four values, which scale the required RUE relative to 1.4:
A = 0.786; B = 0.857; C = 1.000; D = 1.071.
Crops other than the four crops above were allocated values based on the closest crop type (Table 1).
The value for ε is modified by ƒ(T) for C3 and C4 species following Fig. 1, using the mean daily temperature as the value T. The resultant temperature related value for RUE is then effectively scaled by multiplication by c.
The fraction of intercepted light can be estimated from the green leaf area index (L) as:
φ = 1–exp(–kL)
where k is the extinction coefficient, which in general may be set to 0.4. L was calculated for 40 different crop or crop variants as being dependent upon day degrees from either a certain time of year, or a certain farming event. The relationships between leaf-area index for green and total leaf area (LAI-green & LAI-total) and height with day-degrees are listed in CropCurves.pdf, and are based on Olesen and Heidmann (1990) and Plauborg and Olesen (1991) together with unpublished data. Critical times of year were considered to be 1st January and 1st March. These were chosen to represent the start of a new year, and the time before which crop growth would not occur. Critical events were sowing, and harvest events, both of which will obviously alter the growth pattern of the crop. Hence following a critical event or date, the day degrees sum is reset to zero, and often the values for LAI-total, LAI-green and height are reset to some pre-determined value (e.g. 10 cm height after harvest). This is denoted by a ‘-1’ in the day-degrees sum in CropCurves.pdf. The curves for LAI-total, -green, and height are presented as a set of linearized curves and can therefore be described as a set of fixed points joined by straight lines with a particular slope denoting the rate of change in leaf area and height with day degrees. Implementation in ALMaSS is by determining the rate of change in response variable (leaf area or height) with day-degrees and using this to control the leaf-area and height on a daily basis as the crop grows within the model. As day-degrees are summed the rate of change is read from the curve until a fixed point is passed, when a new rate of change will be used. Thus, as growth proceeds, the day degrees are summed following each critical point, and the correct rate of change selected depending on last fixed point that is met. If the current day’s addition to the day-degrees sum overshoots the next fixed point, then the model calculates growth up to the next fixed point, then using the remaining day-degrees, calculates growth from that point. The result of this procedure is for height and leaf-area for all crops in ALMaSS to quite accurately match the input curves, but be dependent upon the temperature information in the weather data used to determine at what date a certain point will be reached. As a result, if a crop is sown too late or if a weather set is used that results is very slow growth, then it likely that, as in reality, the crop will not reach its mature height or leaf area.
To simulate the effect of altered fertiliser regimes on the gain in biomass another constant is used ( p ). This constant takes four values: 1.00, the default value; 0.8 for low fertilizer levels (all non-grass organic crops); 0.67 for ex-arable land (set-aside and young forests); and 0.5 for non-farm habitats (natural grass).
The radiation R can also be taken as the measured daily global radiation, but since this information is rarely available, an alternative is to use the normal daily global radiation, which can be approximated by a Fourier series (Olesen, 1991):
Rd = b0 + b1cos(ωd) + b2sin(ωd) + b3cos(2ωd) + b4sin(2ωd)
where Rd is global radiation on day number d in the year, ω = 2π/365, and b0 to b4 are constants. For the climate station Ødum, from where the weather data normally used for ALMaSS simulations for Denmark comes, these constants have been estimated for the period 1961 to 1990 as b0 = 9.478, b1 = -9.221, b2 = 1.458, b3 = 0.653 and b4 = -0.421.
1.1 Determination of model curves for natural grass vegetation
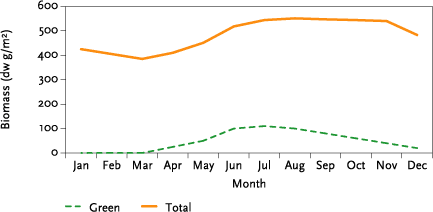
Growth of non-crop grassland was based on data from Al-Mufti et al (1977). This work provides seasonal variation in dry weight of live shoot material and dead litter from three grassland sites in Yorkshire, UK. These data were pooled and mean figure estimated for each month (Figure 2).
To recreate this curve it was necessary to estimate the LAI total and LAI green required to generate the seasonal pattern required. For LAI total, this was achieved by assuming a maximum LAI total of 5.5, corresponding to 550 g/m², and scaling this so that at minimum dead biomass the LAI-total was 3.85 corresponding to 385 g/m² ( Figure 2 ). LAI-green was then fitted by trial and error until the resulting pattern of seasonal biomass changes matched Figure 2. Fitting was carried out using an 11-year weather data series from Ødum in Denmark that spanned 1989-1999 inclusive. The mean biomass curve over the 11 years that resulted fitted the target value for all months within 5%. The resulting LAI-total and LAI-green values are listed in Table 2.

Figure 2. Seasonal changes in live and dead biomass as a mean response from three UK grasslands (estimated from Al-Mufti et al, 1977).
| TSum | LAI-Total | LAI-Green | Height | |
| From Jan 1st | 0 | 4.83 | 0 | 70 |
| 105 | 3.85 | 0 | 56 | |
| From Mar 1st | 0 | 3.85 | 0 | 56 |
| 289 | 4.5 | 1 | 65 | |
| 695 | 5 | 1.25 | 73 | |
| 1017 | 5.5 | 0 | 80 | |
| 2619 | 5.5 | 0 | 80 | |
| 2787 | 4.83 | 0 | 70 | |
| 99999 | 4.83 | 0 | 70 | |
| After Cutting | 0 | 0.3 | 0 | 10 |
| 289 | 4.5 | 1 | 65 | |
| 695 | 5 | 1.25 | 73 | |
| 1017 | 5.5 | 0 | 80 | |
| 2619 | 5.5 | 0 | 80 | |
| 2787 | 4.83 | 0 | 70 | |
| 99999 | 4.83 | 0 | 70 |
Table 2. The values used in ALMaSS to predict vegetation growth for non-crop grasslands. Tsum is the number of day degrees experienced. LAI-Total is a measure of the total leaf-area index, and LAI green is a measure of the available photosynthetic surface. Height indicates the height in cm achieved for the day-degrees experienced.
2 References
Al-Mufti, M.M., Sydes, C.L., Furness, S.B., Grime, J.P. & , S.R. Band (1977). A quantitative analysis of shoot phenology and dominance in herbaceous vegetation. J. Ecol. 65: 759-791.
Olesen, J.E. (1991). Jordbrugsmeteorologisk årsoversigt 1990. Statens Planteavlsforsøg, beretning nr. S2130.
Olesen, J.E. & M. Bindi (2002). Consequences of climate change for European agricultural productivity, land use and policy. European Journal of Agronomy 16, 239-262.
Olesen, J.E. & T. Heidmann (1990). EVACROP. Et program til beregning af aktuel fordampning og afstrømning fra rodzonen. Version 1.00. AJMET Arbejdsnotat nr. 9.
Olesen, J.E., Rubæk, G., Heidmann, T., Hansen, S. & C.D. Børgesen (2004). Effect of climate change on greenhouse gas emission from arable crop rotations. Nutrient Cycling in Agroecosystems 70, 147-160.
Penning de Vries, F.W.T., Jansen, D.M., ten Berge, H.F.M. & A. Bakema (1989). Simulation of ecophysiological processes of growth in several annual crops. Simulation Monographs. Pudoc.
Plauborg, F. & J.E. Olesen (1991). Udvikling og validering af modellen MarkVand til vandingsstyring i landbruget. Tidsskrift for Planteavls Specialserie S2113.
Sinclair, T.R. & R.C. Muchow (2000). Radiation use efficiency. Advances in Agronomy 65, 215-265.
Version 1.0 Januar 2007, © Miljøstyrelsen.