Survey and Health Assessment of Possible Health Hazardous Compounds in Proofing Sprays
6 Results of quantitative analyses and aerosol analyses
In co-operation with the Danish Environmental Protection Agency, 10 products were selected for quantitative analyses and investigation for content of possible perfluoralcohols. The selection took a starting point in the screening analyses results by x-ray and GC/MS.
The 10 selected products appear from Table 6.1.
Table 6.1 Outline of selected products
| Product no. | 1 | 3 | 4 | 8 | 14 | 16 | 18 | 21 | 25 | 26 |
| Type | Spray | Spray | Pump | Spray | Spray | Pump | Spray | Spray | Spray | Spray |
9 of the products (no. 1, 3, 8, 14, 16, 18, 21, 25, 26) were analysed to quantify selected organic compounds that might constitute a health risk.
Analyses were carried out on the selected products (no. 4, 8, 14, 21, 25) where x-ray measurements either detected a content of fluorine or where GC/MS screening analyses detected content of fluorinated alcohols related to 1H,1H,2H,2H-perfluoroctane-1-ol, in order to examine if it was possible to identify these compounds and quantify them against 1H,1H,2H,2H-perfluoroctan-1-ol.
In connection with the initial analyses, product no. 4 showed a high content of fluorine but it was not possible by means of GC/MS analysis to detect content of organic compounds. In agreement with the Danish Environmental Protection Agency it was therefore decided to investigate if it was possible to find another analysis method for determination of the substances in this product.
6.1 RESULTS OF ANALYSES
In the following, the results of the quantitative analyses, investigations of fluorinated compounds and analyses of product no. 4 will be presented. The results are discussed closer in chapter 7, Discussion of analysis results.
6.1.1 Results of quantitative analyses of organic compounds
The tables below show the results of the quantitative GC/MS analyses of the selected products and the selected organic compounds that are considered to be relevant in relation to the health assessment. The results are the averages of the analyses in duplicate and the standard deviation is stated.
Table 6.2 Results of quantitative analyses, mg/g
| Identification | CAS no. | Sample no. | |||||
| 1 | 3 | 4 | 8 | 14 | Det.limit | ||
| 1,1-Dichlorethane | 75-34-3 | i.a. | i.a. | - | 0.06 ± 0.01 | i.a. | 0.02 |
| 1,2-Dichlorethene | 156-60-5 | i.a. | i.a. | - | - | i.a. | 0.02 |
| Methylene chloride | 75-09-2 | i.a. | i.a. | - | - | i.a. | 0.02 |
| 2-Butanone | 78-93-3 | i.a. | i.a. | - | - | i.a. | 0.02 |
| 1-Butanol | 78-92-2 | - | - | - | - | i.a. | 0.2 |
| Cyclohexane | 110-82-7 | 6.5 ± 0.3 | 0.29 ± 0.02 | - | 6.0 ± 0,2 | i.a. | 0.01 |
| Heptane | 142-82-5 | 105 ± 4 | 267 ± 11 | - | 210 ± 24 | i.a. | 0.01 |
| Toluene | 108-88-3 | - | - | - | - | - | 0.02 |
| Ethyl benzene | 100-41-4 | - | - | - | - | - | 0.02 |
| p-Xylene | 95-47-6 | - | - | - | - | - | 0.02 |
| m- and o-xylene | 108-38-3, 106-42-3 | - | - | - | - | - | 0.02 |
| n-Butyl acetate | 123-86-4 | 98 ± 3 | 20 ± 2 | - | - | 80 ± 3 | 0.03 |
| d-Limonene | 5989-27-5 | 0.50 ± 0.01 | - | - | - | - | 0.02 |
| 2-Butoxyethyl acetate | 112-07-2 | - | - | - | - | - | 0.02 |
| Dodecamethylpenta siloxane | 141-63-9 | - | - | - | - | - | 0.03 |
| 1H,1H,2H2H-perfluoroctane-1-ol | 647-42-7 | i.a. | i.a. | - | - | - | 0.06 |
| Other fluorine containing compounds* | i.a. | i.a. | - | 0.61 ± 0.04 | 0.68 ± 0.01 | 0.1 | |
”-” Means that the component was not identified or below the detection limit
”i.a.” Means that analysis has not been carried out for this component
* Calculated against 1H,1H,2H2H-perfluoroctane-1-ol
Det. limit: Detection limit
Table 6.2 Results of quantitative analyses, mg/g, continued…
| Identification | CAS no. | Sample no. | |||||
| 16 | 18 | 21 | 25 | 26 | Det.limit | ||
| 1-Butanol | 78-92-2 | - | 3.8 ± 0.5 | - | - | 0.44 ± 0.01 | 0.2 |
| Cyclohexane | 110-82-7 | - | - | - | - | - | 0.01 |
| Heptane | 142-82-5 | - | 0.048 ± 0.002 | - | - | - | 0.01 |
| Toluene | 108-88-3 | - | 0.78 ± 0.01 | - | 0.065 ± 0.003 | 0.020 ± 0.001 | 0.02 |
| Ethyl benzene | 100-41-4 | - | 0.97 ± 0.01 | - | 0.027 ± 0.001 | - | 0.02 |
| p-Xylene | 95-47-6 | - | 2.4 ± 0.1 | - | 0.046 ± 0.001 | - | 0.02 |
| m- g o-xylene | 108-38-3, 106-42-3 | - | 0.84 ± 0.01 | - | 0.032 ± 0.001 | - | 0.02 |
| n-Butyl acetate | 123-86-4 | 0.058 ± 0.009 | - | - | 0.065 ± 0.03 | - | 0.03 |
| d-Limonene | 5989-27-5 | - | - | - | - | - | 0.02 |
| 2-Butoxyethyl acetate | 112-07-2 | 0.037 ± 0.002 | - | - | - | - | 0.02 |
| Dodecamethylpenta siloxane | 141-63-9 | - | 0.66 ± 0.01 | - | - | - | 0.03 |
| 1H,1H,2H2H-Perfluoroctane-1-ol | 647-42-7 | i.a. | i.a. | - | - | i.a. | 0.06 |
| Other fluorine containing compounds* | i.a. | i.a. | 0.33 ± 0.01 | - | i.a. | 0.1 | |
”-” Means that the component was not identified or below the detection limit
”i.a.” Means that analysis has not been carried out for this component.
* Calculated against 1H,1H,2H2H-perfluoroctane-1-ol
Det. limit: Detection limit
6.1.2 Results of analyses of fluorine containing compounds
The analysis of product 4, 8, 14, 21 and 25 together with the analysis of an external standard showed that none of the products contain 1H,1H,2H2H-perooctane-1-ol. In product 8, 14, 21 and 25 a number of compounds were detected that cannot be identified. From the mass spectrum of the substances it was assessed that they are related to 1H,1H,2H2H-perfluoroctane-1-ol.
Through analysis by means of NCI-GC/MS it was also confirmed that fluorine compounds are in question, please also see chapter 7.
6.1.3 Results of analyses of product no. 4
It was not possible to find a suited solvent for product no. 4 that makes a screening analysis for volatile and semi-volatile organic compounds by GC/MS possible.
6.1.4 Results of aerosol analyses
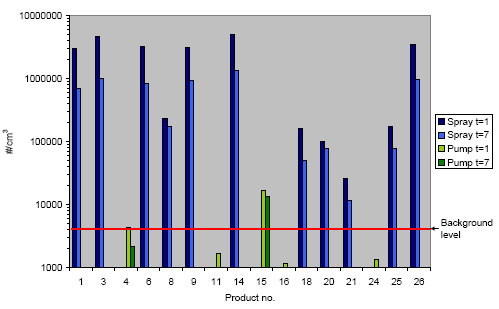
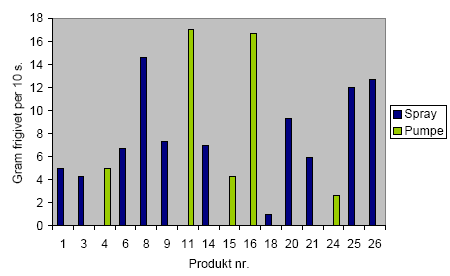
The measured aerosol concentrations and average sizes have been summed up in Table 6.4 and are also shown in Figure 6.1. The aerosol size distribution of the 16 selected products appears from table 6.4. The largest uncertainty on the measurement results is found in the reproducibility of the amount and the way the proofing liquid leaves the product at 10 s of continuous use. For products with a pump, continuous use means that pumping takes place continuously for 10 s at a frequency that is as high as possible in order to obtain maximum liberation of a product. The variation in the amount of liberated aerosols is ± 40 %. Please also refer to table 6.3 for liberated substances from pump and spray products. The variation in the mean value of the aerosol diameter is ± 20%. Figure 6.2 shows the product amount that was liberated during 10 s of proofing and it was measured by weighing the can before and after proofing.

Figure 6.1 Total number of aerosoles (#) liberated during 10 s of proofing with spray or pump products measured at two different times after proofing.
| Aerosol measurement after 1 minute | Aerosol measurement after 7 min. | |||||||||
| Product no. | Libe- rated amount of proofing spray per 10 s. (g) |
Aero- sols 20-650 nm (103 per cm³) |
Aero- sols 20-100 nm (103 per cm³) |
Aero- sols 100-650 nm (103 pee cm³) |
Mean aerosol size (nm) |
Aero- sols 20-650 nm (103 per cm³) |
Aero- sols 6-20 nm (103 per cm³) |
Aero- sols 20-100 nm (103 per cm³) |
Aero- sols 100-650 nm (103 per cm³) |
Aero- sol size Mean value (nm) |
| 1 | 5.0 | 3000 | 2000 | 1000 | 104 | 680 | 0 | 370 | 320 | 124 |
| 3 | 4.3 | 4500 | 1500 | 3000 | 171 | 1000 | 0 | 150 | 860 | 209 |
| 4 | 5.0 | 4 | 2 | |||||||
| 6 | 6.7 | 3200 | 2300 | 930 | 93 | 840 | 0 | 510 | 330 | 110 |
| 8 | 14.6 | 230 | 230 | 8 | 38 | 170 | 67 | 170 | 4 | 36 |
| 9 | 7.3 | 3100 | 2200 | 890 | 98 | 930 | 0 | 470 | 460 | 125 |
| 11 | 17.0 | 2 | 1 | |||||||
| 14 | 7.0 | 5000 | 3200 | 1800 | 105 | 1300 | 0 | 570 | 770 | 129 |
| 15 | 4.3 | 17 | 13 | 3.4 | 79 | 13 | 4 | 11 | 2 | 70 |
| 16 | 16.7 | 1 | 1 | |||||||
| 18 | 1.0 | 2500 | 1500 | 1000 | 114 | 670 | 0 | 300 | 380 | 148 |
| 20 | 9.3 | 100 | 78 | 23 | 83 | 77 | 3 | 60 | 17 | 82 |
| 21 | 5.9 | 26 | 14 | 12 | 136 | 12 | 7 | 8 | 4 | 120 |
| 24 | 2.6 | 1 | 1 | |||||||
| 25 | 12.0 | 170 | 120 | 57 | 99 | 76 | 21 | 63 | 13 | 68 |
| 26 | 12.7 | 3400 | 2800 | 620 | 74 | 950 | 0 | 720 | 230 | 89 |
Table 6,3. Measured aerosol concentrations and average sizes.
Table 6.4. Number (#) of measured aerosols per cm³ as function of aerosol diameter in the interval of 10-1000 nm after 7 min.

Figure 6.2 Product liberated (g) after 10 s of proofing.
Version 1.0 October 2008, © Danish Environmental Protection Agency