Survey and Health Assessment of Possible Health Hazardous Compounds in Proofing Sprays
7 Discussion of analysis results
7.1 Chemical analyses
The chemical analyses that were carried out demonstrated and quantified a number of organic chemical compounds that either were on the List of Hazardous Substances or comprised by Regulation no. 571 concerning the use of propellants and solvents in aerosol cans. The importance of these results is also mentioned in Chapter 8.
7.2 Fluorinated compounds
As expected, a content of the element fluorine was demonstrated in a number of the investigated products. However, it has only been possible to detect a limited number of fluorine compounds and on the basis of the estimated concentrations it must be ascertained that the main part of the fluorine compounds contained in the fluorine based products cannot be detected. Most likely because the substances are developed or intended to polymerize rather quickly and create a water-repellent surface. The substances are expected to consist of short fluorinated carbon strings of the type (-CF2-)n or similar, terminated with an active component which leads to polymerisation. The main component is presumably designed to polymerize easily when in contact with air (oxygen and/or water vapour) which therefore also will happen in connection with the analytical procedure. That makes it very difficult to isolate and analyse monomers.
The detected fluorine compounds appear in concentrations of less than 1 mg/g in products where the fluorine content determined by x-ray analysis is more than 20 mg/g. That means that the main part of the fluorine amount exists as a substance that cannot immediately be analysed by means of GC/MS. The reason is most probably that the non-detectable fluorine compounds exist in complete or partly polymerized form. Analysis methods taking this problem into account have not been published and a more complete fluorine mass balance therefore requires the development of completely new analysis methods.
The mass spectra of the detected fluorine compounds are related to known mass spectra for substances of the type CF3(CF2)nCH2CH2OH, for instance 1H,1H,2H,2H-perfluoroctane-1-ol (FTOH 6:2). Such substances are called fluortelomer alcohols (FTOH). However, none of the detected substances have the same chromatographic retention time or a mass spectrum identical to FTOH 6:2. In addition, the mass spectra do not indicate that the nucleus in the substances is fluortelomer aldehydes, fluortelomer acids or unsaturated fluortelomer alcohols. Several of the detected substances have mass spectra that are very similar to FTOH 6:2, however, with the decisive difference that the mass fragment m/z 95 has been replaced by m/z 77. M/z 95 corresponds to –CF2CH2CH2OH and is the same for all fluortelomer alcohols. M/z 77 can correspond to -CFHCH2CH2OH where one single fluorine atom has been replaced with a hydrogen atom. Therefore, it must tentatively be said that several products contain substances of the type CF3-(CF2)n- CFHCH2CH2OH.
On the basis of the chromatographic retention times on the chosen non-polar column it is possible to estimate the boiling point intervals of the detected substances by comparing with hydrocarbon standards.
Product no. 8 contains 3 fluorine compounds with estimated boiling points in the interval of 450-520K.
Product no. 14 contains 6 fluorine compounds with estimated boiling points in the interval of 430-480K.
Product no. 21 contains 4 compounds with estimated boiling points in the interval of 390-470K.
In comparison, FTOH 6:2 has a boiling point of 368K. With the above method a boiling point of 407K is estimated which indicates that this simple method has a tendency to overestimate the boiling point.
As it appears, substances much less volatile than FTOH 6:2 were detected in most cases and therefore they must be assumed to have a longer string length.
7.3 Aerosol analyses
The aerosol analyses that were carried out show that the consumer can be exposed to rather large amounts of small aerosols (6-650 nm) when using textile proofing agents. The concentration of aerosols (propellant products) in the can that was used was in several cases larger than 106 per cm³ at 10 s of exposure. In comparison, the exhaust from diesel vehicles contains 107-108 per cm³ (at the exhaust pipe without dilution from the surroundings). In polluted town air the aerosol concentration is in the order of magnitued of 105 per cm³.
In general, spray products with propellant liberated more aerosols in the interval 20-650 nm compared to other products without propellant. The amount of liberated aerosols from products without propellants was in most cases comparable to the background level. In connection with spray products, there was a great difference between the number of aerosols and aerosols per weight unit that the different products create. No clear connection can be made between the chemical composition and number or aerosol size. Aerosol exposure is first and foremost determined by whether spray or pump products are in question.
The reason why pump based products do not cause exposure to aerosols to an appreciable extent is probably that the pump mechanism gives larger primary aerosols which are deposited much more efficiently on textiles than the smaller aerosols generated from propellant products.
In several of the investigated products, the word ”nano” appears in the product name. However, all those products have a pump mechanism and do not give rise to the liberation of small aerosols as mentioned above.
The obtained results do not indicate that the products contain actual nanoaerosols and the “nano” description presumably refers to the coating that is obtained. In principle, it cannot be ruled out that the products contain nanoparticles in solid form suspended in liquid, but neither the chemical analyses nor the aerosol analyses indicate that. In any case, it can be ascertained that products with pump mechanisms do not expose the user to small aerosols.
Whether or not a nanostructured coating, a coating with nanothickness or added nanoparticles (in solid form) actually are in question has not been investigated in this project.
These results are in agreement with German investigations that concluded that a certain ”nanoproduct” did not contain nanomaterials (BfR, 2006b).
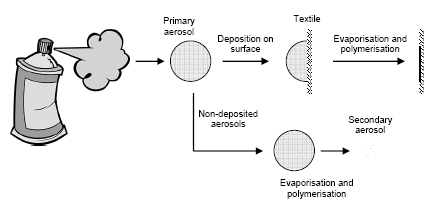
Figure 7.1 shows how fine and ultra fine aerosols are created when a propellant based product is used.

Figure 7.1 Flow diagramme of the creation of fine and ultra fine (nano) aerosols after evaporation of solvent from the fraction of the primary aerosols that are not deposited on the textile surface.
The measurement of aerosols in the interval of 6-650 nm seems to cover the entire relevant measuring area for all products, however, the aerosol distribution of product 3 has a smaller fraction the exceeds 650 nm and for product 8 it seems that few aerosols are liberated with a diameter under 6 nm. The aerosol distribution of product 3 was measured up to 1000 nm. The amount of aerosols in the interval of 650-1000 nm declined evenly. From the obtained size distributions it can be ruled out that there will be significant amounts of aerosols > 1000 nm because then a gradual increase in the number of aerosols in the high end of the size interval would have been observed.
That demonstrates that the solvents (all volatile) evaporate very quickly (within 1 minute) and leave small aerosols. Otherwise, a pronounced change in size would have been observed in the period after 1 minute.
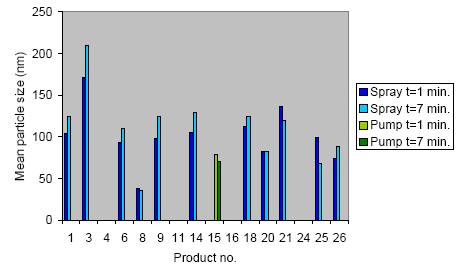
The mean size of the liberated aerosols from the products is shown in Figure 7.2. In connection with spray products, the aerosol size general increased with time after proofing except for product 8 and 20 where the aerosol size was constant and product 21 and 25 where the aerosol size declined. After liberation of spray products, the aerosol size increased as a function of time and that might be because the concentration of aerosols is very high and therefore the collision rate between the aerosols is high. During collision, the aerosols can aggregate and in that way create larger aerosols in time. A decline in aerosol size can be due to additional evaporation of small volatile compounds.

Figure 7.2 Mean particle size (nm), measured 1 minute and 7 min. after proofing.
Version 1.0 October 2008, © Danish Environmental Protection Agency