The Greenhouse gases: HFCs, PFCs and SF6
1 Summary
1.1 Danish consumption and emission of F-gases
1.1.1 Consumption
HFCs
In 2007, the total import (minus re-export) of pure HFCs and HFC blends was estimated to 403.2 tonnes. Compared to 2006, where total consumption was 558.8 tonnes, the import has decreased with 155.8 tonnes. The import of almost all HFCs are reduced.
The 2007 import of HFC-134a is reduced with 120 tonnes compared to 2006 with a total consumption of 160.7 tonnes. This substantial reduction is first of all coursed by more than 50% reduction in use of new refrigerants in commercial refrigeration system and in production of household fridges.
Import of HFC-404a is reduced with 46.5 tonnes compared with 2006, and the total consumption is 129.9 tonnes in 2007. The reduction is coursed by approx. 25% reduction of consumption in commercial refrigeration system.
Imports of HFC-407c were reduced with 20.1 tonnes to 50.5 tonnes in 2007. HFC-407c is a substitute refrigerant for HCFC-22 in refrigerators. Over the last decade there has been an overall increase in import of HFC-407c but in 2005 and now also 2007, the import was reduced. It might indicate that a number of older refrigeration systems are phased out.
The reduction in consumption of main refrigerants in 2007 (HFC-134a, HFC-404a and HFC-407) in commercial refrigeration system has been more than 185 tonnes from 2006 to 2007. It clearly emphazise the effect of the ban against installation of new HFC systems brought into force 1.1. 2007.
SF6
The overall consumption of SF6 in 2007 was approx. 5.4 tonnes. Consumption of SF6 was used for power switches in high-voltage power systems and laboratories.
PFCs
The Danish consumption of PFCs (per fluoropropane) in 2007 was 0.7 tonnes. The PFC consumption in 2007 derives from to areas:
- optics fibre production
- refrigerants in commercial refrigeration
1.1.2 Emission
The GWP-weighted actual emissions of HFCs, PFCs, and SF6 in 2007 were 884.4 thousand tonnes CO2 equivalents and the emission has increased compared to 2006, where the corresponding emissions were 865.3 thousand tonnes CO2 equivalents as reported in /24/.
The total emission in 2007 has increased for HFCs but decreased for SF6. The emission of PFCs is almost the same as in 2006.
The increase in emissions for HFCs is in particular occurring from increased emissions of HFC-404a and increased emissions of HFC-134a from stock in commercial refrigerants.
Emissions from reductions of HFC-134a in aerosol sprays and use of SF6 in laboratories decreases from 2006 to 2007.
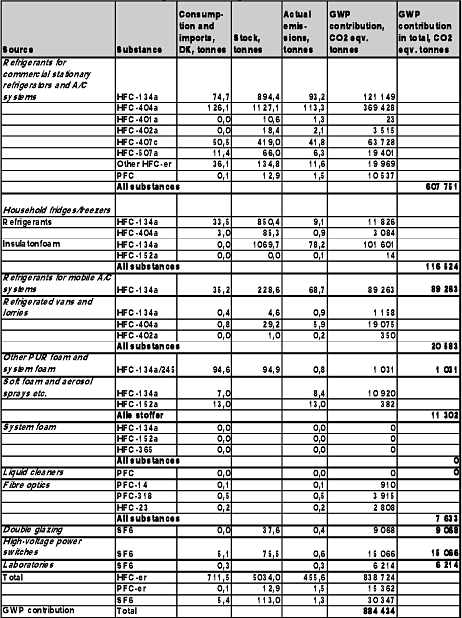
In Table 1.1, consumption, actual emissions and stock in products are summarised.
Table 1.1 Consumption, actual emissions, stock, actual emission and GWP contribution from greenhouse F-gases 2007, tonnes.

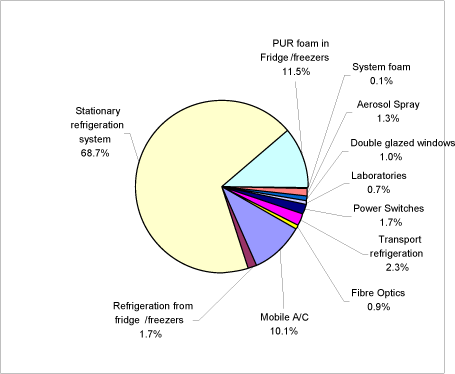
In Figure 1.1, The relative contributions of HFCs, PFCs, and SF6 to the total emission in CO2-equivalents are shown for application areas for 2007.

Figure 1.1 The relative distribution of GWP emissions, analysed by aplication area, 2007
The figure shows that emissions from refrigerants used in commercial stationary refrigerators account for the largest GWP contribution. These refrigerators cover 68.7 per cent of the total actual contribution in 2007. The major contribution is from HFC-404a.
The second-largest GWP contribution, accounting for 11.5 per cent, is emission from release of HFC-134a stock in insulating foam in fridges and freezers.
Emission of HFC-134a from mobile A/C contribute with 10.1 per cent and emission of HFC-134a and HFC-404a from transport refrigeration contributes with 2.3 per cent of the total GWP contribution.
The three sources of SF6 emissions in 2007 were power switches, double glazing windows and laboratories/fibre optics. These account for 3.3 per cent of the total GWP contribution.
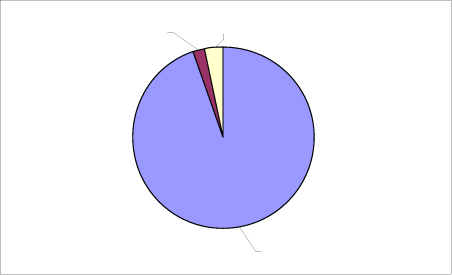
HFCs contribution is estimated to comprise 94.8 per cent of the overall GWP contribution in 2007, Emissions of SF6 comprise 3.5 per cent and emissions of PFC contribute with 1.7 per cent of the total emission.
The relative distribution is shown in Figure 1.2.

Figure 1.2 The relative distribution of the GWP contribution from HFCs, PFCs, and SF6, 2007.
HFC’s
Actual emissions from HFCs have been calculated to 838 724 tonnes CO2 equivalents. In 2006, emissions were 833 600 tonnes CO2 equivalents. It is an increase of approx. 5 100 tonnes CO2 equivalents.
The actual emission from HFCs has increased to its highest level since HFCs has been monitored.
SF6
Actual emissions have been calculated at 1.3 tonnes, equivalent to a GWP contribution of 30 347 tonnes CO2 equivalents. In 2006, emissions were 36 000 tonnes CO2 equivalents.
PFCs
The emission of PFCs origins from of PFCs in production of fibre optics and stock emission from commercial refrigeration containing HFC-413a. The total GWP-weighted PFC emission is 15 362 tonnes CO2 equivalents.
1.1.3 Trends in total GWP contribution from F-gases
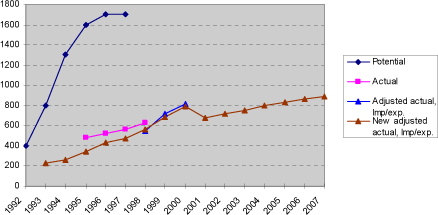
Figure 1.3 shows the trend in Danish GWP contributions from HFCs, PFCs, and SF6 for 1992-2007. The differences from the present calculations of the total GWP value compared with earlier calculation methods are illustrated in the figure.

Figure 1.3 Trends in GWP-weighted potential, actual and adjusted actual emissions 1992-2007, 1.000 tonnes CO2 equivalents.
The figure shows that the GWP emission has continued the increase started in 2001 and reached the highest level for calculation of actual emissions.
The development in the GWP contribution 1992-2007 can also be seen in Table 1.2 below.
Table 1.2 Total GWP-contribution from HFCs, PFCs, SF6, 1992-2007determined according to the four different methods of calculation applied during this period, 1 000 tonnes CO2 equivalents,
| Potential | Actual | Actual, adjusted imp/exp. |
New actual, adjusted imp/exp. |
|
| 1992 | 400 | |||
| 1993 | 800 | 230 | ||
| 1994 | 1300 | 263 | ||
| 1995 | 1600 | 480 | 344 | |
| 1996 | 1700 | 520 | 435 | |
| 1997 | 1700 | 560 | 472 | |
| 1998 | 625 | 577 | 564 | |
| 1999 | 700 | 683 | ||
| 2000 | 818 | 793 | ||
| 2001 | 699 | |||
| 2002 | 719 | |||
| 2003 | 745 | |||
| 2004 | 797 | |||
| 2005 | 829 | |||
| 2006 | 865 | |||
| 2007 | 884 |
Version 1.0 May 2009, © Danish Environmental Protection Agency