Model assessment of reductive dechlorination as a remediation technology for contaminant sources in fractured clay: Modeling tool
Appendix I Different degradation scenarios
As explained in Section 4.3.4 in the main report, the results from field samples and literature studies have shown dechlorination may occur in a reaction zone near the high permeable sand zone (fractures), but no biomass transport or growth is expected deep within the clay matrix. Hence different scenarios need to be considered relative to degradation location:
- No degradation occurs in the system
- Degradation occurs only in the high permeable zone, i.e. the fractures
- A reaction zone is formed at the clay – fracture interface, where degradation is also taking place
- Degradation in the whole matrix
The last scenario is not likely to be realistic but isused to assess a “best case” case relative to degradation.
In the absence of literature data, the degradation zone is assumed to be extended up to 0.05 m inside the clay matrix, corresponding to observations at Rugårdsvej field site. However the biomass growth in this reaction zone is restricted by pore size limitations [Lima and Sleep, 2007] and cannot be simulated in the same way as the biomass growth in the fracture. For the simplicity of the model, the biomass will be assumed to be constant both in the fracture and matrix, with a concentration of 108 cells/L [Miljøstyrelsen, 2008].
These four scenarios are applied to the base case configuration with the transport parameters in Section 5.2.2 in the main report, while the parameters relative to chlorinated solvents dechlorination are taken from optimization results in Section 3.4.1 in the main report. Finally a homogenous initial TCE concentration of 100 mmol/m³ is applied.

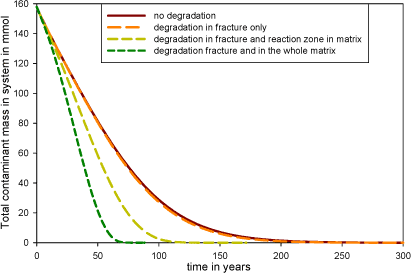
Figure I.1 – Remaining total contaminant mass in the system for the four degradation scenarios

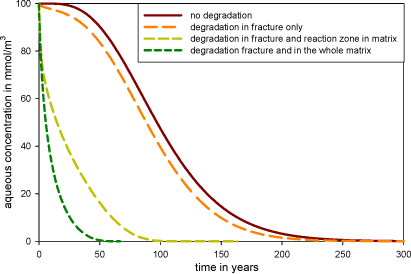
Figure I.2 –TCE concentration at the fracture outlet for the three degradation scenarios
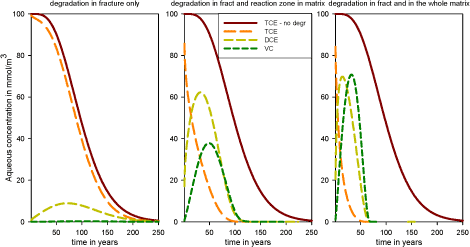
The scenario with degradation in the fracture only does not differ much from the scenario without degradation, especially concerning the mass removal rate in the system. This is due to the fact that the contaminant downward transport in the fracture, controlled by the groundwater velocity, is much higher than the degradation rate. Therefore the contaminant has no time to be degraded once it has reached the fracture (from counter diffusion from the matrix) and the production of daughter products (DCE and VC) is very limited (see Figure I.3). On the contrary in the presence of a reaction zone at the matrix – fracture interface, daughter products are formed (Figure I.3) and the mass removal occurs significantly faster (Figure I.1). As expected, under the assumption of degradation in the whole matrix, the mass removal is much faster.

Figure I.3 – TCE, DCE and VC concentrations at the fracture outlet for the three degradation scenarios (compared with TCE for the case without degradation)
Version 1.0 July 2009, © Danish Environmental Protection Agency