Model assessment of reductive dechlorination as a remediation technology for contaminant sources in fractured clay: Modeling tool
Appendix H Impact of the choice of initial condition
The initial condition in the matrix should correspond to the state of the system at the end of the contamination phase. As the duration and characteristics of this contamination phase are often not known precisely, the initial condition of the system must be based on field measurements or even assumed. Therefore it is important to assess the sensitivity of the numerical model to different initial concentration distributions. Three different scenarios will be assessed:
- Homogenous initial concentration in the entire matrix (Cm(x, z, t = 0) = C0)
- Simulation of a 30-years contamination phase with constant concentration at the top of the matrix
- Simulation of a 30-years contamination phase with a constant concentration at the inlet of the fracture
As it is expected that the initial condition scenario will be most significant for geometric configurations with a large fracture spacing, the simulations were conducted with 2b = 3mm and 2B = 1 m.
In order to be able to compare the different initial conditions on the output of the system (mass removal and contaminant flux), the same initial total mass of contaminant has been used, Mtot,ini = 532 mmol = 70 g. It can be seen on Figure H.1 that these scenarios give very different initial concentration distributions. Figure H.2 and Figure H.3 show these different configurations give similar results with regards to both timing and marginally mass removal efficiency. Results show that the mass removal time is decreasing from scenario A to scenario C. In scenario B and C most of the contamination is close to the fracture; therefore the diffusion time from the matrix to the fracture is smaller than in scenario A.
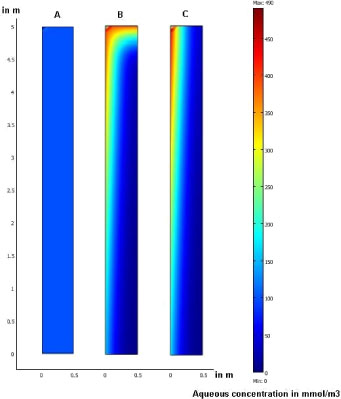
Figure H.1 – Initial concentration distributions for the three initial conditions
Figure H.2 – Total mass remaining in the system for the three initial conditions
Figure H.3 – Concentration at the fracture outlet for the three initial conditions
The use of different initial conditions can lead to different results, notably concerning the mass removal efficiency. However, as results are fairly similar the homogenous initial condition (A) will be used in the following sections of the report.
Version 1.0 July 2009, © Danish Environmental Protection Agency