Model assessment of reductive dechlorination as a remediation technology for contaminant sources in fractured clay: Case studies
3 Modeling tool
3.1 Further development of modeling tool
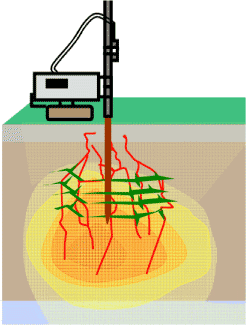
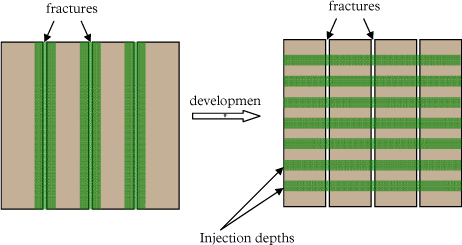
The modeling tool presented in (Miljøstyrelsen 2008a) has been further developed in order to reflect better the reality of the field. The model was taking into account only the fully penetrating vertical fractures and it was assumed that injection of substrate and bacteria was performed in these vertical fractures, allowing a reaction zone to develop vertically around these fractures (Figure 3.2 (left)). However injections at a field site are performed at different interval (called injection depths) and that the injected products are expected to spread horizontally along the natural and/or artificial high permeability features (see Figure 3.1). Therefore the model was further developed to take this phenomenon into account.

Figure 3.1 – Injection and spreading of injected products along high permeability features in the source zone

Figure 3.2 - Development of the modeling tool, from vertical reaction zones around vertical fractures (Delrapport II, (Miljøstyrelsen 2008a)) to horizontal reaction zones around injection depths
3.2 Modeling scenarios
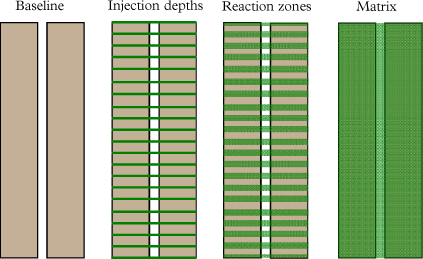
Different model scenarios will be tested for the three sites, corresponding to different spreading of the substrate and biomass into the contaminated clay:
- No dechlorination (baseline) – the system is driven solely by leaching
- Dechlorination at the injection depths only
- Dechlorination in a 10-cm thick reaction zones formed around the injection depths
- Dechlorination in the whole matrix
The background for these scenarios is further explained in (Miljøstyrelsen 2008a), differ.

Figure 3.3 - Illustration of the four different scenarios that were used for the sites
Version 1.0 July 2009, © Danish Environmental Protection Agency