Model assessment of reductive dechlorination as a remediation technology for contaminant sources in fractured clay: Case studies
7 Discussion of results
- 7.1 Comparison between the sites
- 7.2 Recommendations for definition of remediation criteria
- 7.3 Recommendations for field investigations prior to and during remediation
- 7.4 Recommendations for use of reductive anaerobic dechlorination
- 7.5 Recommendations for improving modeling tool
The modeling results, especially in term of cleanup times, presented in this report should not be considered as absolute values, as a lot of simplifications and assumptions have been done during the modeling process. The main purpose of this work is to achieve a better characterization of the key processes and parameters, rather than doing exact predictions of cleanup times. However the developed modeling tool gives an order of magnitude of the timeframes for remediation and allows comparing the different remediation scenarios. The sites can also be compared to discuss the decision-support parameters for applying ERD in clayey till.
7.1 Comparison between the sites
The modeling results for the three sites in terms of remediation times and proposed termination criteria are compared and summarized in Table 9. The model for remediation treatments are the same for Vadsbyvej and Gl. Kongevej, and are based on the actual remediation taking place at Gl. Kongevej, with Geoprobe injection of substrate and bacteria every 25 cm. At Sortebrovej the remediation strategy is different, because injections have been performed by gravitation, and the injected substrate and bacteria are assumed to have spread only in the naturally active sandstringers present every meter.
It should be noted that the termination criteria given as aqueous concentrations, Caq, in the table are only guiding as these are not directly measurable on site. This is due to the fact that water samples from clayey till originate from high permeable reactive zones as discussed in section 5.9.1.
Table 9 - Comparison of the modeling results of the three sites. Time in years
| Parameters | Vadsbyvej (hotspot 2) | Gl. Kongevej | Sortebrovej |
| Remediation time for mass reduction of 90% | Base – >2000 A – >2000 B – 44 C – 28 |
Base – 775 A – 690 B – 31 C – 13 |
Base – 54 A – 39 B – 20 C – 4.2 |
| Remediation time to reach actual criteria | Base – 700 B – 40 C – 25 |
Base – 1300/755* B – 40/30* C – 18/12* |
Base – 98 B – 29 C – 5.4 |
| Remediation time to reach proposed remediation criteria | No new criteria proposed |
Base > 1500 B – 35 C – 18 |
Base – 116 B – 35 C – 5.6 |
| Proposed termination criteria (measurable values in the source zone) | Caq = 20 mg/L Ctot = 4 mg/kg Dech. deg. > 90% |
Caq = 15 mg/L Ctot = 3.3 mg/kg Dech. deg. > 90% |
Caq = 40 µg/L Ctot = 5 µg/kg Cmiddle aq = 20 µg/L |
A = degradation in horizontal features only
B = formation of a 10 cm reaction zone around horizontal features (spacing 25 cm for Vadsbyvej and Gl. Kongevej and 100 cm for Sortebrovej)
C = degradation in the whole system
*First value corresponds to the remediation criterion in term of concentration in the source zone/second value corresponds to the criterion in term of flux to the aquifer
A comparison of the parameters used in the models for Vadsbyvej and Gl. Kongevej is performed in Table 10. This can explain the reasons of the differences between the model results for Vadsbyvej and Gl. Kongevej, in terms of clean-up times, baseline flux, and risk of flux rebound. Sortebrovej is not included in this comparison as a different model type as been used (EPM).
Table 10 - Comparison of parameters between Vadsbyvej and Gl. Kongevej
| Parameters | Vadsbyvej (hotspot 2) | Gl. Kongevej | Effect on results |
| Thickness of contaminated clay Tclay (m) |
11 | 5 | Higher flux peak for Vadsbyvej |
| Fracture spacing 2B (m) |
5.6 | 2 | |
| Recharge R (mm/year) |
86 | 100 | |
| Flow per fracture (m³/year/m) |
0.47 | 0.20 | The total flux from the source is higher at Gl. Kongevej (see Table 11) |
| Main compound | PCE | TCE | The peak flux following beginning of dechlorination is higher at Vadsbyvej |
| Source distribution | Heterogeneous | Homogeneous | Dechlorination is slower in the high concentration zones at Vadsbyvej, giving longer cleanup times |
| Average total concentration (mg/kg) | 34 | 30 | |
| Average aqueous concentration (mg/L) | 22 | 40 |
The thickness of contaminated clayey till (Tclay) has a significant influence on the resulting contaminant flux to the underlying aquifer: given the same water flow and velocity in the fracture, the contact time between the clean water flowing in the fracture and the contaminated matrix increases with Tclay, increasing the flux and the concentration at the fracture outlet. This is illustrated in Figure 7.1 and explains the higher peak in the contaminant flux simulated at Vadsbyvej.
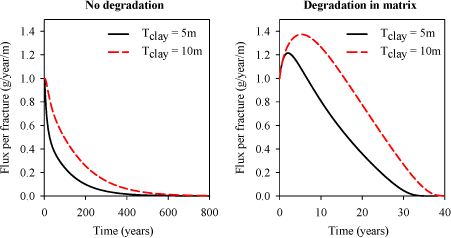
Figure 7.1 - Influence of Tclay (contaminated clay thickness) on the contaminant flux per fracture for no degradation (left) and degradation in the whole matrix (right). Note the different time scales in the two graphs.
Another important variable is the water flow per fracture, which is dependent on the net recharge and the fracture spacing. It can be seen that the net recharge for both sites (vadsbyvej and Gl. Kongevej) is almost equal, while the fracture spacing is much higher at Vadsbyvej, resulting in a higher flow per fracture.
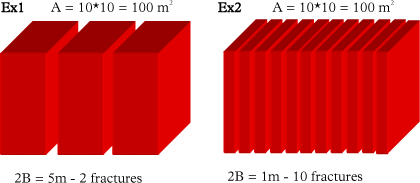
Figure 7.2 - Diagram of the two examples to illustrate importance of the water flow per fracture
The two geometrical configurations shown above are considered, with the following parameters:
- Net recharge R = 100 mm/year, which gives a water flow through the source area of 10 m³/year
- Initial aqueous concentration C = 10 mg/L
The two configurations are compared for the case of leaching only.
Example 1 would correspond to Vadsbyvej, while example 2 would correspond to Gl. Kongevej. The comparison between these two cases in Table 11 illustrates the different between the two sites:
- In case of high flow per fracture (Ex1), the concentration at the fracture outlet decreases much faster than for the case of low flow per fracture (Ex2) (first line in Table 11)
- Given the higher water flow per fracture for example 1 (5 vs. 1 m³/year), the contaminant flux per fracture is almost similar for both cases (second line in Table 11)
- This flux per fracture is multiplied by 2 for example 1 (only two fractures) and by 5 for example 2 (five fractures), resulting in a much higher total contaminant flux for the case with a small fracture spacing (Ex2) (third line in Table 11)
The resulting contaminant fluxes are very different for the two cases, despite the same recharge, concentration and source area. In case of a high fracture spacing (distance between two fractures is high), the flux decreases very fast and maintain a very low level after 20 years. In case of a small fracture spacing, the flux decreases much slower.
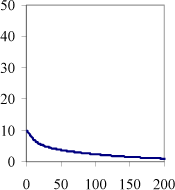
Table 11 – Comparison between the two examples (for the case of leaching only, no degradation) in term of concentration and flux. Horizontal axis is time in years
| Variables | Example 1 – 2 fractures | Example 2 – 10 fractures |
| Concentration at the fracture outlet (mg/L), as a function of time (years) | 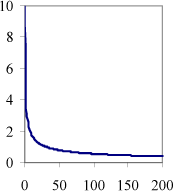 |
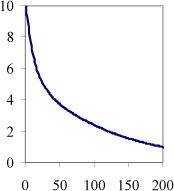 |
| Flux per fracture (g/year), as a function of time (years) | 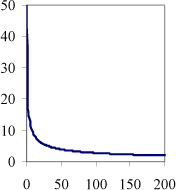 |
 |
| Total flux (g/year), as a function of time (years) | 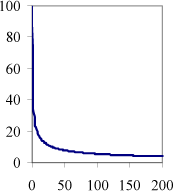 |
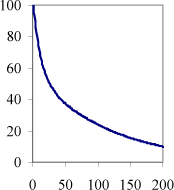 |
Another significant difference between Vadsbyvej and Gl. Kongevej is the parent compound present in the source, with PCE for Vadsbyvej and TCE for Gl. Kongevej. This has an influence on the risk of peak contaminant flux during dechlorination, as the difference of sorption coefficients between the parent and the daughter products is higher for PCE, increasing the probability of having a significant peak of concentration at the outlet.
Finally the distribution of the source is also different between the two sites. The heterogeneous distribution assumed at Vadsbyvej results in zones with very high concentrations (compared to the average concentration). Due to the competitive inhibition dechlorination model, these high concentrations inhibit dechlorination and the degradation is slowed down in these zones. Hence clean-up times are longer for Vadsbyvej. The homogeneous distribution assumed at Gl. Kongevej could also be modified to heterogeneous if further site investigations would suggest so.
Sortebrovej is not included in this comparison, because the difference in the modeling results comes primarily from the assumption that advective flux (and not diffusive) is dominant in the clayey till and that Equivalent Porous Medium (EPM) model can be used. In this kind of model, the fractures and high permeability features are not explicitly modeled but are taken into account indirectly in the bulk hydraulic conductivity defined for the clayey till. This assumption results in a faster transport in the clay (no diffusion limitation) and so a faster remediation. This kind of model would be completely out of range to simulate transport at sites where diffusion is supposed to be the limiting process, such at Vadsbyvej and Gl. Kongevej. Further investigations need to be done in order to conclude on the validity of EPM model for Sortebrovej.
7.2 Recommendations for definition of remediation criteria
The recommendations in terms of defining remediation objectives as described in Section 2.2 can be sharpened. In Section 2.2 a set of functional remediation objectives was described which combined a long term objective for the groundwater zone and a more short term objective for the source zone. The long term objective defines the concentration levels that ultimately can be accepted in the groundwater at a specific downgradient distance from the source. The model results showed that in addition to specifying the downgradient distance of the compliance point it is also important to specify the depth of the control plane considered as the modeled groundwater concentrations will depend on this. Thus there can be a large difference in averaging the concentration over e.g. 10 meter of aquifer or over the depth of the plume only. An even more risk conservative approach could be to define the remediation objective as the compliance with groundwater quality criteria in the maximum concentration zones in the plume at the chosen compliance point.
In addition to the long term remediation objective, it can be beneficial to define a separate remediation objective for the source zone in the clay till. This source zone remediation objective is useful for determining when the stimulation with donor and bacteria can be terminated. As shown for the Gl. Kongevej and Sortebrovej sites it is possible to determine this by calculating backwards from the long term remediation objective to an acceptable concentration level in the source zone. As discussed earlier, the remediation objective for the source zone should be defined based on total concentrations and not only water concentration, as water concentration can be misrepresentative of the system as they originate from the more reactive zones in the clay till. For the same reason it cannot be expected that the water samples from the source zone compare well with the average pore water concentrations calculated with the model. Thus, to compare model output for the source zone with field data is only possible for the total concentrations. Furthermore, the modeling results clarified that defining a remediation criterion as a reduction in contaminant flux with a certain factor does not imply that the average source concentration is reduced with the same factor. This is due to the fact that the contaminant flux is depending on the concentration in the fracture outlet and not in the average source concentration. This should also be kept in mind when remedial objects are defined for fractured clay till source zones.
An important finding from the modeling scenarios was that it is necessary to take the risk of rebound into account when defining the remediation objective for the source zone. If a large part of the contaminant mass in the source has not been converted to ethene before the enhanced remediation is stopped, then there is a risk that the contaminant flux will increase to an unacceptable level. Therefore it is important to specify the dechlorination degree that needs to be achieved in the source zone in addition to the remediation objective given as the total concentration. For the cases of Vadsbyvej and Gl. Kongevej, a dechlorination degree of 90% was necessary to ensure efficient remediation of the source zone.
7.3 Recommendations for field investigations prior to and during remediation
General recommendations are given in (Miljøstyrelsen 2008b) regarding field investigations. In this part we focus on field investigations that could improve model predictions and accuracy. Some important parameters and processes need to be characterized on site, in order to achieve a better model prediction of the flux and behavior of remediation treatment.
A good geological characterization is needed, in term of properties of the geological layers and distribution of fractures and sand lenses in the clayey till. A good hydrogeological characterization is also needed, as it is shown in this study that an accurate water balance for a given system is essential in order to obtain good modeling results. The water balance at both Vadsbyvej and Sortebrovej should be improved to sharpen the conclusions from the model.
Another crucial aspect for the success of ERD treatment is the microbial parameters (biomass concentration, degradation rates and localization of dechlorination). Further knowledge needs to be acquired in the area. This can be achieved by core sampling, in order to study the ability of the bacteria to enter into the matrix and the extent of dechlorination inside the matrix and obtain a better characterization of the parameters influencing microbial processes.
The collection of soil samples was also shown to be crucial to study the real extent of the dechlorination in the system, as the water samples collected in the boreholes do not give a clear picture of the dechlorination processes. This is due to the fact that the boreholes draw water from the high permeability zones embedded in the clay, where dechlorination is favored.
7.4 Recommendations for use of reductive anaerobic dechlorination
Recommendations can be made on the choice of enhanced reductive dechlorination in till, based on the application of the modeling tool to the sites. It is clear from the results that ERD seems more favorable for Gl. Kongevej than for Vadsbyvej. ERD is expected to be more adapted to the sites with a relatively thin contaminated clay layer (5 meters for the case of Gl. Kongevej compared to 11 meters at Vadsbyvej), as this will reduce the risk of increasing the contaminant flux after initiation of dechlorination.
The injection interval is also a crucial parameter and needs to be adapted to the expected development of the reaction zone in the clay matrix. The injections at Gl. Kongevej have been performed with an interval of 25 cm, but if the reaction develops only in a 10-cm thick zone around the injection depth, the diffusion limitation is not completely overcome. An injection interval of 10 cm would correspond to remediation C, where degradation occurs in the whole matrix, and divide the cleanup time by 3.
The dominant compound at a site is also an important factor, as reductive dechlorination occurs faster in case of domination of less chlorinated compounds (cis-DCE vs. PCE for example), and the risk of rebound is lower.
When evaluating the choice of remediation technologies, two parameters should then be carefully studied:
- Thickness of the contaminated clayey till
- Dominant compound in the source zone
7.5 Recommendations for improving modeling tool
Several improvements could be made on the modeling tool, in order to obtain a better representation of the reality, both on the modeling of the geological media and the processes:
- The present model takes into account only the vertical fully penetrating fractures, but it is known that the fracture networks have much more diversity and other features should be included in the model, like horizontal fractures, sand lenses, sandstringers, and partially penetrating vertical fractures.
- The present model assumes that the water is only flowing through the fracture network (and not in the matrix), but for cases where the clay has a higher hydraulic conductivity (due for example to a high sand content), it can be expected that water will also flow in the matrix. The hydraulic modeling should be improved to take this phenomenon into account and to produce an accurate water balance in the system.
- The present model assumes that substrate and electron donor are available without limitation. In order to simulate the lifetime of the injected substrate and to produce some estimations of the required injection frequency for a given site, the reactive model should include the consumption of the injected substrate during dechlorination. Methane production should also be considered, as it represents a risk when applying reductive dechlorination at a site.
- The development of the reaction zones in the matrix has to be further investigated, specially to identify the controlling parameters. One of the assumptions from the limited field results suggest that the extent of such reaction zones depend on the thickness of the high permeability features (cm for hydraulically created fractures vs. mm for naturally occurring sandstringers). This phenomenon has to be studied with both modeling and experiments.
Version 1.0 July 2009, © Danish Environmental Protection Agency