Model assessment of reductive dechlorination as a remediation technology for contaminant sources in fractured clay: Case studies
6 Sortebrovej
- 6.1 Characterization of contamination source
- 6.2 Hydrogeological characterization
- 6.3 Use of EPM model
- 6.4 Enhanced reductive dechlorination
- 6.5 Model configuration and scenarios
- 6.6 Model results
6.1 Characterization of contamination source
The source zone has an area of 750 m², between 13 and 20 meters below surface (mbs). No hotspot has been identified at the site. Limited reductive dechlorination has been observed at the site and the main pollutant is TCE. The total mass of TCE at the site is estimated to 20 kg (Fyns Amt 2004). This estimate corresponds to an average total concentration of TCE of 2 mg/kg, assuming a bulk density ρb of 1.95 kg/L. In (Fyns Amt 2004), the sorption coefficient Kd for TCE is assumed to be equal to 0.06 L/kg and the matrix porosity φ to 0.28, which gives an aqueous concentration in TCE CwTCE = 9.35 mg/L (following Eq. ). It has to be noticed that the sorption coefficient is 10 times lower than the ones used for Vadsbyvej and Gl. Kongevej. This value is used in the present study, as it is calculated as a site specific value in (Fyns Amt 2004).
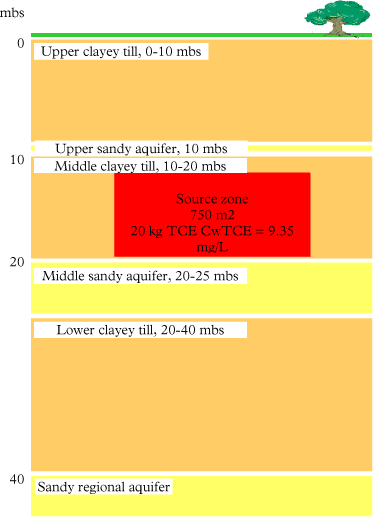
Figure 6.1 - Simplified geology and source zone
In this work, the model will focus on the leakage of contaminant from the source zone in the clayey till to the middle sandy aquifer.
6.2 Hydrogeological characterization
The hydraulic values (hydraulic conductivities and gradients) for middle clay layer and the underlying middle sandy aquifer are taken from (Fyns Amt 2004) and (Fyns Amt 2006b) and summarized in Figure 6.2. The bulk hydraulic conductivity is obtained from three slug tests performed in the clay layer, and the matrix hydraulic conductivity Km from permeability tests performed on core samples from the clay layer. The vertical hydraulic gradient was calculated based on potential maps of the upper and the middle sandy aquifers (Fyns Amt 2006b). It can be seen that the bulk hydraulic conductivity for the clayey till is large and corresponds most probably to the numerous sand lenses that are present at the site, but cannot be considered to be representative for the vertical transport through the clay layer.
The annual groundwater recharge to the regional aquifer in the area is estimated to be around 75 mm/year (Fyns Amt 2004), which together with the vertical hydraulic gradient would correspond to a vertical bulk hydraulic conductivity of 2*10-9 m/s.
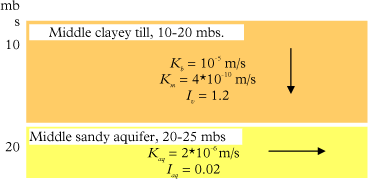
Figure 6.2 - Hydraulic characteristics for clayey till and middle sand layer
It has been decided to make a simple equivalent porous media (EPM) model for this site (instead of a discrete fractures model), as the till present at Sortebrovej contains numerous horizontal sand lenses/stringers. The importance of these lenses can be seen in the high hydraulic conductivity measured at the site in the middle clayey till (10-5 m/s), which suggests that the water flow occurs in significant amount in the matrix itself. The implications of the use of this simplified model are discussed in the next section.
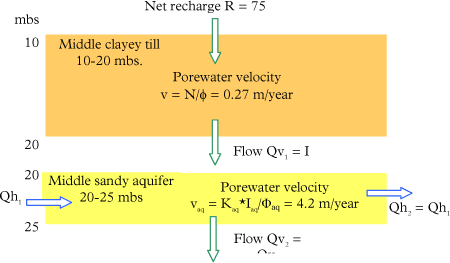
Figure 6.3 - Model simplifications to EPM
6.3 Use of EPM model
In the current practice, the fractured clayey till is usually modeled/handled as an equivalent porous media, for risk assessment or remediation planning purposes. This is for example the case at Vadsbyvej, where the expected contaminant flux was calculated based on the bulk hydraulic conductivity and the hydraulic vertical gradient observed in the clay till (Region Hovedstaden 2008b) . Therefore it was decided to use this type of model (EPM) in the present report for one of the cases, on order to illustrate the differences in the two approaches. Sortebrovej is the most suitable site for the use of such a model, because of the important presence of sand lenses in the clay and the fact that advective flux is expected to occur in the matrix.
However this does not mean that EPM model is truly representative of the flow system at Sortebrovej, and this has to be seen as an illustrative example of the use of EPM model to simulate fractured media. The results from an EPM model differ from a discrete fracture model, as the system is no longer limited by diffusion of contaminant in/from the matrix. Therefore such models are expected to provide more optimistic results in term of remediation time. The differences between the results for Vadsbyvej/Gl. Kongevej and Sortebrovej will be mainly due to the use of a different model type, where advection is assumed to be the dominant process in the matrix.
6.4 Enhanced reductive dechlorination
Remediation based on ERD was started in 2005 in the source zone with the injection of substrate (EOS emulsion) and specific degraders (KB1 culture including bacteria of the genus Dehalococcoides) in 39 injection boreholes in the source zone and the underlying sandy layer (Fyns Amt 2006a). In order to facilitate the spreading of the injected material in the naturally occurring sandstringers, the injection boreholes consist of 2-3 screens, whose depths are chosen depending on the occurrence of sandstringers during drilling. Therefore the screens are not located at the same depths in the different boreholes. The number of boreholes, which are screened at a particular depth is shown in Figure 6.4. The depth is divided into 10 cm interval, corresponding to the available data from the drilling journal. It can be seen that in the clayey till (10-20 mbs), injection has occurred in at least 20 boreholes throughout the layer. This means that for each 10 cm interval, substrate and bacteria have been injected in at least half of the boreholes in the source zone.
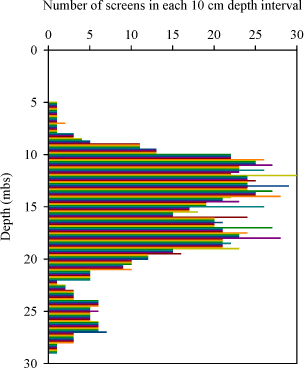
Figure 6.4 – Number of boreholes screened as a function of depth. The interval between data is 10 cm (based on the available data).
The injection method used is termed “gravity injection”, which means that injected material is driven by gravity and that no added pressure is used (conversely to Gl. Kongevej). This means that the material is expected only in the hydraulic active sandstringers (Miljøstyrelsen 2008b). A detailed study of the occurrence of sandstringers as a function of depth is beyond the scope of this study, but simple calculations have been performed, on the available data from the drilling journal, in order to get an idea of the spreading frequency of the substrate and bacteria over depth. Between 10-20 mbs, a frequency of one sandstringer per meter was observed in the boreholes and this estimation will be used for the rest of this study.
6.5 Model configuration and scenarios
As for Vadsbyvej and Gl. Kongevej, the model is used for a baseline scenario (no remediation) and different remediation scenarios corresponding to different possibilities for dechlorination locations.
- Baseline = no dechlorination occurs in the source zone.
- Remediation A = degradation in the naturally occurring sandstringers only: degradation occurs in one feature per meter, which corresponds to the estimated frequency of lenses over depth
- Remediation B1 = degradation in the sandstringers and in a 2 cm thick reaction zone in the surrounding matrix. This scenario corresponds to measurements on core samples performed two years after initiation of dechlorination (Region Syddanmark 2008b)
- Remediation B2 = degradation in the sandstringers and in a 10 cm thick reaction zone in the surrounding matrix.
- Remediation C = degradation in the entire matrix
6.6 Model results
6.6.1 Model parameters
Table 6 - Model parameters for Sortebrovej
| Transport parameters | Value | Reference | |
| Net recharge R [mm/year] | 75 | (Fyns Amt 2004) | |
| Vertical hydraulic gradient Iv [m/m] | 1.2 | (Fyns Amt 2006b) | |
| Bulk hydraulic conductivity Kb [m/s] | 2*10-9 | ||
| Porevelocity in EPM [m/y] | 0.27 | ||
| Matrix porosity φ | 0.28 | (Fyns Amt 2004) | |
| Bulk density ρb [kg/L] | 1.96 | ||
| Tortuosity τ | 0.28 | τ = φ (Parker et al. 1994) | |
| Longitudinal dispersivity in EPM α [m] | 1 | assumed | |
| Sorption coefficient Kdi [L/kg] | (Fyns Amt 2004) | ||
| TCE | 0.06 | ||
| DCE | 0.012 | ||
| VC | 0.004 | ||
| ETH | 0 | ||
| Biogeochemical parameters | |||
| Maximum growth rate µi [1/d] | |||
| TCE | 2 | (Miljøstyrelsen 2008a) | |
| DCE | 0.38 | ||
| VC | 0.14 | ||
| Specific yield Y [cell·µmol/L] | 5.2*108 | ||
| Biomass concentration X [cell/L] | 3*108 | Measured (Miljøstyrelsen 2008b) | |
6.6.2 Mass removal and contaminant flux in the source zone
The source depletion and contaminant flux as a function of time are compared for the different scenarios in Figure 6.5 and Figure 6.6. At first it can be seen that these curves differ from the results of Vadsbyvej and Gl. Kongevej, due to the use of an EPM model instead of a discrete fracture model. As explained in Section 6.3, advection is the dominant process in an EPM model, whereas discrete fracture model are controlled by diffusion process, therefore the modeling results differ, both in term of remediation time and contaminant flux:
- the mass removal for the baseline scenario is 10 times shorter (100 years of leaching)
- the flux curves have very different trends: when a model includes discrete fractures, a fast decrease is expected at very short times, whereas for an EPM model, the flux remains high during the first decades
The scenario with degradation at the sandstringers only (A) differs from the baseline scenario, as the transport of contaminant from the clay to these high permeability zones is controlled by advection and not by diffusion alone.
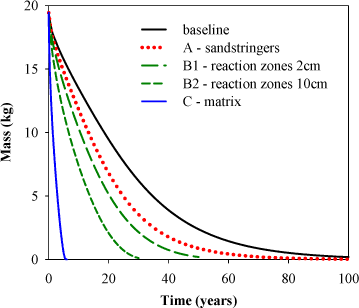
Figure 6.5 - Mass removal with time at Sortebrovej
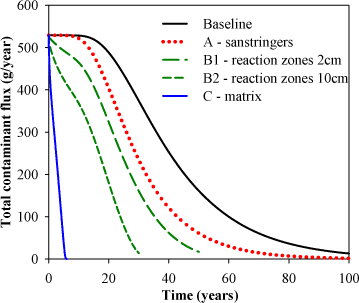
Figure 6.6 – Contaminant flux from the source with time at Sortebrovej
In the presence of a reaction zone around the stringers (B1 and B2), the mass removal occurs faster (30 and 20 years respectively). The cleanup time reduces to 4 years when dechlorination is assumed to occur in the whole system (C). Conversely to the previous sites, it can be seen in Figure 6.6, that the total contaminant flux does not increase after injection when dechlorination occurs in the matrix (B and C). This is quite different from model results at the previous sites and this is due to the assumption of relatively low sorption coefficients (10 times lower than for Vadsbyvej and Gl. Kongevej), resulting in small differences in the retardation factors of the different compounds. These lower sorption coefficients were taken from the calculated sorption coefficients for Sortebrovej given in (Fyns Amt 2004).
6.6.3 Concentration in the underlying sandy aquifer
The underlying sandy aquifer is modeled with the simple 2D steady-state cross-section of the aquifer. The contaminant source is defined with the resulting flux from the EPM model. Unlike the aquifer model for Vadsbyvej and Gl. Kongevej, the bottom of the aquifer is not impermeable, and the net recharge flux is assigned as the boundary condition (see model in Figure 6.3).
Table 7 - Parameters for the middle sandy aquifer
| Parameters | Symbol | Value | Unit | Reference |
| Aquifer thickness | Taquifer | 4 | m | (Fyns Amt 2004) |
| Hydraulic conductivity | Kaq | 2*10-6 | m/s | |
| Horizontal hydraulic gradient | Iaq | 0.02 | - | |
| Effective porosity | φaq | 0.3 | - | |
| Recharge rate | R | 75 | mm/year | R = Kb*Iv |
| Longitudinal dispersvity | αL | Not sensitive | m | (Miljøstyrelsen 2008a) |
| Vertical transverse dispersivity | αT | 0.04 | m | (Fyns Amt 2004) |
| Source width | W | 27.5 | m | See Figure 6.1 |
The resulting contaminant plume is shown in Figure 6.7. The average concentration (over 4 meters thickness) is 40% just downstream of the source and 4.3% at 100 meters downstream.
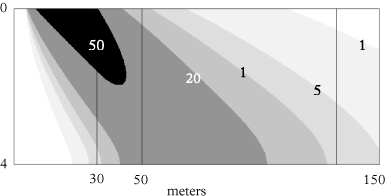
Figure 6.7 - Concentration in the underlying aquifer at steady state, given in percentage of concentration at the outlet of the source
6.6.4 Concentration in the regional sandy aquifer
The regional sandy aquifer (lower aquifer) is modeled with the simple 2D steady-state cross-section of the aquifer. The contaminant source is defined with the resulting flux from the upper sandy aquifer model.
Table 8 - Parameters for the regional sandy aquifer
| Parameters | Symbol | Value | Unit | Reference |
| Aquifer thickness | Taquifer | 12 | m | (Fyns Amt 2004) |
| Hydraulic conductivity | Kaq | 1.7*10-4 | m/s | |
| Horizontal hydraulic gradient | Iaq | 0.003 | - | |
| Effective porosity | φaq | 0.3 | - | |
| Recharge rate | R | 75 | mm/year | R = Kb*Iv |
| Longitudinal dispersvity | αL | Not sensitive | m | (Miljøstyrelsen 2008a) |
| Vertical transverse dispersvity | αT | 0.04 | m | (Fyns Amt 2004) |
| Source width | W | 150 | m | See Figure 6.7 |
The resulting contaminant plume is shown in Figure 6.8. It can be seen that the concentration in the plume is approximately 1% of the concentration at the outlet of the source.
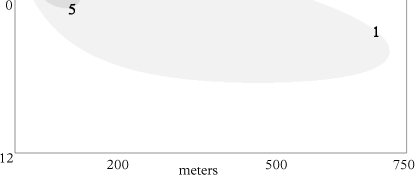
Figure 6.8 - Concentration in the regional sandy aquifer at steady state, given in percentage of concentration at the outlet of the source (given in Figure 6.10)
6.6.5 Comparison with remediation criteria
The remediation criteria defined for Sortebrovej have been presented in Section 2.2.4. The termination criterion was suggested to be the reduction of concentration levels in the source zone to 100 µg/L. This concentration will be calculated as the average of the measurements at 13 boreholes at the field site.
As explained previously (see Section 5.6.5), the average concentration in the source zone does not correspond to the concentration in the leachate from the source. In case of an EPM model, the average concentration in the source will decrease faster than the concentration in the leachate (conversely to the case of discrete fracture models), because in case of an EPM, the source is leaching from “top to bottom”, as shown in Figure 6.11.
the leachate aqueous concentration is plotted as a function of the average aqueous concentration in Figure 6.9, and it can be seen that an average concentration in the source zone below 100 µg/L corresponds to a leachate concentration around 250 µg/L at the bottom of the source.
It can be seen in Figure 6.10, that this remediation criteria is expected to be reached after:
- 98 years for the baseline scenario
- 29 years for remediation B2
- 5.4 years for remediation C
This corresponds to an average total concentration in the source zone of 15µg/kg, so a reduction by a factor 100 compared to the initial total concentration (2 mg/kg).
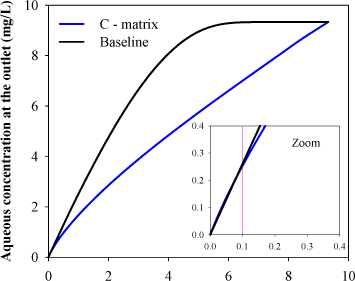
Figure 6.9 – Aqueous concentration in the leachate as a function of the average aqueous concentration in the source zone. Pink line in the zoom show the defined remediation criterion (average aqueous concentration levels in the source zone below 100 µg/L)
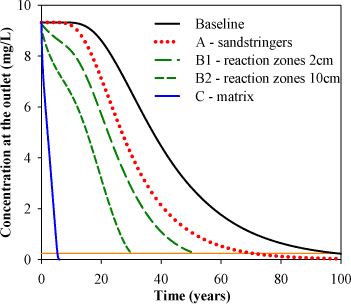
Figure 6.10 - Concentration in the leachate entering the middle sandy aquifer from the middle clay. In orange the remediation criteria (C = 250 µg/L)
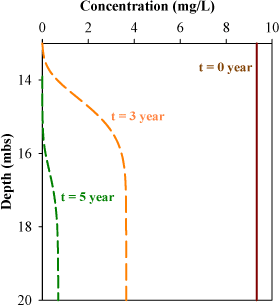
Figure 6.11 - Aqueous concentration throughout the source zone for remediation C, at time 0, 3 and 5 years
The concentration in the middle sandy aquifer for this defined remediation criterion is assessed based on Figure 6.7, where it can be seen that on the whole model domain the average concentration is 18% of the leachate concentration from the source. This means that the average concentration in this aquifer will be around 45 µg/L when the criterion in the source is fulfilled.
The modeling results for the regional sandy aquifer have shown that the concentration here is about 20 times lower than the concentration in the middle sandy aquifer. Therefore in order to ensure that the quality standard are fulfilled in the regional aquifer (concentration below 1 µg/L), the concentration in the middle sandy aquifer should be below 20 µg/L. This means that the concentration in the leachate from the source has to be maintained below 100 µg/L.
It is recommended, based on model results that the remediation criterion actually defined for Sortebrovej is revised to include criteria on both the concentration in the source zone (clay) and in the middle sandy aquifer. The criterion for the middle sandy aquifer has to be set to 20 µg/L, as there is a reduction factor of 20 to the regional aquifer. The criterion for average aqueous concentration in the source should be decreased to 40 µg/L and include a criterion for total concentration below 5 µg/kg. However the model parameters used for this estimation are very uncertain and a better characterization of the hydrogeology and particularly of the water balance of the different geological layers need to be performed to set-up accurate remediation criteria.
Version 1.0 July 2009, © Danish Environmental Protection Agency