Water Prices in CEE and CIS Countries. Volume II: Case Studies
Chapter 6.Demand for water and affordability
6.1 Demand for water
PWiK revenues depend on the quantity of water and wastewater services sold to different consumer groups. Therefore it is important to predict how the quantity of water demanded will respond to the increasing tariffs. Tariff is not, of course, the only factor influencing demand. The set of factors differs in importance for major consumer groups such as: industry, agriculture, institutional users and households. Here we deal only with households.
6.1.1 Households demandConsumer taste and income are major determinants of water demand. Availability and prices of technical options for water savings are also important factors, particularly when the average income is increasing.
As households' wastewater bills are normally based on water consumption, the households' demand for wastewater services is therefore embodied in the demand for water services. Consequently, the relevant price variable determining the demand for water is not simply the water tariffs but the combined water and wastewater tariffs.
A high level of per capita consumption allows a quick reduction in water use, since the reduction can be achieved through simple measures. This is usually the case when very low tariffs are drastically changed. This is no longer the case in Poland. The next change depends largely on the income position of the households. Real price increase results in lower consumption but for low income households it is the result of cutting back consumption at the expense of convenience. Higher income households reduce their consumption through investments in water savings that allow them to maintain the same level of convenience.
In Poznan, household water demands have fallen by approximately 20% over the last five years, as illustrated in the figure below. They have now reached a level of approx. 140 lcd. This is still slightly higher than the low levels reached in some large Scandinavian towns (e.g. Copenhagen 121 lcd). However, the room for "easy" reductions is clearly exhausted and further reductions are likely to require significant changes in water use habits.

Figure 6.1:
Development of Water Consumption in Poznan 1994 - 1999
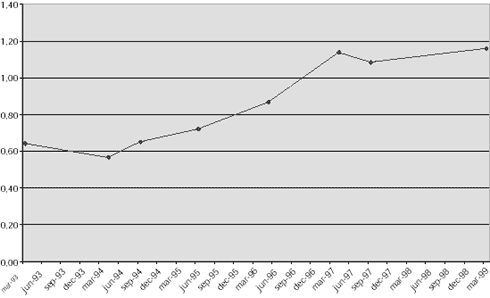
When comparing the development of water consumption with the increase in real tariffs, it can be seen that the reduction of water consumption took place from 1993 to 1997, which is also the period when consumers experienced a major increase in real tariffs. Since 1997, the increase in real terms has been very modest.

Figure 6.2:
Development of water (+wastewater) tariffs in real terms (1993 PLN)
Given that the water demand is already quite low, and that affordability for most income groups is reasonably high, the probability for a sharp decrease in water consumption, in response to future tariff increases, is not very high. As it is assumed in the feasibility studies, some decline can be predicted but it is likely that the consumption level would be stabilized in few years time due to income increases and exhausting the technical options for water savings.
6.2 Ability to payThe ability to pay assessment is usually limited to a comparison of expenditure on water and wastewater services to the average disposable income. Problems with ability to pay, however, appear in lower income families. In the assessment of the acceptance of higher tariffs and the likely revenue stream after tariffs increase the impact on lower income groups must be analysed.
In case of wide range of income distribution even if the average family disposable income allows tariff increase, the large group of poor households can threat acceptance and undermine the revenue predictions through non-payment. On the other hand, if the tariff increase is affordable for average income families but too high burden for small group of poor families a well designed subsidy schema can smooth the way of implementing the higher tariffs.
Major problem with affordability analysis beyond the rule of thumb approach is the difficulties to get the region/city specific income distribution data.
Statistical data are usually available at the national level. These might be used as proxy for overall income distribution data. When city specific income data are difficult to get efforts to collect city specific income data could be concentrated on determining the minimum income level and ratio of households living at or below that level.
6.3 Availability of dataPoznan city specific disposable income and expenditure data is available for 1996 only. Poznan region specific data can be obtained from the national household expenditure survey for 1998.
The problems with that data:
| there are no income groups created and organised information accordingly; | |
| the sample size for Poznan region for the different occupational groups is not known but is likely too low to make statistically sound conclusions. |
National data are available for 1997 but also only according to occupational groups.
6.4 Income distribution assessmentIncome distribution is shown below by occupational category for Poznan relative to the rest of Poland. The share of water/wastewater expenditures in total expenditures is also shown for these groups.
Table 6.1:
Income and Water Expenditures in Poznan and Poland

Bearing in mind the caveats with regard to data quality mentioned above, the income distribution in Poznan doesn't seem excessively skewed. The families receiving social assistance comprise about 4% of the households. These can be considered the low income families.
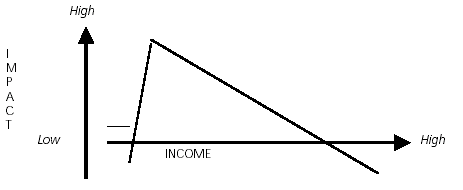
Representatives of Department of Health and Social Affairs, Poznan City Administration inform that the poorest 4-5 %of the population de-facto will not be affected a lot of higher water prices. Already now many people in this group does not pay for water but are dependent on various subsidies to cover daily costs. Rather, the impact will be felt heavily by those not living on subsidies but a small personal income. The possible distribution of real impact is illustrated below.

Figure 6.3:
Simplified illustration of the impact of higher water tariffs
The socio-economic impact of a high level of investments and thus tariff increases might have as a sideeffect that the municipality would have to allocate more resources to subsidies.
Moreover, there is a political dimension to this. The UW voter segment belongs to the better off part of the population - the people least affected by water tariff increases - whereas SLD voters typically will be among those mostly effected. This may also explain why the UW party in particular favours water tariff increases, whereas the AWS party and the SLD party may calculate that increases in water tariffs will burden their voters.
6.5 Concluding remarkIn Poznan there is not likely to be a major affordability issue for tariff increases of the volume being discussed in this report (approximately + 20%)