Water Prices in CEE and CIS Countries. Volume II: Case Studies
Chapter 5.
Willingness to Pay
5.1 Introduction
The objective of this chapter is to present the methodology applied and the results of the stated preference based survey for finding willingness to pay.
The methodology comprises a number of steps. These include background research, qualitative research and quantitative research. Each of the steps is discussed in the section on methodology.
The quantitative research is based on interviews with 150 consumers living in Kaliningrad and being responsible for paying the household water bill. The respondents are already in an expenditure survey panel, so the information on the respondents is not limited to the content of the stated preference survey.
In order to assess the willingness to pay a stated preference approach has been used, and the results indicate some willingness to pay. There is willingness to pay to improve water quality and to get 24 hours supply with consistently high water pressure.
5.2 Stated preference survey methodologyThe method applied in this stated preference survey contains a number of tasks. These include:
- Background research
- Qualitative research
- Design of questionnaire
- Pilot survey
- Final survey
- Data analysis.
Each of the tasks is elaborated in the following paragraphs.
5.2.1 Background researchThe first step in the analyses is background research. The purposes of the background research are to:
| Understand the realistic technical options/alternatives and in particular their impact on realistic service levels; | |
| understand payment collection, enforcement and usage measuring princi-ples and practices, and the financial standing of the utility; | |
| understand the socio-economic context, in particular income levels and di-stri-bution and types of households. |
The background research in Kaliningrad have also included:
| Discussions with other team members covering technical and financial issues; | |
| consultation of earlier reports, statistics, working papers giving general introduction to the utility and the local economy in Kaliningrad. |
Following the background research, qualitative research amongst customers is undertaken. The purposes of the qualitative research are to:
| Gain a first understanding of which service factors are perceived as important by consumers, and which factors are the more important; | |
| gain a first rough understanding of willingness to pay for improved water services and the most important factors; | |
| understand the cultural context and formulations understood by consumers in relation to water and wastewater utilities. |
Two types of interviews were carried out in Kaliningrad. Six face-to-face interviews and one focus group with six respondents. An open-ended topic guide was applied in both types of interviews. However, they were each designed to the type of interview they were used.
The face-to-face interviews were conducted in an interview room. Two interviewers interviewed each respondent with consecutive translation by a professional interpreter. Each interview lasted between 50 minutes and 60 minutes.
The focus group was carried out with simultaneous translation. The topic guide was translated into Russian and in addition two option pairs were presented to test willingness to pay. The moderator was from the local consultant and she was briefed before the focus group took place. The respondents sat round a large table with the moderator. The research team sat at another table a few metres away with an interpreter who provided consecutive translation of the moderator and the respondents. The focus group lasted about one and a half hours.
It was decided that the interview team would not interfere in the conduct of the group regardless of what happened so that the method could be tested.
5.2.3 Design of questionnaire
On the basis of the information gathered in the background research and the qualitative work the questionnaire is designed. The questionnaire includes:
| present water and wastewater services; | |
| attitude toward the water services; | |
| willingness to pay for improvements; | |
| socio-economic background. |
Many subjects can be covered by a questionnaire. However, a selection has to be made in order to keep the length of an interview acceptable to the respondent. Therefore e.g. wastewater treatment has not been covered in depth in the research for Kaliningrad.
A long list of possible improvements to the water services was identified in the qualitative research. The possible changes in service levels are divided into three groups. The most important services are included in a stated preference game as described below, but only a limited number of services can be evaluated in the stated preference game. Importance-rating questions are included in the questionnaire to have the respondents' evaluation of other services. Finally, some possible changes of service levels were assessed to be of minor relevance/importance and they have not been included in the questionnaire.
The willingness to pay is examined by using stated preference games. An example of a choice task in the stated preference game is presented in Table 5.1. Here the respondent must decide whether she prefers to pay 50% more to have water that is always safe to drink, with no smell at all, and supplied 24 hours a day with good pressure or water as now and only 10% more expensive. If water quality and supply are important issues to the respondent A is preferred, if money saving is important to the respondent B is preferred.
Table 5.1:
Example of a choice pair

A number of choice-tasks like the above are presented to each respondent. There is a limit to the number of choices a respondent can undertake while remaining concentrated and giving a realistic choice. In Kaliningrad eight choice-tasks were presented to each of the respondents.
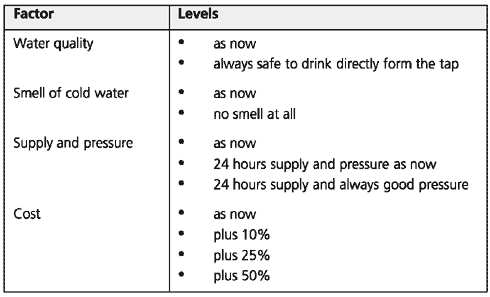
The stated preference game consists of four factors:
| water quality; | |
| smell of cold water; | |
| supply and pressure; and | |
| cost. |
The stated preference analysis is exploring the willingness to pay for improvements. Different levels represent each of the factors. The levels describe different service levels and they are the service levels that can be evaluated when analysing the game. For the service factors all levels as least as good as the present situation and the costs are only increasing compared to the present situation. The levels are described in Table 5.2.
Table 5.2:
Factors and levels in the stated preference game
Respondents
The respondents in the survey were chosen from the consumer panel in Kaliningrad. This should make the respondents representative to the entire population in Kaliningrad.
The consumers in the expenditure panel are chosen based on a list of the population in 1994. The population was divided into groups with similar characteristics, based on:
| age; | |
| gender; | |
| sources of income; | |
| level of education; | |
| size of household; | |
| type of living area, apartment; and | |
| availability of land for growing vegetables and fruits. |
The consumers in the expenditure panel are chosen randomly from the groups and hence representative to the general population. The respondents interviewed in the stated preference survey are a sub-sample of the respondents in the expenditure sample. Only respondents living inside Kaliningrad were interviewed. Hence, the results are representative to the inhabitants of Kaliningrad, and the sample need not to be weighted to represent the inhabitants.
5.2.4 Pilot surveyThe pilot survey is used to test the design of the questionnaire and to identify necessary changes.
In Kaliningrad, 25 interviews were conducted and the results were analysed. The answers are checked in order to ensure that all questions are well understood and that the stated preference game is working well. Checking the stated preference games includes assessing if all parameters are relevant to the consumers, and if the levels of e.g. cost are perceived to be within realistic limits. As an example if respondents choose alternatives with the lowest cost in most stated preference questions, the increases in cost levels should be adjusted down-ward. This was actually the fact in Kaliningrad.
5.2.5 Final surveyIncluding the changes to the questionnaire from the pilot makes the final questionnaire. 125 households where chosen from the expenditure panel and interviewed. The household member responsible for paying the water bill was interviewed.
5.2.6 Data analysisBoth the data from the pilot and the data from final questionnaire are included in the statistical analysis. This is possible because only few changes were made to the pilot questionnaire. However, where questions differ in the two versions the results from the pilot are excluded.
The stated preference data is analysed by applying advanced statistical tools. A so-called logit model is estimated. Before estimating the model a set of a priori hypotheses is described and these are tested in the model. Examples of such a priori hypotheses are:
| consumers with higher income have a higher willingness to pay; | |
| only consumers living on higher storeys are willing to pay for better water pressure. |
The model also allows for different willingness to pay for consumers with different background, e.g. age. However, all effects in the model must have a clear interpretation.
5.3 Qualitative researchThe qualitative interviews were based on two topic guides prepared by using background information about Kaliningrad, including information from the technical part of the team. One topic guide was designed for the in-depth interviews and another topic guide was designed for the focus group. To have a topic guide designed for the focus group is helpful for the moderator. Stimulus was used in the focus group in the form of choice pairs forming basis for discussion. Two stated preference choices were presented to the group for discussion.
The conduct of the focus group was relatively successful, particularly considering the lack of experience of the moderator. Some areas of discussion were not probed as much as we would have liked, with some group members occasionally dominating and others not being asked their opinions. Nonetheless, the group was satisfactory and useful, and the information provided by the focus group differed from that obtained by the in-depth interviews.
Obviously, awareness questions cannot be tested in a focus group without including e.g. a small questionnaire to be filled in individually by the group members.
5.3.1 Results from the qualitative researchRespondent characteristics
The respondents were chosen by the Regional Statistical Committee in Kaliningrad. The respondents were:
| predominantly female and middle aged, but all age groups were represented; | |
| all living in flats; | |
| representing a wide range of income groups; from 600 roubles per month for a twoperson household to 7,500 roubles a month for a household of two adults and a child; and | |
| mostly employed, many by the Regional Statistical Committee. |
Interviewees were asked to indicate on a map where they lived. This was because there are three sources of water in the city - one provides ground water and two provide water from the river. Some get water from a mix of sources. There was a good spread - five lived in the centre, two to the North West, one North, one North East, four in the South.
Finally, respondents were asked if they thought they would be better off financially next year. Most denied this.
It is assessed that the observed bias of the sample is not critical at this stage of the research because the coverage is still large.
Meters
None of the 13 respondents interviewed had a water meter although the payment for water was considered to be considerably less if a water meter was installed, since the current tariff is based on each person consuming up to 300 litres per day (depending of accomplishment of the apartments).
Five respondents wanted to get a meter. However, it was considered to be both very expensive and a complicated process. Some reported long waiting times, lack of information about how to get them, and further some expressed a need for two meters.
Information
The respondents receive information about water services by the Vodokanal. Leaflets, newspaper, television, etc distribute information on when water can not be drunk (e.g. in the summer when the winds blow from the West). Also information is usually provided about interruptions due to e.g. repairs. Word of mouth is also a useful source.
Water quality
Water quality is believed to be poor in general. The main problems are:
| None of the respondents drink the water straight from the tap. The respondents buy bottled water, particularly in summer when the tap water is bad. Some uses filters (although these are expensive), others keep reserves of water. This is typically from a well. | |
| Not 24 hours supply everywhere - five said no water at night (e.g. 00:00-6:00). | |
| Poor water pressure - five had poor water pressure. Some reported that this varied and even described it as causing an interruption in supply during summer when lots of people in the flats used water at the same time. Others mentioned poor water pressure for those in higher storeys, if there was no pump; | |
| Poor colour of water - two in the group reported reddish or yellowish water, one in the indepths interviews said the water was dirty. Those without 24 hours supply mentioned that the water is coloured immediately after it is reconnected. | |
| Sediment - some said there is sediment (lime scale) in the water. | |
| Smell - some mentioned a chemical smell, a smell of chlorine or a marshy smell. |
All but three get hot water from a central source. One said they only get hot water for two hours a day.
Wastewater
There was little knowledge about wastewater treatment. One was aware that work had started on a wastewater treatment plant but had stopped. A couple described the wastewater as bad.
When asked if the Pregolya River and the Kaliningrad Bay were polluted, almost all said that they are polluted: "No one swims in the river". One mentioned dead fish in the river, another bacteria in the lake. Most blamed the paper mill for the pollution and some said that since it had closed the river/bay was not so polluted. None mentioned that the pollution came from domestic waste.
Water bills and payment
All respondents paid for water as part of their household bill. Usually this is paid to Simplex or to a local housing office. The unit cost for most items in the household bill are multiplied by the number of household members. Privileges of typically 50% applies to the total, regardless of how many in the household are qualified for privileges. About half of the 13 respondents get privileges.
Payment is often not regular. Some do not pay their bills for months until some money comes in, e.g. from a husband fisherman returning after six months.
No one knew how the tariff for cold water and wastewater is split - it is not shown on the bills.
Only one person got a subsidy for about a third of the year (a household is entitled to a subsidy if the household bills are more than 19% of household income). A few said that they knew how to obtain the subsidy although it was re-por-ted as being very complicated.
Willingness to pay
In the in-depths interviews four out of six thought the price for water is reasonable. In terms of increase in water prices there was a very high awareness of the recent large increase in the water bill (after constant prices for a long time) although the fact that it was not linked to an improvement in quality was a source of annoyance to some. A few persons were aware that the increase was to pay for a loan.
By comparison, the prices of other utilities were seen as constantly increasing (electricity, in particular, was seen as much more expensive) and therefore there was not a general belief of water price increases being linked to other price increases.
The improvements that the respondents demanded in the in-depth interviews were: 24 hours' supply, a water meter, better water pressure, improved water quality, and to be able to drink water directly from the tap. The willingness to pay varied between 10% and 300%.
In the focus group the respondents were shown two option pairs as a stimulus for discussion. In both pairs the improvements were drinking water of good quality, 24 hours supply and high water pressure. All respondents were willing to pay 20% more for the improvements but none were willing to pay 100% more.
5.4 Quantitative researchIn this section the results of the quantitative questionnaire are presented. The socioeconomic characteristics of the respondents are analysed to get some background information about the households. The respondents in the sample are all responsible for paying the water bill.
5.4.1 Socio-economic characteristicsThere is an overrepresentation of women in the sample. 81% of the respondents are women. This is because women in Kaliningrad are often responsible for paying bills. The households interviewed in the survey represent both men and women; thus the results are interpreted as household results.
The age distribution is illustrated in Figure 5.1. All age groups are represented among the respondents.

Figure 5.1:
Age distribution of respondents
Most of the respondents do not have children living in the household. In 31% of the households there are children aged 6 to 17 years, and in 13% of the households there are infants less than 6 years old, cf. Table 5.3. Most of the households with children have only one child living in the household.
Table 5.3:
Type of household

All households live in apartments and almost all households live on the first to fifth floor. The employment status of the chief earner is shown in Figure 5.2. A majority of the respondents are employed, mostly in the public sector. The chief earner is retired in a large proportion of the households, cf. Figure 5.2.
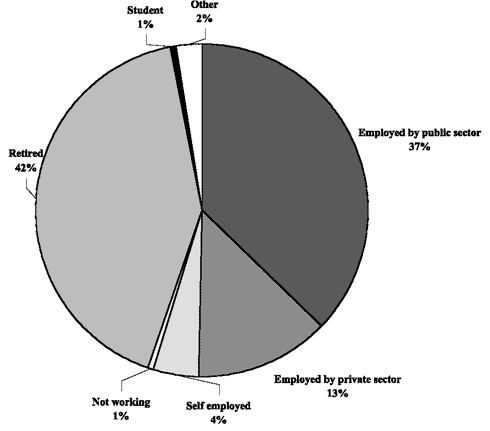
Figure 5.2:
Employment status of the chief earner of the household
The total expenditures in the survey do not differ significantly from the income after tax. Therefore the income is used in the calculation of the proportion of the income that is spent on cold water services and in the willingness to pay analysis.
In Figure 5.3 the income distribution in the expenditure survey is compared to the income distribution in the stated preference survey. The income in the stated preference survey is a bit lower than that of the expenditure survey. The average monthly income per household after tax is around 2,500 roubles in the stated preference survey and 2,850 roubles in the expenditure survey. This indicates that respondents tend to underestimate their income.

Figure 5.3:
Household income after tax. Distribution in the expenditure survey and in the
stated preference survey
Note: Both income measures include salary, income from natural resources, subsidies, and gifts. The data in the expenditure survey is from the third quarter of 1999, while the stated preference data is collected in December 1999. Sources: Kaliningrad Statistical Committee and the stated preference survey
5.4.3 Water and wastewater services Cold water quality and drinking water
Around 43% of the households have water 24 hours a day. The most frequent times where water is not provided are during the night, between 0:00 and 6:00. However, some respondents do not have water during the afternoon.
Almost half of the consumers state that the quality of the tap water is poor or very poor. One third finds that the water is neither good nor poor and 24% of the consumers find the water good or very good, cf. Figure 5.4.
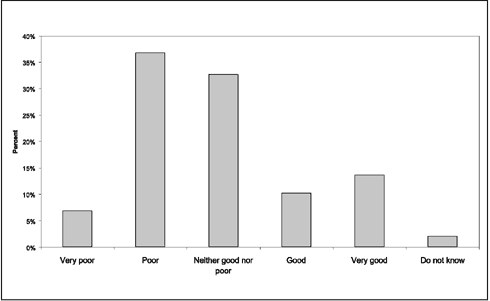
Figure 5.4:
Rating of the quality of cold water
Very few consumers drink the water straight from the tap, cf. Figure 5.5. Compared to the number of households that do not drink the water straight from the tap, the overall rating of the water quality is quite positive. The most important reasons for not drinking the water straight from the tap are4:
| healthiness/unsafe to drink, 38%; | |
| quality of the water, 27%; | |
| information, 7%; | |
| smell, 6%; | |
| bad taste, 5%; | |
| sediment/rust, 5%; | |
| boiling of the water instead, 4%; | |
| drinking well water instead, 2%. |
There is a large proportion referring to healthiness as the reason for not drinking the water straight from the tap, and the consumers do not easily monitor this. The general perception that the water is unhealthy is likely to be due to the fact that the water occasionally is unsafe to drink. The uncertainty which this gives rise to can make the respondents think that water is always undrinkable, cf. Figure 5.5.
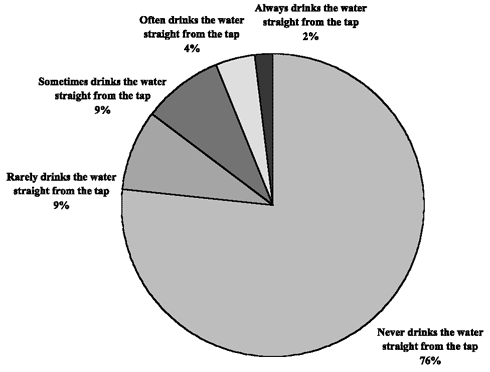
Figure 5.5:
Drinking water straight from the tap
Instead of drinking the water straight from the tap households get water from other sources or they use a water filter:
| 45% buy bottled water; | |
| 19% use water from a well; | |
| 25% have a filter. |
The distance between the home and the well varies between the consumers. Very few have the well within 2 km from the home and a few travel more than 20 km to get water from the well. The amount of water and the number of trips to the well vary between summer and winter. In the summer consumers using well water have 5 trips per month using 70 litres on average, and during winter the number of trips are around 2 per month. The consumption is correspondingly low in the winter with 33 litres per month on average.
One third of the household neither buys bottled water nor uses water from the well or filters the water. Most of them still do not drink the water straight from the tap, so it is assumed that most of them boil the water.
The average expenditures per household to bottled water, filter and well water are shown in Figure 5.6. On the left hand side of the figure only households that actually have expenditures are included, so e.g. the average expenditures on bottled water is found among households buying bottled water. On the right hand side all respondents are included.
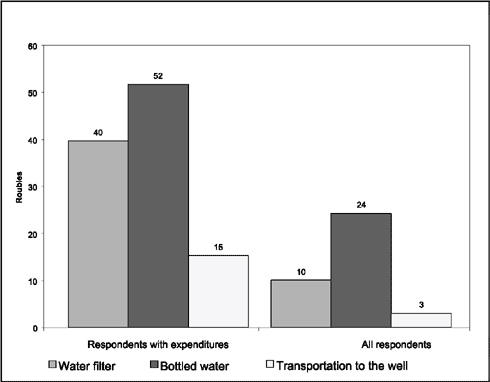
Figure 5.6:
Expenditures on bottled water, water filter and well water
Note: Transportation cost to the well includes direct cost only.
The average monthly spending for all consumers are 37 roubles. Consumers spend more during summer time than during winter. The average amount in the water bill is 31 roubles per month; thus the present expenditures on filter, bottled water, and well water actually exceed the water bill. If the quality of the tap water improves so that the water is drinkable from the tap, tariffs can be increased by more than 100% without burdening the households any further; that is if consumers do drink the water after an improvement in quality.
Rating of aspects of water quality
The consumers were asked to rate various aspects of the water quality. The results are shown in Figure 5.7. The healthiness of water is rated poor or very poor by more than half of the respondents. However, one fifth do not know how to rate the healthiness of the water and this might be related to the information provided. The consumers are also quite dissatisfied with the sediment in the tap water.
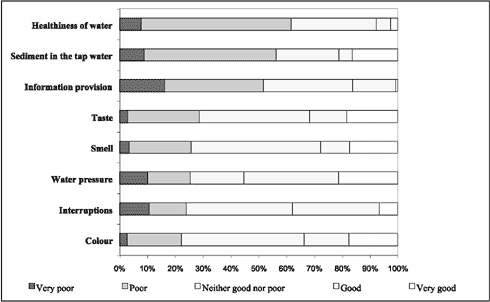
Figure 5.7:
Rating of various aspects of the water quality
Note: Between 0 and 5% were not able to rate the quality in most aspects. 9% did not know how to rate the taste and 21% did not know how to rate the quality of the water. The respondents answering do not know or not applicable have been left out of the figure.
The respondents are more satisfied with the water supply. More than half of the respondents finds the water pressure good or very good, and a large majority do not find the service related to frequency of interruptions poor. The colour of the water is perceived poor or very poor among very few respondents.
There are significant differences between the attitude in different areas of Kaliningrad. Respondents living in the centre of the city and who receive groundwater are quite positive whereas respondents living in other areas are more divided in their opinion.
In the centre of the city, all consumers are satisfied with the smell, colour and sediment. They are not sure if the water is healthy, whereas a majority of the consumers living elsewhere finds the water quality poor. Consumers living in the centre also find the water pressure good. Most of the respondents living in other areas are more divided, though quite positive.
Most consumers receive some information about the water services. More than half of the consumers receives information through newspapers, radio and television and one third receives information through their jobs. A significant proportion receives information from the Vodokanal. Around 20% of the households have received a pamphlet and some consumers have also received information by phoning Vodokanal or by visiting Vodokanal's office.
Around 25% of the households do not receive any information about the water services.
Water expenditures and payment
The consumption of water is likely to be affected by the way consumers are billed. If consumers are billed according to the amount of water consumed they are more likely to reduce water consumption as a result of an increase in prices.
In Kaliningrad, most consumers are billed according to the number of persons in the household. Only few of the respondents state that they have a separate meter for the household. Hence, households are not billed according to the consumption as also explained in Chapter 3.5.
The typical monthly charge of cold water is 16.51 roubles per person, and half for consumers with a privilege. In around 60% of the households one or more members receive a privilege.
On average the households pay around 31 roubles for the cold water services5. The distribution of the amount paid for water services is illustrated in Figure 5.8.

Figure 5.8:
Household payments for cold water services
The consumers are eligible for a subsidy if the sum of expenditures on utilities and rent exceeds 19% of the household income. The willingness to pay for improvement might depend on the eligibility of getting a subsidy, as the households are not paying the increase. At present, only 2% of the households receive a subsidy.
The respondents were asked if they thought that they would be eligible to apply for a subsidy if tariffs were to increase. Half of the respondents were told that prices for rent, electricity and hot water also would increase by 20%, but there is no significant difference in the answers.
A fifth of the respondents stated they would be eligible for a subsidy after an increase of 50%, and the proportion increases somewhat if the increase in water tariffs is 100%, cf. Table 5.4. Most of the households eligible for a subsidy would also apply for it.
Table 5.4:
Eligibility for a subsidy if the water tariff increases by 50% or 100%

Note: Half of the respondents were told that all other prices would be constant and the other half were told the prices for rent, electricity, and hot water would increase by 20%. However, there was no systematic difference in the answers between the two groups. Only the respondents eligible for a subsidy were asked if they would apply.
More than 70% of the households paid their last water bill in the same month as the interview took place. The bills paid for were mostly related to the current month or the last month. Around 13% of the households are more than one month behind, and another 13% are two months or more behind. This means that around every fourth household does not pay the water bill on time.
The proportion of household income spent on cold water services is shown in Figure 5.9. On average 1.6% of the household income after tax is spent on water services, and the maximum around 10% of the income after tax. The percentage varies between different income groups, cf. Figure 5.9.

Figure 5.9:
Water bill as a percentage of the household income after tax
Note: The figure is based on income from the expenditure survey. Source: Kaliningrad Statistical Committee and the stated preference survey.
Around 5% of the households spend more than 4% of the household income after tax on water services.
When the estimated expenditures on bottled water, filter and well water are included, the average expenditures on cold water exceed 3% of the household income after tax.
5.4.4 Willingness to pay for water servicesNone of the consumers find that a decrease in the quality of the water services along with a decrease in the tariff is the best strategy for the Vodokanal, cf. Figure 5.10. On the other hand, 41% of the consumers think that status quo is preferable, while 45% prefer to have an increase in tariffs and better water quality compared to the situation today. Hence, consumers are generally positive towards an increase in water charges, if it is accompanied by better water quality.
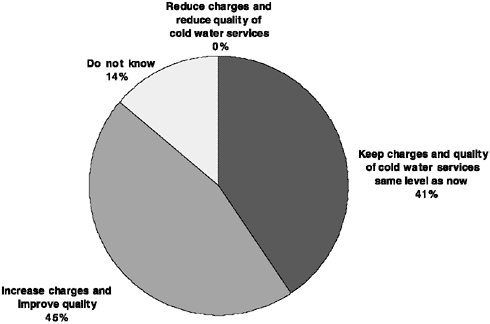
Figure 5.10:
Preferred strategy concerning water services and water charges
The reasons given for keeping the present water quality and not increasing water charges are e.g. that the consumers cannot afford to pay more (25%), that charges are already too high (18%), and that an increase in tariffs will result in social hardship for the poorest (9%)6.
Stated preference analysis
The stated preference analysis is exploring the willingness to pay for improvements. Factors included in the analysis are:
| the quality of the cold water; | |
| smell; | |
| supply and pressure; and | |
| cost. |
The purpose of the analysis is to find the willingness to pay for the improvements. The consumers' willingness to pay to avoid a worsening can also be analysed using stated preference analysis and an example of this if found in the case study report on Poznan.
Two levels of water quality are included in the analysis:
| cold water quality as now; | |
| cold water is always safe to drink directly from the tap. |
Smell is included in the analysis, because the qualitative work indicated that this is an important parameter for the consumers. Again two levels are included in the analysis:
| the smell of the cold water from the tap is as now; | |
| there is no smell at all from the cold tap water. |
Supply and pressure have been included in the stated preference questions in order to explore, if households that do not have 24 hours water supply are willing to pay to get it. Pressure is included to analyse if households in some parts of Kaliningrad have low pressure and if they are willing to pay to have a higher pressure. Supply and pressure are combined in one factor with three levels:
| supply and pressure are as now; | |
| cold water is supplied 24 hours a day and the pressure as it is now; | |
| cold water is supplied 24 hours a day and always with a good water pressure. |
The average willingness to pay for better water quality and no smell are illustrated in Figure 5.11. The willingness to pay is reported in roubles per month per person.
The highest willingness to pay found is for having water that is always safe to drink directly from the tap. On average the consumers are willing to pay a monthly increase of 3.10 roubles per person to get water that is always safe to drink, cf. Figure 5.11. This is an increase of 19% compared to the present tariff of 16.51 roubles.
The consumers are also willing to pay to have tap water with no smell. Respondents are willing to pay 3% more to have water with no smell, that is 0.50 roubles more per person.
Hence an important issue to stress when increasing the water tariff is that investments make it possible to improve the water quality.
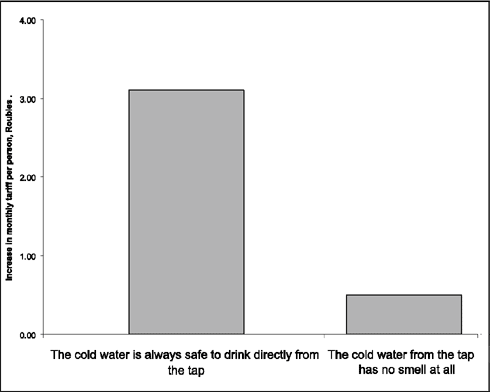
Figure 5.11:
Willingness to pay to have tap water that is always safe to drink and that has no
smell at all. Increase in monthly tariff per person, roubles.
57% of the respondents do not have water 24 hours a day. Among these there is a significant willingness to pay to get water 24 hours a day, cf. Figure 5.12. The consumers are willing to pay 8% higher tariffs if water is provided 24 hours per day; this is an increase in the tariff of 1.40 roubles.

Figure 5.12:
Willingness to pay to have water 24 hours a day and to have good pressure. Increase in
monthly tariff per person, roubles
Note: Only respondents that do not have water supply 24 hours per day are included in the willingness to pay for this. Likewise, only households living on the 4th floor or above are willing to pay for improved pressure and their willingness to pay is the one presented in the figure.
Consumers living on the 4th floor or above are willing to pay more to have a water supply with consistently high pressure. Around half of the households in-terviewed live on the 4th floor or above. The households are willing to pay 5% extra to get water supplied with consistently high pressure - or 0.90 roubles more per person per month.
Households living on the 1st to the 3rd floors are not willing to pay anything to improve the water pressure. This applies regardless of where in Kaliningrad the household lives.
Hence, supplying all households with water 24 hours a day will make an increase in water tariffs more acceptable. Improving water pressure is an issue for some households.
The total average willingness to pay is at least 20% as this is the willingness to pay if the tap water is always safe to drink and probably higher as there are some willingness to pay for other improvements as well. However, the WTP for various service improvements are not additive, so a total WTP for all service improvements cannot be derived.
The willingness to pay varies somewhat between age groups and between income groups. The consumers are divided into two income groups based on the household income per household member:
| consumers with income in the lowest quartile (25%); | |
| consumers with income above the lowest quartile. |
The willingness to pay as a percentage of the present water cost is given in Table 5.5. Consumers with a low income per household member are in general willing to pay less than consumers with a higher income. For instance, the willingness to pay to get water supplied 24 hours a day is 6% for respondents in the low quartile and 9% for the rest.
Table 5.5:
Willingness to pay for improvements. Increase in current payments

Note: (1) Only household that do not have water supplied 24 hours a day are included. (2) Only households living on the 4th floor or above are included.
Young consumers are willing to pay more to have safe drinking water. While respondents younger than 44 years of age are willing to pay between 19 and 28% more according to income, respondents in the highest age group are willing to pay 9% and 14% more. The same age dependent difference in willingness to pay does not apply for smell and water supply.
Various hypotheses that did not lead to an affirmative conclusion were explored during the data analysis. These are:
| Consumers with an income in the highest quartile (75% - the richest 25%) do not have a willingness to pay that exceed the willingness to pay among other consumers above the 25% quartile (the richest 75%); | |
| The difference in willingness to pay for different age groups dominates the difference between households with children and households without children. Households with children have a higher willingness to pay to get safe drinking water, but this is due to the fact that consumers with children are relatively young; | |
| No willingness to pay is found to improve cold water pressure on the 1st to 3rd floors; | |
| A general difference in willingness to pay between men and women was not estimated. This could be due to the low number of men in the survey as a difference between men and women have been observed in other case studies, typically with women having a higher willingness to pay for improvements. |
Uncertainty
The results of the stated preference analysis are statistically uncertain. In order to illustrate the uncertainty, a confidence interval has been calculated for the average willingness to pay for three of the proposed improvements, cf. Figure 5.13.

Figure 5.13:
Confidence interval (90%) for average willingness to pay for improved water services,
that is water always safe to drink, 24 hours supply, always good pressure, and no smell.
Willingness to pay in roubles per month per person.
Note: The 90% confidence interval is calculated by using the estimates from the willingness to pay analysis. Only households without 24 hours supply are included in this parameter and only households living on the 4th floor or above are included in the parameter Always good pressure.
For water always safe to drink the willingness to pay varies between 2.30 and 3.90 roubles; in percentages of the present tariff this is 14% and 24%, respectively. This illustrates that there is some uncertainty to the willingness to pay presented. Likewise, the willingness to pay to get 24 hours' supply varies between 0.80 and 2.00 roubles and the willingness to pay to get good water pressure is between 0.20 and 1.60 roubles. The willingness to pay to have water with no smell is only marginally significant and varies between 0 and 1.00 roubles. The confidence intervals are quite broad, and broader than for other case studies. This could most likely be relieved by including more interviews.
These intervals indicate that the overall results are fairly precise. However, the uncertainty is likely to be greater, if the uncertainty, e.g. due to the choice of method, is taken into account.
Importance ratings
The willingness to pay for changes in the services can be compared to the importance ratings of other items. This is possible because some of the service improvements included in the stated preference questions are included in the importance ratings as well.
The respondents were asked to rate the items on a scale from "very important" to "very unimportant". In order to compare the results, an index was calculated on the basis of the importance ratings. The values of the index give a prioritisation of the items, cf. Table 5.6.
The environment is the most important issue for the consumers. Almost all respondents find that the quality of wastewater treatment means that the surrounding rivers and bays are clean enough for a wide variety of fish and to safely swim in is either very important or important.
This is in line with almost all consumers stating that the Pregolya River and the Kaliningrad Bay are polluted. Respondents were asked to give their reasons for claiming that the river and the bay are polluted. The reasons given are:
| smell, 59%; | |
| colour or the look of the water, oil spots, 33%; | |
| discharge of industrial waste, 21%; | |
| lack of wastewater treatment, 15%; | |
| dirt in the water, 12%; | |
| information from media, 10%. |
That the water is always safe to drink is prioritised second, and consistently good water pressure is prioritised third. The least important improvement is a free telephone line for information on water services. 15% find this unimportant, but still 78% find it either important or very important. So although it is in the bottom of the list, most consumers would appreciate such a service.
Table 5.6:
Priority of service improvements

Note: The answer categories are (with index point in parentheses): Very important (10), Important (8), Neither (5), Unimportant (3), Very unimportant (0), Do not know ().
5.5 Conclusions on market research
The consumers in Kaliningrad are in general dissatisfied with various aspects of the cold water quality. Also, few consumers drink the water straight from the tap, and almost half of the interviewed respondents are willing to pay higher tariffs to improve the quality. None of the respondents in the survey prefers a worsening combined with lower tariffs. The respondents are willing to pay almost 20% extra if the tap water is always safe to drink, and probably more if all improvements are fulfilled
The consumers find the healthiness of the water poor and there is a willingness to pay for having tap water that is always safe to drink. Also there is some willingness to pay to improve the smell of the tap water, but this issue does not have high priority.
Households that do not have 24 hours' supply are willing to pay more to get it, and there is some willingness to pay to have better water pressure on higher floors.
The willingness to pay varies between different income and age groups. The willingness to pay is lower for the low income group, and young respondents are willing to pay more to have tap water that is safe to drink.
The following policy guidelines can be derived from the analysis:
| Significant willingness to pay to improve quality; | |
| Important arguments for price increases due to improved water supply are: |
| (1) to have tap water that is always safe to drink; | |
| (2) to have water supplied 24 hours a day; |
| 4 | The percentages do not sum up to 100% as each respondent can
give more than one reason for not drinking the water. |
| 5 | Some respondents, two-thirds, pay an extra amount for sewage.
This payment is neither included in the distribution in Figure 5.9 nor in the analysis of
the willingness to pay. than one reason. |
| 6 | The percentages do not add up to 41% (i.e. the consumers who think that charges should not be increased) because respondents were allowed to give more than one reason. |