Water Prices in CEE and CIS Countries. Volume II: Case Studies
Chapter 6.
Ability to Pay Issues
6.1 Data quality
Similarly to the situation elsewhere in Russia, reliable income data is difficult to come by. As a proxy we have based the discussion in this chapter on expenditure data. The source of expenditure data is the household expenditure survey conducted once every quarter using a rotating panel. According to the Statistical Committee the panel is likely to exclude a small group of very rich citizens. We concur with this opinion.
However, for our purpose, this bias does not seem to present a major problem. Firstly, the group of rich citizens excluded is likely to be small, maybe 1-2% of the population. Secondly, this population segment is likely to be able to afford and to have a completely inelastic demand for water at any realistic price.
6.2 Household Income and ExpenditureHousehold income in Kaliningrad has dropped since 1990. The drop has been more than 20% (inflation adjusted) since 1994 alone. Today, the annual per capita income in an average Kaliningrad household is a little less than RUR 10,000 or approximately USD 400 per capita per year. While the income is higher when measured using purchasing power parities, clearly the income is very low by European standards. This is also demonstrated by the composition of household expenditures, illustrated in Figure 6.1

Figure 6.1
Composition of expenditures for an average household in Kaliningrad 1991 - 98
(*) Non-food includes alcohol and meals eaten outside the home
The figure illustrates how expenditure on food has increased from constituting 29% of total expenditures in 1991 to 54% in 1998. The sum of alcohol, meals outside home and nonfood expenditures (clothes, furniture, electronics and hardware) has simultaneously decreased from 59% of the total to 31% of the total. The cost of services (rent, utilities, medical care etc.) has increased only slightly from 12% to 15%.
This change in the expenditure composition clearly indicates that the average citizen of Kaliningrad has become substantially poorer since 1991. A share of food expenditures of 54% in total expenditures also indicates that there is not much room for increasing charges for services.
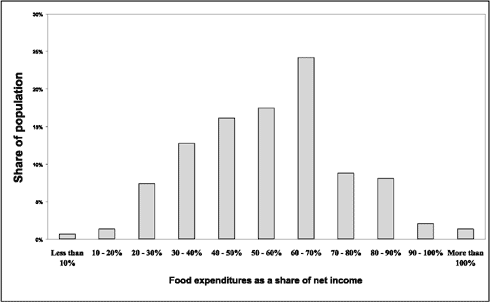
The most recent data available on consumer expenditures are those of the third quarter of 1999. More than 60% of the households spend more than half of their income on food products, and 10% of the households pay more than 80%, cf. Figure 6.2

Figure 6.2:
Food expenditures as a share of net income, third quarter of 1999
Source: SP survey and Statistical Committee of Kaliningrad
With the recent doubling of prices, today water constitutes approximately 1.6% of expenditure for an average household. However, two issues need to be considered:
| The potential simultaneous increase of other municipal tariffs; and | |
| The income distribution. |
A doubling of the price of all municipal services and public transport (which would still not bring them to full cost recovery) would imply an increase of more than 9 percentage points in current expenditures. These 9 percentage points would mainly have to be taken out of the 37 percentage points which at present are allocated to non-food or other services (telecom, medical, legal, kindergarten, etc.). A reduction of the share of expenditures for non-food and other services to 30% at an income level of USD 400 per capita is probably closer to the minimum achievable. At the very least this would (in itself) clearly be perceived as (another) reduction in welfare for the people concerned. Chapter 5 provides information on people's perceptions hereof when combined with an improved level of water services.
The income distribution is given in Chapter 5, Figure 5.3. Every fourth household has an income which is less than half the average income. Hence, there is a large proportion of the household that has a relatively low income, and the experience from the WTP analysis indicated that some of these households do indeed have difficulty in paying the household service bill.
6.3 WTP and planned tariff increasesThe willingness to pay study concluded that respondents are willing to pay a maximum of 30% for all service improvements. This includes that the water has no smell, always safe to drink, always with good pressure and that all consumers get 24 hours service.
In Chapter 3 it was concluded that the tariff has to increase at least 287% compared to 1998 in real terms in order to make the planned improvements of the water and wastewater services feasible. This increase was proposed implemented gradually in the period 1999-2006.
The proposed tariff increases included an increase of 30% in 1999 that did not take place. The tariff was increased only by 17% compared to the average real tariff in 1998. In order to reach the planed increase of 287%, the tariff in 2000 must increase by around 33% instead of the planned increase of 20%, cf. Table 6.1.
Table 6.1:
Necessary increase in water tariffs, expected increase in income and average cost of
water services as a percentage of real income

Note: By the end of 1999 the real tariff exceeded the average tariff of 1998 by
17%. The full increase is 230% as the water tariff already increased 17% compared to the
average level of 1998.
Source: Krüger, Department of Finance in Russia and COWI.
The Department of Finance in Russia expects an annual increase, in GDP pr. capita, by 3% in the years to come. If the income is assumed to increase by the same rate, the cost for water will assume an increasing part of the household expenditure. At the end of period the tariff will be around 4% of the household income, cf. Table 6.1.
The willingness to pay is hence significantly lower than the tariff increases needed.
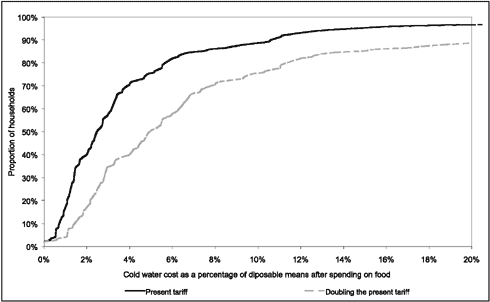
In order to evaluate the burden on the household of the cold water bill, the share of the cold water bill of the available means after spending on food products was calculated for the households after the full tariff increase is implemented, cf. Figure 6.3. This measure is useful because it indicates the proportion of households where a significant increase in the cold water cost will have a great impact on the standard of living.

Figure 6.3:
Cold water cost as a percentage of the available means after spending on food,
cumulative distribution: Present and double real tariff corrected for increase in real
income
Note: The increase of 200% is used as this is the planned increase corrected for increase in income by 3%.
At the present tariff level, 10% of the household spend more than 10% of their remaining means, after food expenditure, on cold water services. If cold water prices are doubled some 25% of the households will spend more than 10% of their remaining means on cold water.
Hence, if the costs for water services are increased significantly, a relatively large part of the population will envisage a water bill that accounts for a significant part of the household budget.
6.4 Payment Habits6.4.1 Current situation
The Vodokanal collects revenue from industrial consumers and from private consumers who have elected to be connected to the water supply system by water meters.
Approximately 65% of the Kaliningrad population, most of whom live in communal owned complexes, has its water tariffs collected by the municipal billing company Simplex. The local housing office submits all relevant information on the households (e.g. number of people living in a flat and privileges) to Simplexand based on this information the calculations are made. The bills are sent to the individual families and include easy-to-understand information on how the bill has been calculated.
A general feature which complicates the calculation and collection of water tariffs is the fact that no less than 43 different categories of privileges exists. They cover half the population, thereby, clearly indicating that the system is not adequate. The future of the system is governed by federal regulation and it is currently under negotiation between the regional authorities and the federal authorities of the Russian federation. A system of "targeted assistance" is already in place as discussed in Section 4.8.
Almost 10% of the households have a debt with the Vodokanal, which is older than 12 months, cf. Table 6.2, but even in cases with long periods of non-payment services are not cut off. For technical reasons it is not possible to cut off one single flat from the water supply system.
Table 6.2:
Number of households of Kaliningrad having dept to the Vodokanal (by November 1999)

In order to make the investments feasible it is necessary to obtain better collection rates.
The planned collection rates are to increase until the year 2001, cf. Table 6.3. The level of collection is expected to increase, especially for the budget organisations and the industries.
Table 6.3:
Collection rates 1997-2001 in Krüger feasibility study

Source: Kaliningrad water and wastewater services feasibility study, Krüger 1999
6.4.2 Enforcement
The urgent issue of non-payment relates to budget institutions. However, if water prices are increased drastically, non-payment by household is likely to become an issue. Obviously consideration must be given on how to deal with non-payers in a situation where cutting off services to individual apartments is not possible.
Water utilities in other countries have successfully tried the following:
| Creation of a simple system of payment for households and close follow-up. This seems to be what Simplex is doing successfully in Kaliningrad; | |
| "Posting" information on non-payers. In places where this creates peer pressure it has been proven to be effective; | |
| Announcing that building blocks which have a very low ratio of payment will be cut off - and following through; | |
| Staging a drastic public relations step. In one city the Vodokanal announced that services to the hospital would be cut off (naturally with prior warning). The Vodokanal did cut off services to the hospital and this was reported on prime time television. This had a very positive effect on other users' propensity to pay. |
A large part of the population will have affordability problems when tariffs start to increase, and a social targeting scheme needs to be considered. This should ensure that all groups of the population are able to afford paying the increasing water tariff.
However, there is some willingness to pay among the consumers, but there is a need for an increasing level of information provision. Most consumers find it very important both to improve the tap water quality and the wastewater treatment. In order to obtain public acceptance of increases in water tariffs it is of great importance to explain to the public that these increases are necessary to obtain a better service.
This is even more important when the service improvements are obtained only after the tariff has been increased.