|
| Front page | | Contents | | Previous |
Evaluation of the health risk to animals playing with phthalate containing toys
Appendix
Appendix 1
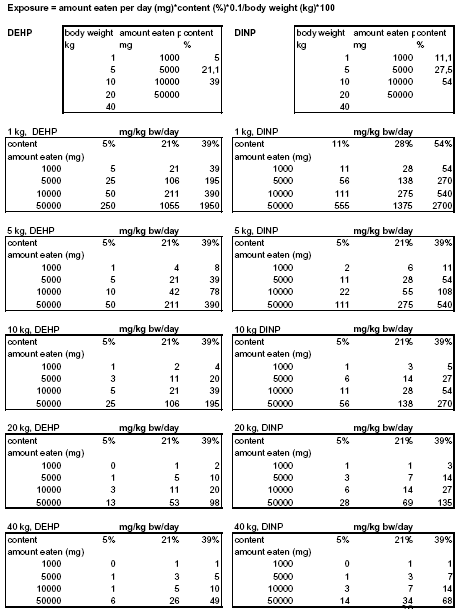
Exposure estimations of DEHP and DINP based on the assumption that 10% of the phthalate present in the product migrate
Appendix 2
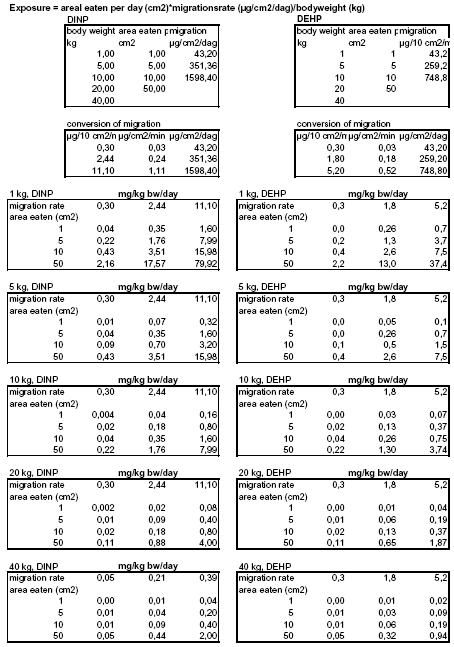
Exposure estimations of DEHP and DINP based on measured migration rates
Appendix 3
MOS values derived on the LOAEL (37 mg/kg bw/day) from the toxicity study in dogs (Hazleton et al. 1971 – quoted in DINP 2001). The minimal MOS is a product of a factor 10 for intraspecies variation and a factor 10 for using a LOAEL instead of a NOAEL.
| A |
|
MOS for DINP |
Minimal MOS |
| |
Average migration |
Worst-case migration |
| 24 hours migration |
kg |
eaten amount (cm²) |
eaten amount (cm²) |
| 1 |
5 |
10 |
50 |
1 |
5 |
10 |
50 |
| 1 |
105.7 |
20.6 |
10.6 |
2.1 |
23.1 |
4.6 |
2.3 |
0.5 |
20 |
| 5 |
528.6 |
105.7 |
52.9 |
10.6 |
115.6 |
23.1 |
11.6 |
2.3 |
20 |
| 10 |
925.0 |
205.6 |
105.7 |
20.6 |
231.3 |
46.3 |
18.5 |
4.6 |
20 |
| 20 |
1850.0 |
411.1 |
205.6 |
42.0 |
462.5 |
92.5 |
46.3 |
9.3 |
20 |
| 40 |
3700.0 |
925.0 |
411.1 |
84.1 |
925.0 |
185.0 |
92.5 |
18.5 |
20 |
| B |
|
MOS for DINP |
Minimal MOS |
| |
Average content |
Worst-case content |
| 10% of phthalate migrate from product. |
kg |
eaten amount (g) |
eaten amount (g) |
| 1 |
5 |
10 |
50 |
1 |
5 |
10 |
50 |
| 1 |
1.3 |
0.3 |
0.1 |
0.0 |
0.7 |
0.1 |
0.1 |
0.0 |
20 |
| 5 |
6.2 |
1.3 |
0.7 |
0.1 |
3.4 |
0.7 |
0.3 |
0.1 |
20 |
| 10 |
12.3 |
2.6 |
1.3 |
0.3 |
7.4 |
1.4 |
0.7 |
0.1 |
20 |
| 20 |
37.0 |
5.3 |
2.6 |
0.5 |
12.3 |
2.6 |
1.4 |
0.3 |
20 |
| 40 |
74.0 |
12.3 |
5.3 |
1.1 |
37.0 |
5.3 |
2.6 |
0.5 |
20 |
| Front page | | Contents | | Previous | | Top |
Version 1.0 August 2006, © Danish Environmental Protection Agency
|