[Front page] [Contents] [Previous] [Next] |
Economic Instruments in Environmental Protection in Denmark
4. Overview of economic instruments in Denmark
4. Overview of
economic instruments in Denmark
4.1. Taxes and charges
4.2. User fees and subsidies
4.3. Economic and environmental
sectors
4.4. Incidence and distribution effects
4. Overview of economic instruments in Denmark
Types of instruments
Command-and-control instruments are still the most widely used means of protecting the environment. However, there is a general trend of widening the range of instruments to include an increasing number of other instruments. This includes, for example, awareness building instruments, economic instruments, and other types, such as voluntary agreements.
This trend can also be observed from the development in the approaches taken in the EU where other types of measures are increasingly emphasised. For example, by comparing the earlier Environmental Action Programmes with the recent ones (the fourth and the fifth), one may note that the merits of economic instruments and other alternative measures are emphasised in the latter. Still, although the European Commission recommends the wider use of economic instruments, there has been little progress in their actual use at the EU-level. At the member state level, however, the use of economic instruments has increased since the beginning of the 1990s.[1]
Economic instruments were explicitly introduced into Danish environmental policy in the mid 1980s. Since then, their use has increased. Today, the instruments in use include, for example, taxes on waste, CO2, SO2, water supply, and sewage disposal.
The 1994 tax reform
In January 1993, the government initiated the tax reform that entered into force in 1994. The tax reform, among other things, aimed to increase the level of green taxation, and in turn, to decrease the level of income taxation. The increased green taxation was also seen as a means of pursuing a government objective of enhancing the public’s environmental awareness in general. Further, the reform reflected an overall government priority that environmental concerns should form a solid base and an integral part of all government policies.
Thus, environmental considerations gained a new role with the Danish tax reform. For the first time in the history of Danish tax policy, the reform took an increase in the level of the environmental taxes and charges as a prerequisite for a decline in the income tax level. Consequently, new economic instruments were introduced with the tax reform, and levels were increased for some of the existing ones. These actions were connected with a tax relief on marginal income, in order to shift the tax burden away from labour, and towards resources and environmental pressures. Since the tax reform, the use of economic instruments has continued to increase.
Revenues
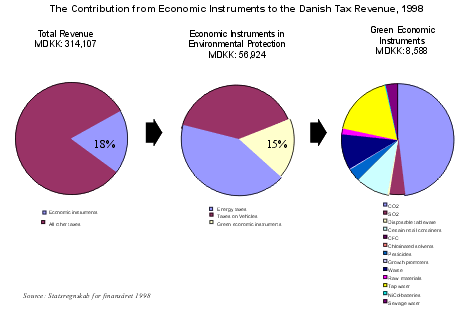
Figure 4.1 shows the Danish tax revenue and the contribution provided by economic instruments[2]. The figure does not include user fees, because the fees are collected in a very decentralised manner. The figure shows that the economic instruments contribute 16% of total government tax revenue. Income taxes and other indirect taxes (in particular VAT) are the major other sources of government revenue. Vehicle taxes and energy taxes are seen to be the single most important economic instruments in terms of revenue contribution. It should be noted that in the figure, energy taxes are inclusive of motor fuel taxes. The remaining economic instruments (labelled “green economic instruments) provide 16% of the total revenue generated from economic instruments. This corresponds to a contribution in the order of 3% to the total government revenue.
4.2. User fees and subsidies
User fees
The role of user fees has been intensified in the last 10-15 years. The use of the principle of full cost-recovery combined with stricter environmental standards for plants that provide the services in question (waste handling and disposal, sewage treatment, and provision of tap water) has led to substantial increases in the levels of user fees.
Further, the legislation enables the providers of the services to differentiate the fees under certain conditions[3]. Consequently, specific types of waste may be subject to higher fees than other types.
Figure 4.1.
The Contribution from Economic Instruments to the Danish Government Tax Revenue

Subsidies
Subsidy schemes in Denmark typically aim to support: investments; actions that aim to change behaviours and production methods; research and development efforts; and awareness building. Subsidy schemes are framed in accordance with the stipulations of the Treaty of the European Union. The Treaty limits the extent to which such schemes may target specific industries or enterprises. Subsidy schemes are mostly framed independently of a possible associated revenue generation. In other words, there is no earmarking of revenues involved.
4.3. Economic and environmental sectors
Figure 4.2 and Figure 4.3 provide an illustration of the environmental and economic sectors that are affected by the instruments in use in Denmark. The figures provide a simplified representation of the actual state of affairs. It has, for example, been chosen to categorise a set of taxes (the CO2 tax, the SO2 tax, the sewage tax, and the waste tax) as effluent taxes, although neither of them can be said to be effluent taxes in a stringent sense[4].
Figure 4.2 only shows the main environmental sector affected. For example, the pesticides tax has been indicated to affect soil and groundwater, however, the use of pesticides also affects surface water. For the sake of simplicity it has, however, been chosen to show only the one sector that is mostly affected.
Comparing the two figures with Figure 4.1 it is apparent that households contribute the major share of the revenue from economic instruments. Energy taxes, including motor fuel taxes and vehicle taxes, are collected mainly from households. Furthermore, households contribute the largest part of the CO2 tax, although other sectors are subject to the tax as well.
It should also be noted that taxes and charges that are initially imposed on other sectors than households, will often be sought to be recovered by the sector in question by means of adding some or all of the tax to the consumer price of the item in question. Therefore, households in reality pay part or all of that tax[5].
Typically, a tax that is levied on a company in international competition will not be shifted on to the consumer, but will instead be borne by the company and/or its suppliers of labour, capital, and other inputs, depending on the market conditions for these goods and services.
On the other hand, the tax will most likely be shifted onto the consumers if the company is not in international competition, or if the tax is levied on all use of the product in question[6].
Figure 4.2
Economic instruments and affected environmental sectors
Air |
Water |
Soil and ground water |
|
Effluent charges/taxes |
CO2 |
Sewage |
Waste |
Product charge/tax |
CFC |
Certain retail containers |
|
User fee |
Sewage |
Waste |
|
Deposit refund |
Beverage containers |
Figure 4.3
Economic instruments and affected economic sector
Agriculture |
Energy |
Manu- |
Transport |
Households |
|
Effluent charges/taxes |
CO2 |
CO2 |
|
CO2 |
|
Product charge/tax |
Pesticides Growth- |
Energy 1) |
CFC |
Energy Motor Motor vehicles |
Energy |
User fee |
Tap water |
Road toll |
Tap water |
||
Deposit-refund |
Beverage containers |
1) Only energy use for heating purposes,
2) Airborne transport and public transport are exempted
4.4. Incidence and distribution effects
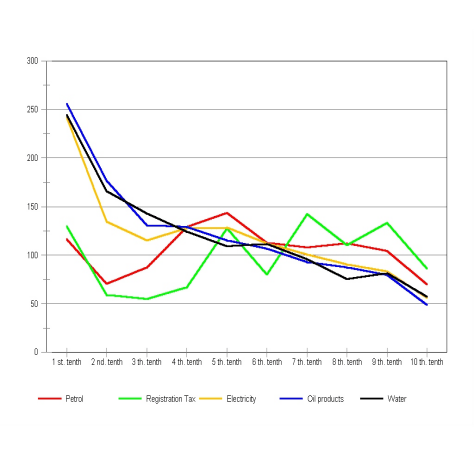
Figure 4.4 shows the incidence of five of the largest green taxes measured by revenue for ten household income brackets. The first tenth represents the lowest 10% of the incomes and the last tenth presents the highest 10% of the incomes. An index of 100 means that the tax is proportional to the household’s income. The figure serves to illustrate the extent to which particular taxes are of a degressive, neutral, or progressive nature. Taxes that affect lower income groups the most are degressive, while taxes that affect higher income groups the most are progressive. A neutral tax affects all income groups similarly.
Figure 4.4
Relative incidence of certain green taxes

Source: Ministry of Taxation
The figure shows that the taxes on electricity, oil products (especially for heating purposes), and water are all very degressive compared with incomes. The households with the lowest incomes have the highest relative tax burden, and the relative burden decreases as household incomes increase.
The situation is somewhat different for taxes on vehicles and transportation. The tax on petrol is reasonably constant across household income and the registration tax is slightly progressive. In the last case it should be noted that the first income group contains very few observations.
The general conclusion from the above is that green taxes tend to be degressive. This should give rise to considerations on equity and fair distributions of income.
Distributional effects
In Denmark, there was a break-through for green tax reforms with the 1994 tax reform. Furthermore, Denmark has had a long tradition for an integrated use of the various economic instruments including subsidies. This allows the targeting of possible unwanted distributional effects from the green taxes through other tax instruments. As illustrated above, economic instruments in environmental protection may often be degressive, i.e. they affect lower income groups the most.
Thus, the increased revenues from green taxes are often used (indirectly as they are not earmarked) to lower other income taxes, so that a compensation for the adverse distributional effects on income is achieved. This can contribute to maintain or even enhance the overall redistributional effects from the tax system.
A method that has also been applied in Denmark is to counterbalance the negative effect from the green taxes on income distribution through the joining of the taxes with the social security payments. Basically, this implies that the price increases that result from, for example, increased taxation of electricity and heating are taken into account when setting the level of social security payments and other similar payments.
Notes
EEA; Environmental Taxes, Environmental Issues Series No. 1, 1997, p. 5
The figure has been drafted based on information from Statistics Denmark
In particular, the principle of full cost recovery must be complied with for each specific type of waste, i.e. cross-subsidisation is not allowed.
The CO2 tax is a product tax in the sense that it is imposed on the fuels used for energy production. However, there is a fixed relation between the specific fuel, and the resulting CO2 emissions. This is the rationale for its categorisation as an effluent tax. In the case of the SO2 tax, its design entails an option for applying it as an effluent tax. The sewage tax has a strong element of effluent taxation, as its size relates specifically to the content of various specified substances in the sewage. The waste tax differentiates between various types of waste.
This should not however be seen as a deficiency of the economic instruments as such. It is part of the functioning of economic instruments. When the consumer price is increased as a result of the tax, there is, for example, an incentive for consumers to shift to other, non-taxed and less environmentally harmful substitutes, and/or to decrease their use of the article or service in question altogether. Further, there is an incentive for producers to develop substitute products or other methods of production which are more environmentally friendly, and which are therefore not subject to the tax in question.
However, the producer, and if relevant, also the importer, can be forced to bear part of the burden or can seek to shift it onto suppliers of inputs if the price elasticity is high.
[Front page] [Contents] [Previous] [Next] [Top] |