[Front page] [Contents] [Previous] [Next] |
Modern Windships; Phase 2
Appendix 2. Ship resistance, Theory and BackgroundTheory
Planer Motion Mechanism (PMM) Tests
Pure Yaw
Principles of Motion Generation
Speed Loss in Waves
Wave Spectrum
Added Resistance due to Waves
WindShip Speed Loss due to Waves
One has only to look down from the deck of a ship at sea and observe the turbulent motion in the water near the hull, increasing in extent from bow to stern, to realise that energy is being absorbed in frictional resistance. The term resistance is the preferred term in ship hydrodynamics, while the term drag is generally used in aerodynamics and for submerged bodies. Any roughness of the surface will increase the frictional resistance appreciably over that of a smooth surface and with subsequent corrosion and fouling still greater increases will occur. Not only does the nature of the surface affect the drag, but the wake and propulsive performance are also changed. Frictional resistance is thus the largest single component of the total resistance of a ship, and this accounts for the theoretical and experimental research done by Danish Maritime Institute and Pelmatic Knud E. Hansen A/S.
The attention has been paid on the drift and following contra steering due to the drift motion of "the sailing ship".
It is rather easy to establish trials, where only pure resistance occur, but it is much more complicated to exclude frictions effects and only measure the wave resistance. This is due to the fact that it is possible to eliminate free fluid surfaces, e.g. by use of a wind tunnel, but all flowing fluids has a resistance. In a model test where both the ratio between inertia forces and gravity forces and between inertia forces and resistance forces should to be correct, both the Froudes number Fn and the Reynolds number Re must be equal for both model and ship. The test is carried out with a model, which has geometric similarity with the ship in a scale ratio of a , where
| Equation 14 |
L is the length of the ship. a is in this project 28.22322 .
The Froude’s number is then defined as
| Equation 15 |
where V is the velocity for the ship and model respectively.
Figure 75 shows the used co-ordinate system, included the hydrodynamic forces and moments vectors acting on the model. All listed for forces and moment are oriented in accordance with this co-ordinate system.
Figure 75. Look here please
Figure 75. Nomenclature
Other scaling factors are:
| Forceship | = | Forcemodel | � a 3 |
| Momentship | = | Momentmodel | � a 4 |
| Speedship | = | Speedmodel | � a 1/2 |
| Revolutionsship | = | Revolutionsmodel | � a -1/2 |
| Lengthship | = | Lengthmodel | � a |
| Timeship | = | Timemodel | � a -1/2 |
The hypothesis first stated by Froude says that friction and wave resistance can be scaled individually and that the same Froude number for ship and model gives the same wave system. When the Froude number is constant, it is assumed that the wave resistance coefficient is constant too.
Theory
The frictional resistance is the component of resistance obtained by integrating the tangential stresses over the wetted surface of the ship in the direction of motion. All fluids have viscosity, which causes friction. The importance of this friction in physical situations depends on the type of fluid and the physical configuration or flow pattern. If the friction is negligible, the flow is called ideal. The viscosity is a measure of the fluid’s resistance to shear when the fluid is in motion.
Suppose a suitable quantity of viscous fluid is put between two parallel plates that are at a distance h from each other, due to viscosity we get the following speed profile in the fluid, see Figure 76.
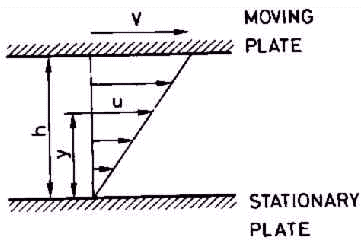
Figure 76. Flow between parallel plates
Where there is a homogeneous flow along a flat plate, e.g. the hull of a ship, the velocity of the fluid just at the surface of the plate will be zero owing to frictional forces, which retard the motion of fluid in a thin layer near to the plate. In this boundary layer the velocity in the fluid U increases from zero at the hull plate to its maximum value, see Figure 77
Figure 77. Look here please
Figure 77. Schematic diagram of boundary-layer flow [SNAME vol II]
Planer Motion Mechanism (PMM) Tests
When performing towing experiments for determining the resistance of the ship model, the model is free to surge, to heave, to roll, and to pitch. The surge is limited due to the dynamometer put between the model and towing carriage. In general, the roll owing to the symmetry, will be nearly equal to zero. During the actual planar motion test the model was free to heave and pitch but otherwise constrained, i.e. only static trials were carried out. The PMM and model are shown in Figure 78. The heave and pitch can be registered at the trim guides or by the trim meters.
Figure 78. Look here please
Figure 78. General view of PMM and model attached to the towing carriage. (Not the WindShip model)
The model of the ship is made in scale 1:28.22322 suitable for the towing tank concerned.
The towing forces are registered by the resistance dynamometer over a range of speeds, covering all speeds of interest for the ship in question. By plotting all resistance points in a diagram on base of speed, a fair curve can be drawn through these points, representing the model resistance curve. Then this curve has to be transformed to the ship resistance curve.
The hydrodynamic forces and moments are functions of body geometry, motions and orientations.
The range of motion and rudder parameters explored during the testing are covered in the range of the subsequent simulation. Drift angle, yaw moment, speed and rudder angle are there varied systematically up to the values corresponding to rudder manoeuvres for the free sailing ship.
Captive model test in which measurements are made of hydrodynamic forces and moments resulting from drift angles, from rudder angle and from combinations of drift and rudder angles, is conducted with the PMM in the DMI towing tank.
The Planar-Motion Mechanism system was conceived and developed by Gertler and Goodman, and provides means of conducting captive model test in which angular and straight line motion can be imposed on a model in a towing tank. Developed as a technique for submerged body research the original mechanism generates motions of the body. The Planar-Motion Mechanism can be used in two different modes of operation, designated static and dynamic. In the present test only the static mode is found necessary to use. In the static mode, the model is constrained to travel along a straight path at constant velocity, and mechanism is used to set discrete drift angles.
Figure 79 below schematically represents the three main types of test made in the static mode.
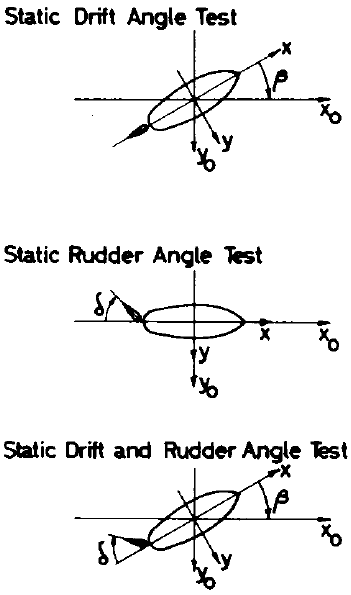
Figure 79. Examples of test executed in static mode of PMM operations.
Forces and moments resulting from drift angle, rudder angle and from the combinations of drift and rudder angles are measured in these tests.
The unique feature of the Planar-Motion Mechanism is its ability to generate oscillatory motions which are produced in the dynamic mode of its operation.
Sinusoidal motions are imposed on the model with yaw phase in such a way as to produce the condition called pure yaw, see Figure 80.
Figure 80. Look here please
Figure 80. Examples of Yaw tests executed in dynamic mode of planar-motion mechanism operation.
In the pure yaw test bow and stern are oscillated with phase angle chosen such that pure angular- velocity and acceleration result.
Various examples of this type of test are shown in Figure 80 above, the two developments of the pure yaw test, i.e. yaw and drift angle test, and the yaw and rudder angle test, constitute a means of measuring cross-coupling terms in the equation of motion.
As a means of experimentally measuring accelerations as well as angular velocity, drift angle, and rudder angle derivatives, the Planar-Motion Mechanism system constitutes an almost ideal method of obtaining all the linear terms needed for course stability studies.
Principles of Motion Generation
The difficult of generating a yaw velocity in a conventional tank due to the fact that if a constant angular velocity is maintained for more than a short length of time, while travelling at the necessary speed, a collision with one of the side-walls will result.
Use of a Planar-Motion Mechanism overcomes this problem by forcing the model to travel with alternately port and starboard yaw velocities.
This results in a S-shaped path which in rough terms may be considered as being built up of segments of the segments of circular path travelled by a model rotating arm, see Figure 81.
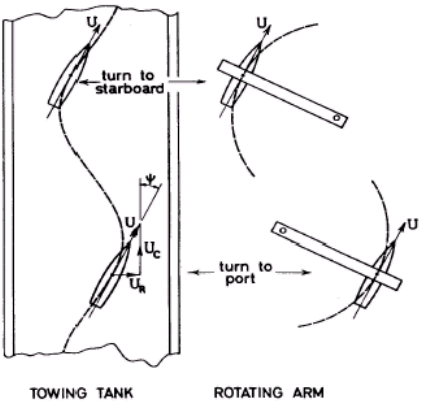
Figure 81. Comparison of pure yawing motion generated with PMM and rotating arm.
To be more precise, a Planar-Motion Mechanism generates a sinusoidal trajectory and the angular velocity is thus constantly varying, but the rotating arm comparison is none the less valid because the variation is so slow that quasi steady conditions are obtained. With reference to Figure X5 shows that if the model is to move with a pure yaw, i.e. with zero drift angle, then it must at all times move along the tangent to its path.
Speed Loss in Waves
To predict the speed of the WindShip sailing in wind it is necessary to add the added resistance from the contribution of the waves. A calculation model has been developed by using strip theory and semi-empirical formulas to calculate the added resistance in waves for different wave directions and wind speeds.
During phase I of the project HSVA developed a semi-empirical formula for the WindShip. This formula is adopted in the new model and tuned in with the strip calculations for head sea. With the strip theory and the semi-empirical formula we now have the possibility to determined the added resistance in waves for different wave directions and wind speeds for the Wind Ship.
For the calculations it has been assumed that the ship is experiencing a fully developed sea i.e. that the wave condition are functions of the wind speed. The following expressions for the significant wave height and wave period have been applied from P. Schenzle of HSVA. The expressions correspond with the relationship between Beaufort Number, wave period and wave height proposed by Lloyd’s Register. For a description of the applied methodology, reference is made to Faltinsen,"Sea Loads on Ships and Offshore Structures", Ch. 5, Cambridge University Press,1999, see Ref. 10.
| Equation 16 | H1/3 = 0.6 + 0.15 U10 + 0.004 U10 2 |
| Equation 17 | T1 = 3.6 + 0.26 U10 |
Where:
| H1/3 | = the significant wave height (= Hs, [m]) |
| T1 | = the characteristic wave period (Ts [s]) |
| U10 | = the wind speed at 10 m reference height [m/s]. |
Using the values of the wave height and period a Pierson-Moskowitz spectrum (P-M) have been applied in the strip calculation. The semi-empirical expression for the frequency spectrum of fully developed waves is defined as follows:
| Equation 18 | S(w ) = 173 � HS2 � TS-4 � w -5 � exp(-692 � TS-4 � w -4) |
where:
| S(w ) | = The spectral energy density [ m2� s] . |
| w | = Frequency [ rad/s] . |
The following spectra was used in the strip calculation, see Table 27 and Figure 82.
| The parameters for the four spectra (P-M) | |||
U10 |
HS |
TS |
|
| Type 1 | 7.7 |
2 |
5.6 |
| Type 2 | 12.1 |
3 |
6.7 |
| Type 3 | 15.1 |
4 |
7.7 |
| Type 4 | 19.3 |
5 |
8.6 |
Table 27. Parameters for the four spectra.
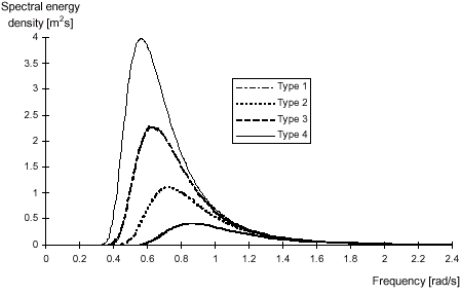
Figure 82. Pierson-Moskowitz spectrum for the four sea-states.
The added resistance in waves for other directions than head sea was estimated by use of the following expression:
| Equation 19 | Raw(a ) = Raw(0) � f(a ) |
| Equation 20 | f(a ) = 1 - 0.38 � (1 - cos(a )) - 0.44 sin2(a ) |
where:
| a | = The relative wind and wave direction (0 = head) |
| Raw(a ) | = The added resistance depending of the relative wind and wave direction a . |
| Raw(0) | = The added resistance in waves for a = 0, determined by strip theory,see Figure 83. |
| f(a ) | = Correction function. |
Added Resistance due to Waves
The added resistance in waves for head sea has been determined by use of strip theory. For these calculations it has been assumed that the ship is experiencing a fully developed sea i.e. that the wave conditions are functions of the wind speed. The following expressions for the significant wave height and wave period have been applied:
The results of the strip theory calculations of the added resistance in head seas are given in below.
| Wind velocity | Spectrum |
Ship speed |
||||
| U10 /(m/s) | Hs | Ts | 10 kn | 15kn | 20kn | 30kn |
| 7.7 | 2 | 5.6 | 0.1 kN | 0.0 kN | 0.0 kN | 0.0 kN |
| 12.1 | 3 | 6.7 | 19.0 kN | 12.1 kN | 8.3 kN | 4.7 kN |
| 15.9 | 4 | 7.7 | 140.5 kN | 91.9 kN | 63.2 kN | 34.2 kN |
| 19.3 | 5 | 8.6 | 386.5 kN | 270.3 kN | 194.5 kN | 104.9 kN |
Table 28. Added resistance in heading waves (kN)
The added resistance in waves for other directions than head sea has been estimated by use of the following expression, obtained from the same source:
| Equation 21 | Raw (a ) = Raw (0) f(a ) |
Where a denotes the relative wind and wave direction (0 = head)
Raw (a ) is the added resistance in waves as a function of a
Raw (0) is the added resistance in waves for a = 0, determined by strip theory.
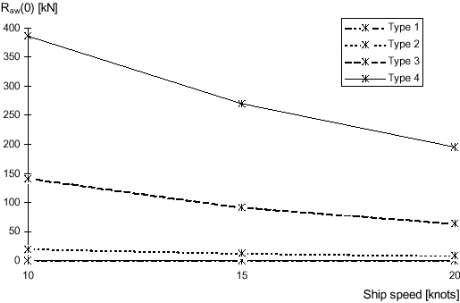
Figure 83. The added resistance in head sea by strip theory for the four sea-states.
The added resistance drops then increasing the speed. This is because the encounter frequency of the waves gets a higher value than the natural period of the ships pitch movements and therefore decreases the ships movements, this results in a lower added wave resistance.
It should be noted that the applied theoretical method has a few limitations in comparison with model test. The strip theory takes into account only the added resistance due to the interactions of the waves and the movement of the ship. Thus, the reflection of the incoming wave field and the pressure variation on the hull (which is normally in-significant) is not included.
WindShip Speed Loss due to Waves
Ship’s speed loss due to added wave resistance is included in the VPP program developed by DMI/SL, see Ref. 7. By plotting the WindShip speed in head wind at 100% engine power we get the following graph, see Figure 84 below.
Figure 84. Look here please
Figure 84. The WindShip speed at 100% power in increasing headwind.
As mentioned the wave height were functions of wind speed. Look here for further information.
[Front page] [Contents] [Previous] [Next] [Top] |