[Front page] [Contents] [Previous] [Next] |
Modern Windships; Phase 2
Appendix 8. Determination of Individual Forces on each Wing mast Member
For comparison the forces on each panel is determined from wind speed = 25 m/s. The wing mast profile can be found in Figure 87 below.
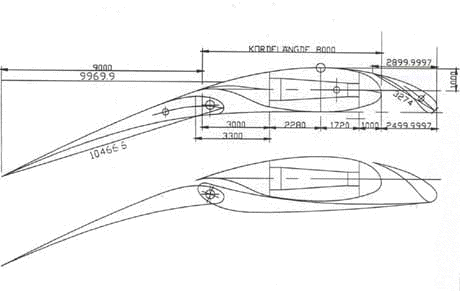
Figure 87. Profile plan with dimensions.
There is no information readily available on the Cl, Cd and CN for the separate profiles shown in Figure 87 above. This is not surprising since they were drawn by "freehand" at P-KEH. Moreover we cannot determine the individual profiles angle of attack a , nor their interaction. Since the measurements were not performed in such a manner that the individual profile’s coefficients could be determined, some "engineering judgement" had to be used to estimate these values. Some measurements of profiles with flaps folded out and other high lift devices can be found in [17]. From there the following general conclusions can be found:
| CNc/4 increases with increasing Cl. | |
| Typical value for "normal" asymmetrical profile at high a : Cl = 1.6, CNc/4 = - 0.05. | |
| Typical value at high a for a single flapped profiles: Cl = 2.8, CNc/4 = - 0.0875. | |
| Multiple flap profile at high a : Cl = 3.2, CNc/4 = - 0.1875. |
A square and linear fit of the above information yields, see Figure 88 below:
Figure 88. Square curve fit of the Cl-CN dependency. Linear approximation CN(Cl) = 0.0774-0.07332*Cl.
Looking at the profile plan in Figure 87 above we can estimate that the more curved the centreline of the profile, the more they will contribute to the lift, thereby having the largest rotating moments. It is therefore probable that the leading edge slat and the trailing flap will be induce larger force- and moment coefficients than the average values that were measured for the entire wing. The almost symmetrical mast profile will consequently contribute to a slightly lesser degree.
From Figure 88 we have that the square curve fit seems to decrease the CN with increasing lift at lower values of CL, this was judged unphysical and the curve was disregarded. The linear approximation was used to determine the individual profiles values of CN.
In order to determine the individual forces from each profile we have to make an assumption regarding the overall lift contribution from each profile. The calculations leading to the individual lift and moment distributions can be found in Table 31
Naming the first profile (the slat) no.1, the mast no.2 and the flap no.3 we have the following dimensions:
Profile no |
chord length c [m] |
quarter chord [m] |
profile depth [m] |
percent of chord [%] |
Area [m2] |
1 |
3.274 |
0.82 |
0.24 |
7.3 |
141.1 |
2 |
8.0 |
2.00 |
0.14 |
1.8 |
344.8 |
3 |
10.466 |
2.62 |
0.60 |
5.7 |
451.1 |
All, sum or average value |
Entire wing: 19.5 |
- |
- |
Average: 4.93 |
Sum: 937. Measurements: 838. |
Table 30. Dimensions for the individual profiles.
The discrepancy in areas between the summed areas and the area used during the measurements is due to the difference in projection.
From the measurements we have that the max. Cl was 3.2 for the entire wing. To calculate the forces acting on the individual profiles we first scale the lift coefficient linearly with the curvature of the individual profiles. To get the forces we then distribute the lifting force according to the area and lift coefficient ratios. For the area distribution the area value used in the measurements was used. The total lift, drag and yawing moment from the measurements at a wind speed of 25 m/s at an angle of attack a = 21° can be calculated to:
![]()
![]()
![]()
Since drag is dependent on the square of the lift force we can estimate the individual profile’s drag from the lift coefficient. The moment in each individual profile is also estimated using the approximate curve fit seen in Figure 88 above.
Table 31. Scaling the lift coefficient linearly with the depth of the profile : Look here please
Note on individual member forces estimation
The area based Cl of 3.27 is ok, using 838 m2 for the wing area. Area based Cd of 1.2 also seems ok. The lift (L) and drag (D) forces calculated in eqs.(x-y) above are judged coherent with the values here calculated for the individual profiles.
The values for CN are however considered slightly unrealistic. From ref.[17] it is clear that the pitching moment should be a function which is relatively independent of the angle of attack (a ). From DMI report (1) we see that this is not the case. Run 412 (the chosen configuration) has a pitch moment coefficient CN that varies 25% in a span of 0 - 20° . The extrapolation performed in Figure 88 above is also very rough. The changing CN with a in DMI report no. 1 indicates that there are some profile interaction effects that really needs to be looked into by CFD (computational fluid dynamics) or more detailed measurements before the individual profile’s pitching moments can be determined. In lack of such the values in Table 31 are used.
[Front page] [Contents] [Previous] [Next] [Top] |