[Front page] [Contents] [Previous] [Next] |
Aquatic Environment 1999
2. Water and climate
Because weather determines how and in what forms and in what amounts water is present on the Earth, it is of considerable importance for leaching of nutrients from the land and for nutrient loading of the aquatic environment, and hence for the state of the aquatic environment. Variation and shifts in the water cycle can often be explained by variation in the climate, as can variations in the chemical and biological conditions in the aquatic environment. In order to be able to demonstrate the effects of a given measure on the aquatic environment it is necessary to be able to filter out natural variations. It is therefore vital to know the natural variation in the weather and the factors involved in the water cycle - both short-term and long-term.
2.1 The water cycle
There are more than one thousand million cubic kilometres of water on the Earth. All the water in the World is part of the water cycle, whether freshwater or seawater, and whether it occurs in the form of water, water vapour or ice.
The driving force behind the water cycle is the sun. It evaporates water from open water bodies such as the sea, lakes and watercourses, and also drives the biological system and the evaporation that occurs from living organisms. Condensed water vapour in the atmosphere falls to the Earth as precipitation in the form of rain or snow. Part of the precipitation that falls on the landmass is subsequently transported to the sea - either by watercourses, in the groundwater or as ice in glaciers. Part of the water is used on the land in biological processes.
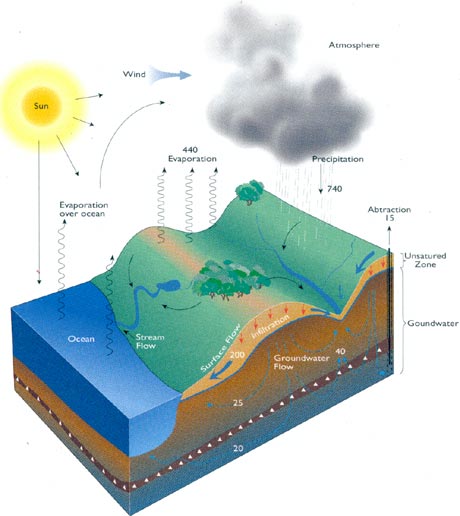
Figure 2.1
The water cycle (from GEUS, 1997).
The gross precipitation is the term for the total amount of precipitation (both rain and snow) that falls on the landmass. The gross precipitation is around 113,000 km3 - corresponding to 113,000,000,000,000 m3 - per year for the whole World (GEUS, 1997).
A large part of this precipitation immediately returns to the atmosphere via evaporation from the water surface (e.g. lakes and watercourses), as well as via evaporation from the biological system - especially plants. Annual evaporation from the landmass totals around 72,000 km3.
That part of the precipitation that remains on the landmass and is available for the lakes, watercourses and groundwater, etc., is called the net precipitation. Global net precipitation thus amounts to 41,000 km3 per year. Of this, 29,000 km3 flows out to the sea via watercourses, while "only" about 12,000 km3 of the total precipitation seeps down into the ground and contributes to the formation of groundwater.
As part of the net precipitation is used to drive the hydrological system, it is only practically possible to exploit 10-30% for the water supply, etc.
If sustainable exploitation of the net precipitation is assumed to be 15%, the total global exploitable water resource will be approx. 6,000 km3 per year. This should be seen in the context of global water consumption, which was 3,800 km3 in 1995. Extrapolating the prognoses for development in the population and per capita consumption makes it clear that problems will arise with the water supply in a number of additional countries. From a global point of view the water supply is thus considered by some to be the most serious resource problem of the 21st Century.
2.2 Meteorological and hydrological conditions in 1998
Temperature
In Denmark, 1998 was a relatively warm year. The temperature data for 1998 thus show that
February in particular was warm, while the summer was relatively cool. Figure 2.2 shows
the temperature variation during the year together with the mean value for the period 1967-1998.
Figure 2.2
Mean temperature for Denmark calculated on a weekly basis. The normal represents
the monthly average of the period 1961-90 (Adapted
from Grant et al., 1999).
Wind
1998 was a relatively windy year. The average wind speed was 7.6 metres per second at the
coastal stations, somewhat above the normal of 6.6 metres per second (Břgestrand et al.,
1999).
Irradiance
The sun only shone for 1,571 hours in 1998 compared with the normal of 1,670 hours (1971-90). A record low of 88 sunshine hours was recorded in
September (Břgestrand et al., 1998).
Precipitation
Precipitation is unevenly distributed throughout Denmark. Thus southern Jutland and mid
and western Jutland receive considerably more water than the country as a whole, while the
western and southern parts of Zealand receive less. Variation in precipitation for the
country as a whole during the monitoring period is shown in Figure 2.3 together with the
average precipitation for the preceding normal period (1961-90).
Figure 2.3
Annual precipitation in Denmark for the period 1989-98
expressed relative to the normal for 1961-90 (adapted
from Břgestrand et al., 1999).
1998 was a very wet year. With a national average of 860 mm precipitation, 1998 was the next wettest year since 1874.
Groundwater recharge
That part of the precipitation on the landmass that does not run off in the watercourses or evaporate from water bodies or living organisms seeps down to the groundwater and is termed the groundwater recharge. The magnitude of the groundwater recharge to a given aquifer depends not only on the magnitude of the net precipitation, but also on the geological conditions between the terrain and the groundwater aquifer and the characteristics of the aquifer.
In principle, the groundwater recharge is available for water abstraction. In practice, however, the geological and chemical conditions in the ground will limit the technical possibilities for abstraction. Politically determined concerns as to for example the amount of water in watercourses and lakes set other limits for the extent of groundwater abstraction.
Water abstraction
The water supply in Denmark is predominantly based on groundwater, with more than 98% of the water supply consisting of water abstracted from groundwater aquifers. Lake and/or watercourse water is only used for the water supply in very few places. In 1998, a total of 741 million m3 groundwater was abstracted (GEUS, 1999).
The abstraction of groundwater in Denmark is very decentralized. As a consequence, the abstraction wells are distributed throughout most of the country. This is an advantage for nature and reduces the impact of abstraction on the environment of watercourses and lakes. The water supply is thus distributed between approx. 3,100 public common (i.e. waterworks supplying at least 10 properties) and approx. 2,750 private common plants. In addition, there are a number of local individual water supplies to institutions, industry, irrigation, sports grounds, market gardens, freshwater fish farms and households.
Groundwater table
Sounding of the groundwater table gives an idea of the amount of groundwater. The groundwater table is subject to natural seasonal variation with a maximum around April and a minimum around October. It is the winter precipitation in particular that determines the magnitude of the groundwater recharge. This is because evaporation and water uptake by plants are much lower in the winter period than in the summer, when the majority of the precipitation that falls on the landmass is taken up and evaporates via the vegetation. The variation in winter precipitation and the groundwater table are thus closely coupled, as illustrated in Figure 2.4.
Figure 2.4
Variation in precipitation and groundwater table over the period 1951-94 (adapted from GEUS, 1999).
It can be seen that the groundwater table has varied considerably over the past few years. Because of the very dry winters in 1996 and 1997 the groundwater table fell to its lowest level during the past 25 or so years (Figure 2.4). In spring 1999, the high groundwater table re-established after the dry winters.
Runoff
Freshwater runoff to the sea consists of riverine runoff and surface runoff. Total runoff to the Danish marine waters in 1998 is estimated at approx. 16,000 million m3 corresponding to 363 mm. Runoff in that year was therefore 11% above the normal for the period 1961-90 of 327 mm. The variation in runoff during the monitoring period is illustrated in Figure 2.5.
Figure 2.5
Freshwater runoff for Denmark over the period 1989-98
expressed relative to the normal for 1961-90 (adapted
from Břgestrand et al., 1999).
The runoff response to the very high level of precipitation has generally been less than expected due to the fact that the groundwater aquifers had become depleted in the preceding three years. In Břgestrand et al. (1999), it is estimated that approx. 200 mm of the net precipitation in 1998 was used to recharge the groundwater aquifers.
Hydrographic conditions
The description of the overall hydrographic conditions in Danish marine waters in 1998 is based on measurements from NOVA-2003 and meteorological observations etc. and subsequent calculations (DHI, 1999a and 1999b).
Due to a general inflow of water to the Baltic Sea, the salinity of Danish marine waters was relatively high during the first months of 1998, ranging from 33 PSU (approx. the same as 33‰) in the northern Kattegat to 10-22 PSU in the area near the Darss Shelf (between Gedser and Germany), where stratification occurred at a depth of approx. 10 m. The inflow, which amounted to approx. 200 km3, was superseded in March and April by an outflow from the Baltic Sea of approx. 450 km3. As there was only a weak net inflow of around 50 km3 during May and June, the salinity of the inner Danish marine waters fell during early summer 1998 relative to that at the beginning of the year. The salinity varied from around 14 PSU in the surface waters of the Kattegat to around 28 PSU in the bottom water. At the Darss Shelf, the water column was homogenous with a salinity of 10-12 PSU.
From mid July until the beginning of October, there was a high level of outflow from the Baltic Sea. A total of approx. 360 km3 water flowed out, and the salinity in the inner Danish marine waters therefore remained low during that period. In the last months of 1998 the situation fluctuated, with 200 km3 water flowing into the Baltic Sea in October, 300 km3 flowing out in November and a small amount flowing into the Baltic Sea again in December. The overall result of the varying current conditions was that the salinity in the Kattegat at the end of the year was low but increasing due to the inflow in December.
At the beginning of the year, the Jutland Coastal Current led water up past Hanstholm and northeast along the northwestern coast of Jutland. At the same time, circulation arose in the surface waters of the Skagerrak. This dissipated later in the year, though, and the Jutland Coastal Current concomitantly became weak. From July to the end of the year there was once again marked circulation in the Skagerrak, but the Jutland Coastal Current remained weak until the last months of the year, when it became stronger again.
Water transport
The accumulated transport of water and salt is calculated on the basis of model simulation of the hydrographic conditions (DHI, 1999c).
The accumulated transport between the Danish marine waters in 1998 is calculated to be an outflow from the Baltic Sea of approx. 317 km3. This value is 152 km3 less than the net input of freshwater to the Baltic Sea of 420 km3 via runoff and 49 km3 via net precipitation, approx. 469 km3 in all. The difference is balanced by changes in the water mass in the Baltic Sea in that the sea level in the Baltic Sea was approx. 0.4 metres higher at the end of the period (1 January 1999) than at the start (1 January 1998). This difference in sea level calculated by the model is also seen in the measurements.
The distribution of the net transport between the Sound and the Femer Belt was 115 km3: 210 km3 or approx. 4:7, which is a little higher than the long-term relationship of 3:8 calculated in another context. The net transport of salt is towards the Skagerrak from the Baltic Sea corresponding to a reduction of the salinity of the inner Danish marine waters.
2.3 Water balance for Denmark
Drawing up a water balance for Denmark is no easy task, among other reasons because there are over 5 million people in Denmark who utilize and affect the water cycle in many ways, including abstraction for the supply of drinking water, irrigation, drainage and treatment of wastewater, and physical modification of the water bodies, first and foremost channelization of watercourses.
A water balance for Denmark has been established on several occasions (e.g. Schrřder, 1995) taking into account the Danish population's intervention in the natural water cycle. Figure 2.6 illustrates the water cycle in the early 1990s.
Figure 2.6 Look here!
Water balance for Denmark at the beginning of the 1990s. The figures are in
million m3 water (adapted from Schrřder, 1995).
As mentioned in the introduction, a cross-cutting theme report planned for publication in 2001 will in part focus on the water cycle. In connection with preparation of the theme report, attempts will be made to lay the foundation for an annual routine update of a national water balance that will also incorporate descriptions of water transport, including inflow, outflow and exchange of water between Danish marine waters.
[Front page] [Contents] [Previous] [Next] [Top] |