[Front page] [Contents] [Previous] [Next] |
Aquatic Environment 1999
3. Sources of pollution:
Discharges, losses and emissions
According to the programme objective, NOVA-2003 has to quantify loading from the individual sources of pollution of the Danish aquatic environment. For practical reasons, a distinction is made between land-based point sources (Section 3.1), sea-based point sources (Section 3.2) and losses etc. from agricultural land (Section 3.3).
The calculations of discharges and losses are mainly based on NOVA-2003. In several cases, however, the results are supplemented with data from supervision work. The calculation of emissions to the atmosphere is not part of NOVA-2003, but for the sake of completeness is briefly discussed in Section 3.4.
3.1 Land-based point sources
Land-based point sources encompass the following types of source: Wastewater treatment plants, separate industrial discharges, stormwater outfalls, sparsely built-up areas, and freshwater fish farms. The percentage distribution of nutrient discharges for the various types of land-based sources with direct discharges is shown in Figure 3.1.
Figure 3.1
Percentage distribution of discharges of nitrogen (Total-N), phosphorus (total-P)
and organic matter (BOD5) from land-based point sources in 1998.
3.1.1 Wastewater treatment plants
By a wastewater treatment plant is understood a plant that treats wastewater and discharges to watercourses, lakes or the sea. The majority of the treatment plants are public in the sense that one or more municipal councils are responsible for their operation and maintenance.
The calculations encompass all 1,475 treatment plants with a capacity exceeding 30 person equivalents (PE). For practical reasons, moreover, they encompass both public and private treatment plants. In 1998, there were 285 private plants that together treated less than 2% of all Danish wastewater. Municipal plants operated by private companies are included under public treatment plants since it is the municipal councils who are responsible for their operation and maintenance. The size distribution of wastewater treatment plants is shown in Table 3.1.
Table 3.1
Size distribution of wastewater treatment plants in 1998.
| Capacity | PE |
| > 30 | 12,059,552 |
| > 500 | 11,961,884 |
| > 2,000 | 11,704,706 |
| > 5,000 | 11,054,961 |
| > 15,000 | 9,904,548 |
| > 50,000 | 7,945,433 |
| > 100,000 | 5,544,800 |
In 1998, 84% of all wastewater was treated to remove organic matter, nitrogen and phosphorus. The percentage reduction in organic matter, nitrogen and phosphorus at these plants is around 90%, which means that the majority of wastewater in Denmark is treated very effectively. In 1989 in comparison, only 10% of the wastewater was subjected to such treatment.
Total estimated discharge in 1998 was 5,166 tonnes nitrogen, 601 tonnes phosphorus and 3,525 tonnes organic matter measured as BOD5, cf. Table 3.2.
Relative to discharges in 1997, discharges of organic matter and nitrogen have increased by 2% and 6%, respectively. At the same time, the high level of precipitation increased the amount of wastewater by 26% relative to 1997. The increase in discharges of organic matter and nitrogen are largely attributable to the increase in the amount of wastewater as the treatment efficiency for these parameters depends on the hydraulic load to which the plants are subject.
Phosphorus discharges have fallen by 10% relative to 1997. That phosphorus discharges have fallen while discharges of organic matter and nitrogen have increased is attributable to the fact that phosphorus is removed from 98% of all wastewater by phosphorus stripping, a process that is less dependent on the hydraulic load on the plant.
Table 3.2
Distribution of wastewater treatment plants by type, capacity, discharge and degree of
treatment in 1998.
| Plant type | Treatment plants |
Discharge |
Degree of treatment |
|||||
| No. | 1,000 PE | Tot-N | Tot-P | BOD5 | Tot-N | Tot-P | BOD5 | |
tonnes |
% |
|||||||
| No treat- ment |
2 |
1 |
4 |
1 |
15 |
- |
- |
- |
| Mecha- nical |
433 |
89 |
219 |
37 |
594 |
20 |
36 |
26 |
| MC | 24 | 150 | 123 | 7 | 286 | 48 | 81 | 85 |
| MB | 501 | 383 | 498 | 82 | 208 | 43 | 81 | 48 |
| MBC | 237 | 863 | 857 | 45 |
294 | 58 | 87 | 87 |
| MBND | 10 | 107 | 47 | 11 | 28 | 76 | 88 | 56 |
| MBNDC | 268 | 10,466 | 3,419 | 418 | 2,100 | 85 | 92 | 92 |
| Total | 1,475 |
12,059 | 5,166 |
601 |
3,525 |
- |
- |
- |
The abbreviations represent the following treatment levels: MC –Mechanical-chemical; MB – Mechanical-biological; MBC – Mechanical-biological-chemical; MBND – Mechanical-biological with nitrogen removal; MBNDC – Mechanical-biological-chemical with nitrogen removal.
In 1998, the total amount of effluent from the wastewater treatment plants was 2.2 million m3 per day, corresponding to 802 million m3 per year. In addition to household and industrial wastewater, the effluent also derived from rainwater and water infiltrating into the sewers. Based on the calculations of stormwater discharges (see Section 3.1.3) it can be calculated that rainwater accounts for approx. 15% of all the wastewater passing through the treatment plants.
In 1998, data on water seeping into or out of sewers has been reported for 595 plants. Relative to the total wastewater input to the treatment plants for which infiltration into sewers has been estimated, total infiltration into sewers is calculated to be 29%.
The total treatment capacity is just over 12 million PE, cf. Table 3.2. The corresponding figure for total load on the plants in 1998 was 8.8 million PE. That plant capacity is greater than the load is attributable to the fact that the plants have to be able to provide effective treatment during peak load periods.
In 1998, the county authorities have reported data on industrial inputs to treatment plants based on information on wastewater or nutrient and organic matter discharges from industries in the catchment areas of the individual plants. In by far the majority of cases, the figures are rough estimates because the information on which the calculations are based is far from complete. In all, data have been reported on industrial wastewater inputs to 416 treatment plants that together treat approx. 40% of all wastewater. For the country as a whole, industrial wastewater is estimated to comprise 48% of all wastewater.
In 1998, 277 treatment plants were encompassed by the requirement of the Action Plan on the Aquatic Environment to undertake phosphorus treatment or phosphorus, nitrogen and organic matter treatment.
In 1998, 243 treatment plants were subject to a BOD5 treatment requirement of 15 mg per litre or less. Only one plant was unable to comply with this criterion. BOD5 effluent quality was 5 mg per litre or less at 220 of these plants. 276 plants were subject to a phosphorus treatment requirement of less than or equal to 1.5 mg P per litre. Of these, only one plant failed to comply with the criterion. Around half of the plants were subject to a more stringent requirement than the 1.5 mg per litre stipulated in the 1987 Action Plan on the Aquatic Environment. With regard to nitrogen, 215 plants were subject to a treatment requirement of 8 mg per litre or less. Of these, eight failed to comply with the nitrogen criterion.
The county authorities have provided the Danish EPA with various supplementary information for use in the preparation of special supervision reports. A total of 1,190 municipal treatment plants are registered. In 1998, county authorities carried out 2,728 site inspections at 1,135 of these plants, corresponding to an average of approx. 2.4 visits per plant per year. Among other things, the inspections encompass measurements of effluent concentrations and calculation of compliance with the discharge limit values stipulated in the discharge permits.
171 plants exceeded one or more discharge limit values in 1998, corresponding to 14% of all municipal treatment plants or 16% of the inspected plants.
Of the 171 plants that exceeded their discharge limit values in 1998, 89 had exceeded their discharge limit values for two or more years. This means that 82 plants only exceeded their discharge limit values in 1998 and not in 1997. Table 3.3 shows the number of treatment plants that have exceeded their discharge limit values for 2, 3, 4 and 5 or more years in a row. The number of plants having exceeded their discharge limit values on only a single occasion (i.e. in 1998) is also shown.
Table 3.3
Plants with exceedences for more than five years down to a single exceedence in 1998.
| No. of years | No. of plants |
| 1 yr (1998) | 84 |
| 2 yr in a row | 31 |
| 3 yr in a row | 26 |
| 4 yr in a row | 10 |
| >5 yr in a row | 20 |
| Total | 171 |
In 1998, county authorities took the following enforcement measures in reaction to the above-mentioned compliance failures: 69 plants have been served a recommendation, 5 plants have been served an order, 39 plants have been served an injunction and 31 plants have received de facto legalization. Finally, 2 plants have been reported to the police. The remaining 25 plants (corresponding to 15%) have been dealt with by other means. Some counties authorities have taken more than one enforcement measure against the same plant. The figures given above only include one enforcement measure per plant.
Wastewater content of heavy metals
In 1998, heavy metals concentrations were measured at 4 selected treatment plants. These treatment plants treat 10% of all Danish wastewater. The treatment plant Lynetten in Copenhagen is the largest in Denmark. The load here is typically of that for a large urban community. Lundtofte treatment plant in Lyngby-T�rb�k and T�rnby treatment plant are both medium-sized treatment plants receiving approx. 20% industrial wastewater. Grindsted treatment plant is a small plant receiving a medium-sized industrial load. All four plants are dimensioned for nitrogen and phosphorus removal, and effluent levels are generally better than the requirements. The Danish EPA considers these plants to be fairly representative as regards handling and composition of wastewater in Denmark. A greater than average percentage of the wastewater treated by the plants derives from industrial sources, however.
As yet the necessary analysis methods or documentation for the quality of the heavy metals analyses are not available. The mean values and deviation for the heavy metals content of inflow to and outflow from the four treatment plants in 1998 are shown in Table 3.4. Although the calculated discharges of heavy metals are subject to considerable uncertainty, it is nevertheless the Danish EPA’s assessment that they provide a good idea of the magnitude of the discharges.
Table 3.4
Mean concentration and deviation for heavy metals in inflows and outflows in 1998.
| Metal | Mean |
Deviation |
Mean |
Deviation |
Inflow |
Outflow |
|||
m g/l |
m g/l |
|||
| Arsenic (As) | 5.7 | 3.7 |
3.2 |
2.4 |
| Lead (Pb) | 33.0 | 51.0 |
2.5 |
1.0 |
| Cadmium (Cd) | 0.8 |
1.1 |
0.1 |
0.1 |
| Chromium (Cr) | 5.1 |
2.0 |
1.2 |
0.7 |
| Copper (Cu) | 40.0 |
16.0 |
17.0 |
10.0 |
| Mercury (Hg) | 0.5 |
0.7 |
0.2 |
0.1 |
| Nickel (Ni) | 5.9 |
2.5 |
5.0 |
2.3 |
| Zinc (Zn) | 390.0 |
381.0 |
168.0 |
177.0 |
With most of the heavy metals, the deviation is large relative to the mean values, cf. Table 3.4. This indicates inter-plant differences in the composition of the wastewater depending on which industries, etc. are connected to the individual plants. The large deviation in the monitoring results also reflect inaccuracy in the measurements, however. Relative to the measurements made by the Danish EPA in 1994 and 1996, the measured values in 1998 are of the same order.
The inflow values are typically slightly lower than previously while the outflow values for the individual heavy metals are slightly higher than previously. This is more an expression of a characteristic of the four plants investigated in 1998 than of a general increase or fall in the wastewater content of heavy metals.
Discharge limit values for the Aquatic environment
Comparison of the outflow concentrations of heavy metals with the discharge limit values for discharges to the aquatic environment reveals that the former are generally at a lower level than the discharge limit values stipulated in Ministry of Environment and Energy Statutory Order No. 921 of 8 October 1996. Thus the concentrations measured in the outflow from the treatment plants are not critical relative to the discharge limit values stipulated for the aquatic environment.
Table 3.5
Heavy metals discharges
| Metal | kg |
| Arsenic (As) | 10,000 |
| Lead (Pb) | 1,700 |
| Cadmium (Cd) | 500 |
| Chromium (Cr) | 2,000 |
| Copper (Cu) | 9,000 |
| Mercury (Ni) | 500 |
| Nickel (Ni) | 11,000 |
| Zinc (Zn) | 90,000 |
Estimated total discharges of heavy metals from wastewater treatment plants are shown in Table 3.5. The values have been arrived at by first extrapolating from the measurements at the four treatment plants investigated in 1998. These results were then compared with data from Aquatic Environment 1994 (Danish EPA, 1994a) and the total discharges thereafter estimated. The estimates are thus based on data from both studies. The total discharge was calculated by taking the average of all the measured outflow concentrations and multiplying by the total amount of wastewater effluent from all treatment plants in 1998.
Another method of estimating the total discharge could be to base the calculations on the amount of heavy metals discharged per PE for the four treatment plants investigated and thereafter multiplying by the total number of PE connected to all treatment plants. Such calculations yield discharges for 1998 that are 10-40% lower than the calculations based on the amount of wastewater. It is therefore believed that the figures in Table 3.5 are overestimated relative to the real discharges of heavy metals.
Comparison of discharge data for 1994 and 1998 reveals that for most heavy metals, total discharge is of the same order both years. The calculated discharges of arsenic, cadmium, mercury, chromium and nickel are lower than in 1994 while the discharges of zinc, lead and copper are higher than in 1994. The Danish EPA considers that this is more an expression of a characteristic of the four treatment plants investigated in 1998 than a general increase or fall in discharges of these heavy metals.
Heavy metals content of sewage sludge
In 1998, a number of heavy metals were also measured in sewage sludge from the four treatment plants. The amount of sludge investigated in 1998 corresponds to approx. 10% of the total amount of sludge generated in Denmark. Of the sludge investigated, approx. 20% is applied to farmland. On a national basis, approx. 60% of all sewage sludge is applied to farmland. The sludge measured in 1998 thus represents a large part of the sludge that is not applied to farmland.
Table 3.6
Mean value and deviation for the heavy metals content of sewage sludge in 1997. DM:
Dry matter
| Metal | Total amount |
Mean |
Deviation |
kg |
mg/kg DM |
mg/kg DM |
|
| Arsenic (As) | - |
6.0 |
3.2 |
| Lead (Pb) | 10,000 |
170 |
213 |
| Cadmium (Cd) | 300 |
3.3 |
3.5 |
| Chromium (Cr) | 5,000 |
24 |
7.7 |
| Copper (Cu) | 35,000 |
270 |
51 |
| Mercury (Hg) | 200 |
1.7 |
1.9 |
| Nickel (Ni) | 3,000 |
22 |
5.4 |
| Zinc (Zn) | 110,000 |
888 |
130 |
Each year, the Danish EPA collects data on sewage sludge from all Danish wastewater treatment plants. The data for 1997 are summarized in Danish EPA (1999b). Comparison of the data in that report and the figures in Table 3.6 shows that the measured values are of the same order. The values for cadmium and lead are a little higher than measured in 1997, though.
Sewage sludge intended for application to farmland has to meet certain requirements as to the content of heavy metals, etc. These requirements are stipulated in Statutory Order No. 823 of 16 September 1996 on the Application of Waste Products for Agricultural Purposes (Ministry of Environment and Energy, 1996). Relative to these requirements, the measured values for cadmium and lead are higher on a dry matter basis.
The total amount of heavy metals in sewage sludge was calculated from the Danish EPA's concentration measurements made in 1997. The calculations are based on approx. 90% of all sewage sludge generated in Denmark. It is thus believed that the calculated amounts for the total content of heavy metals in sewage sludge give a good impression of the magnitude of the resultant discharges.
Trend since 1989
Since 1989, discharges from wastewater treatment plants have been reduced considerably. The total amount of organic matter discharged has been reduced by 90%, while discharges of nitrogen and phosphorus have been reduced by 71% and 87%, respectively. The trend in discharges of organic matter, nitrogen and phosphorus during this period is illustrated in Figure 3.2.
Figure 3.2.
Trend in discharges from wastewater treatment plants over the period 1989-98.
Figure 3.3
Total wastewater discharge and annual precipitation over the period 1989-98.
Over the period 1989–98, inputs to the treatment plants varied from 8.2 to 9.4 million PE. The fluctuation in the magnitude of the loads is attributable to uncertainty in the calculation method, which is largely based on a relatively few measurements at the individual plants. The variation in plant capacity can be due to former uncertainty as to whether it was the physical capacity or the approved capacity that had to be reported. The total number of treatment plants continues to fall and wastewater treatment is being collected at larger and more advanced plants.
The number of exceedences of discharge limit values in percent of the total number of treatment plants with discharge limit values fell from 39% in 1989 to 25% in 1995, increased to 30% in 1996, fell to 20% in 1997 and fell further to 16% in 1998. The number of plants with controlled discharge limit values has been roughly constant for the past five years. Since the total number of municipal treatment plants has concomitantly fallen, the share of plants with controlled discharge limit values is increasing. The number of plants that have exceeded discharge limit values is the lowest recorded since 1989.
3.1.2 Separate industrial discharges
The calculations of separate industrial discharges encompass direct discharges to watercourses, lakes and the sea from enterprises that are required to have a discharge permit under the Environmental Protection Act. The calculations do not encompass discharges from enterprises etc. that discharge less than 30 PE or which solely discharge cooling water or uncontaminated surface water.
The year gone by
The calculations encompass a total of 109 enterprises etc. with one or more direct outfalls to watercourses, lakes or the sea. Of these, 32 are encompassed by the requirement of the Action Plan on the Aquatic Environment to reduce nutrient discharges (APAE-enterprises). Of the 109 enterprises, 87 discharge nitrogen, phosphorus and/or organic matter. Fifty-four are reported by the county authorities as discharging hazardous substances. Due to a lack of information, enterprises in Vestsj�lland, Bornholm, Viborg and Nordjylland counties that might discharge hazardous substances are not included in the calculations.
The total amount of wastewater discharged via separate industrial discharges amounted to approx. 64 million m3 in 1998, of which approx. 43 million m3 was discharged from APAE-enterprises.
Table 3.7
Discharges of heavy metals and inorganic trace elements via separate industrial
discharges in 1998 (minimum values).
kg |
|
| Aluminium (Al) | 6 |
| Arsenic (As) | 10 |
| Barium (Ba) | 600 |
| Lead (Pb) | 66 |
| Cadmium (Cd) | 10 |
| Chromium (Cr) | 360 |
| Cyanide | 2 |
| Copper (Cu) | 454 |
| Mercury (Hg) | 2 |
| Molybdenum (Mo) | 252 |
| Nickel (Ni) | 397 |
| Selenium (Se) | 12 |
| Strontium (Sr) | 44,000 |
| Silver (Ag) | 2 |
| Tin (Sn) | 1 |
| Vanadium (V) | 33 |
Zinc (Zn) |
670 |
Discharge of nutrients from separate industrial discharges in 1998 amounted to 1,428 tonnes nitrogen and 124 tonnes phosphorus. Relative to 1997 this represents a 21% reduction in nitrogen discharge and a 14% reduction in phosphorus discharge. Of the 1,428 tonnes nitrogen discharged, 1,189 tonnes derived from APAE-enterprises and 239 tonnes from other enterprises. Of the 124 tonnes phosphorus discharged, 100 tonnes derived from APAE-enterprises and 24 tonnes from other enterprises.
Of the total land-based point-source discharges of nitrogen and phosphorus, separate industrial discharges accounted for around 14% and 9%, respectively, cf. Figure 3.1. The fish processing industry remains the main industrial source, accounting for 46% of the nitrogen discharge and 52% of the phosphorus discharge. The amount of organic matter discharged from separate industrial discharges in 1998 was approx. 10,700 tonnes BOD5 or approx. 24,100 tonnes COD. Of this, discharges from APAE-enterprises comprised approx. 9,100 tonnes BOD5 or 21,300 tonnes COD. Relative to 1997, this represents a reduction of 6% for BOD5 and 23% for COD.
While the separate industrial discharges are of minor significance as regards nutrient loading, they are one of the main sources of organic matter loading, accounting for around 43% of total land-based point-source discharges calculated as BOD5. Most of this derives from the sugar industry (61%) and the fish processing industry (32%).
Table 3.8
Discharges of hazardous substances via separate industrial discharges in 1998 (minimum
values).
kg |
|
| Pesticides | 5 |
| Aliphatic amines | 8,787 |
| Aromatic hydrocarbons | 1,254 |
| Phenolic compounds | 86 |
| Halogenated aliphatic hydrocarbons | 30 |
| Halogenated aromatic hydrocarbons | 189 |
| Chlorophenols | 265 |
| Polyaromatic hydrocarbons | < 1 |
| Anionic detergents | 23 |
| Ether | 2 |
| Aldehydes, amides, etc. | 2,213 |
| AOX | 15 |
The information reported by the Counties on the amount of hazardous substances discharged to water bodies in 1998 via separate industrial discharges is summarized in Tables 3.7 and 3.8. The calculations are based on enterprise in-house control and county supervision data. Data collection is thus not aimed at producing a nationwide estimate of discharges, neither with respect to the nature nor the amounts of the substances discharged. As already mentioned, moreover, such information is lacking from four of the 14 Danish counties. For the same reason, the amounts stated in Tables 3.7 and 3.8 are minimum values for the discharge.
The majority of the hazardous substances and the heavy metals mentioned are included in the NOVA-2003 sampling programme. With many of the substances, however, the necessary analysis methods or documentation for the quality of the analyses are not yet available. As a consequence, the estimates given in the tables are subject to considerable uncertainty.
Other substances discharged in separate industrial discharges in 1998 are chlorine, formiat, acetate, iron, ferro-iron and oil.
Several of the hazardous substances reported on by the Counties in 1998, including mercury and cadmium, as well as chlorophenols, aromatic halogenated hydrocarbons and halogenated aliphatic hydrocarbons, are List I substances pursuant to Council Directive 76/464/EEC on Pollution caused by Certain Hazardous Substances Discharged into the Aquatic Environment of the Community, i.e. pollution with them should be terminated. The directive has been implemented in Danish legislation through Ministry of Environment and Energy Statutory Order No. 921 of 8 October 1996. In this connection, discharge limit values were stipulated for List I substances. The concentrations in the wastewater from the separate industrial discharges are not generally considered to be critical compared with these discharge limit values.
No information is available from the Counties on what concrete efforts are being made to terminate pollution by these substances.
Trend since 1989
The total amount of wastewater discharged has fallen since 1989. Discharge peaked in 1991 at 100 million m3 and thereafter fell until 1996, since when it has remained constant at just under 65 million m3 per year. Total discharge from APAE-enterprises has remained roughly constant throughout the period at between 40 and 45 million m3 per year except in 1991-92, when discharge amounted to 56 million m3.
Total nitrogen discharge via separate industrial discharges fell by 37% alone from 1989 to 1990 and has generally been falling since then. The total reduction since 1989 is 78%, cf. Figure 3.4.
In the case of the APAE-enterprises alone, the percentage reduction in nitrogen discharge since 1989 is less than for all enterprises together, among other reasons because an increasing number of enterprises are falling in under the requirements of the Action Plan on the Aquatic Environment. It is therefore of interest to follow separately those APAE-enterprises for which data is available back to 1989. Total discharge from these enterprises has fallen steadily during the period from 2,065 tonnes to 839 tonnes except for the fact that an extraordinarily high discharge from the fishmeal industry in 1992 made that year's total discharge the period's greatest at 2.237 tonnes. The total reduction over the period 1989-98 was 59%.
The trend in phosphorus discharge via separate industrial discharges since 1989 is largely the same irrespective of whether the discharge is calculated for all enterprises (Figure 3.4), for all APAE-enterprises together, or for APAE-enterprises for which information is available back to 1989. The total discharge fell markedly until the mid 1990s, since when it has remained relatively stable. Taking all enterprises together, the total discharge fell from 1,412 tonnes in 1989 to 124 tonnes in 1998, corresponding to 91%. In the case of APAE-enterprises for which information is available back to 1989, the total discharge has fallen from 810 tonnes to 48 tonnes, corresponding to 94%.
The total BOD5 discharge via separate industrial discharges, which was 56,205 tonnes in 1989, fell steadily until 1996, whereafter it seems to have stabilized at around 10,000 tonnes BOD5 per year. The reduction in the total discharges between 1989 and 1998 amounted to 81% (Figure 3.4).
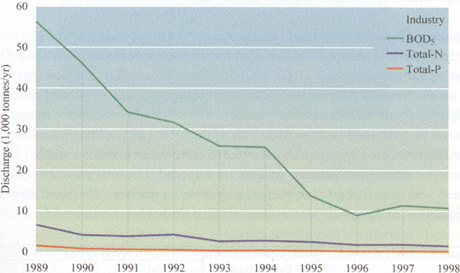
Figure 3.4
Trend in total discharge of nitrogen, phosphorus and organic matter via separate
industrial discharges over the period 1989-98.
Total BOD5 discharge from APAE-enterprises varied around 19,000 tonnes per year from 1989 to 1992, thereafter falling to around 6,400 tonnes in 1996, since when it has increased slightly again. This development to some extent reflects the fact that there are presently more APAE-enterprises than in 1989. In the case of the APAE-enterprises for which information is available back to 1989, the total discharge halved between 1989 and 1991-92, falling from 20,305 tonnes to around 10,000 tonnes. The reduction continued less steeply until 1996, whereafter the discharge increased slightly to 6,778 tonnes in 1998. The total reduction in BOD5 discharge from these APAE-enterprises over the period 1989-98 was 67%.
With regard to hazardous substances, annual estimates of total discharges via separate industrial discharges have not previously been made. The Danish EPA (1994) has previously estimated the total discharge of the heavy metals lead, copper, chromium, nickel and zinc from separate industrial discharges to be 5 tonnes in 1993, while the corresponding discharge in 1998 was 2 tonnes. As with the present figures, the figures for 1993 are subject to considerable uncertainty, and there is no reason to believe that the difference in the two figures reflects a marked decrease in the discharges.
3.1.3 Stormwater outfalls
The calculations of stormwater outfalls encompass all stormwater discharges to watercourses, lakes and the sea from drained areas such as roofs, road surfaces, paths and paved surfaces to the extent that these are connected to the sewerage system. Stormwater discharges can be divided into:
| Separate discharges of surface runoff, and | |
| Stormwater overflows from combined sewerage systems, where the discharge consists of a mixture of surface runoff and wastewater. |
The year gone by
The most important parameter for calculating the discharge from the stormwater outfalls is the precipitation. 1998 was a generally wet year. On average, 860 mm precipitation fell on the whole country, which is more than 20% above normal. This led to correspondingly greater stormwater discharges from both separate and combined sewerage systems.
The number of stormwater outfalls and associated total and paved catchment areas is shown in Table 3.9. The total area serviced by sewerage systems is 241,300 ha. Of this, paved surfaces comprise 71,600 ha, corresponding to 5% of the total area. The paved area is virtually equally distributed between separate and combined systems, although with considerable regional variation. Thus 90% of Copenhagen municipality is serviced by combined systems while only approx. 30% of Copenhagen county is serviced by combined systems. A total of 5,395 stormwater overflows and 9,136 stormwater outfalls from separate systems are recorded. The total paved area has remained largely unchanged, but there is an increasing tendency for paved areas of both combined and separate systems to discharge via holding basins.
Table 3.9
No. of outfalls/overflows and total and paved catchment area for combined and separate
sewerage systems with and without holding basins in 1998.
| Sewerage system | No. of outfalls/ |
Area (ha) |
|
Total |
Paved |
||
| Combined without basin | 4,148 |
67,822 |
22,034 |
| Combined with basin | 1,247 |
41,236 |
11,969 |
| Combined, total | 5,395 |
109,058 |
34,003 |
| Separate without basin | 7,560 |
90,601 |
24,618 |
| Separate with basin | 1,576 |
41,649 |
12,945 |
| Separate, total | 9,136 |
132,250 |
37,563 |
Total discharge in 1998 was just under 20% greater than for a normal year, amounting to 244 million m3 water containing 968 tonnes nitrogen, 253 tonnes phosphorus and 16,192 tonnes organic matter measured as COD. The higher discharge is due to the very high level of precipitation.
In 1998, an analysis was undertaken of stormwater overflows from wastewater treatment plants with a capacity exceeding 5,000 PE. The plants reported the total amount of overflow discharge from the whole of their catchment area serviced by combined systems. The analysis showed that despite the fact that the overflow discharges currently comprise less than 3-4% of the total load generated in the catchment areas of the treatment plants, in many cases they are of the same magnitude as the total discharge via the plants' outfalls. On average, though, they only comprise approx. 12% of the organic matter and nitrogen, and 30% of the phosphorus.
Trend since 1989
The calculated discharges of nitrogen, phosphorus and organic matter during the period 1989-98 are shown in Figure 3.5 together with the precipitation for the same period. The figure shows that there has been little interannual variation in the discharges but that they follow the level of precipitation.
Figure 3.5
Trend in the total discharges of nitrogen, phosphorus and organic matter (COD)
from separate and combined sewerage systems.
Within the catchment areas of combined sewerage systems, the paved area from which discharge takes place via a holding basin increased by 34% over the period 1992-98, while the paved area where discharge does not take place via a holding basin decreased by 10%. The increase is attributable to the construction of new basins. In 1998, there were holding basins on the drainage systems from 35% of the paved area serviced by combined systems.
3.1.4 Rural properties
The rural areas typically represent ordinary dwellings. The properties lie outside the sewerage system catchment areas and discharge their wastewater via plants having a capacity of less than 30 person equivalents (PE). Most of the wastewater is ordinary domestic sewage.
The year gone by
In 1998, there were a total of approx. 346,500 properties in the rural areas. These comprise houses located in summer cottage districts, allotment cabin districts, sparsely built-up areas, and villages. The distribution by property type of all the properties in Denmark located outside the sewerage system catchment areas and discharging less than 30 PE is shown in Table 3.10.
Table 3.10
Rural properties apportioned by property type and type of sewage treatment.
| Treatment type | Summer cottages |
Allotment cabins |
Sparsely built-up areas |
Villages |
Other1 |
Total |
| Soakaways | 86,753 |
2,233 |
76,234 |
4,435 |
179 |
169,834 |
| Other without discharge | 8,053 |
5,252 |
4,961 |
466 |
64 |
18,799 |
| Mini treatment plants | 23 |
0 |
82 |
36 |
8 |
149 |
| Biological sand filters | 2 |
0 |
357 |
120 |
2 |
481 |
| Other with discharge | 12,867 |
410 |
122,910 |
20,751 |
275 |
157,210 |
| Total | 107,698 |
7,895 |
204,544 |
25,808 |
528 |
346,473 |
"Other"1 refers to properties with an atypical sewage load compared with ordinary dwellings, for example schools, institutions, office buildings, hotels, etc. Under treatment type, "Other without discharge" refers to other types of treatment plants that do not discharge effluent to watercourses, lakes or the sea.
By far the majority (60%) of the registered properties in rural areas are located in sparsely built-up areas. Summer cottages also comprise a large group, accounting for approx. 30% of the properties.
Treatment established
Table 3.10 also shows the treatment that the wastewater from the rural properties undergoes. It can be seen that approx. half of all the properties discharge their wastewater via soakaways, i.e. that no discharge takes place to watercourses, lakes or the sea. It should be noted that approximately half of these soakaways are located in summer cottage districts. The treatment type "Other, with discharge" (cf. Table 3.10) is limited in extent since only 5% of the properties have established such systems. Thus just under half of all the properties in rural areas discharge wastewater to watercourses, lakes or the sea. Permanent residences account for 90% of these properties.
Less than one percent of the properties in rural areas discharge their wastewater via mini treatment plants or biological sand filters, cf. Table 3.10. The remainder typically discharge into drains following mechanical treatment.
Discharges in 1998
The calculated discharges of nitrogen, phosphorus and organic matter from rural properties in 1998 are shown apportioned by property type in Table 3.11. There appears to have been a minor fall in discharges to water bodies relative to 1997. The registered change is probably also attributable to the fact that reporting as regards treatment method and hence degree of treatment is more detailed than previously.
The properties in rural areas outside the sewerage system catchment areas discharged treated effluent containing approx. 998 tonnes nitrogen, 228 tonnes phosphorus and 3,888 tonnes organic matter to watercourses, lakes or the sea. Approx. 98% of this input to the aquatic environment derives from permanent residences, with by far the majority coming from rural areas, cf. Table 3.11.
Table 3.11
Total discharges of nitrogen, phosphorus and organic matter from dwellings outside the
sewerage system catchment areas.
Total-N |
Total-P |
BOD5 |
|
Tonnes |
|||
| Summer cottages | 16 | 4 | 70 |
| Allotment cabins | <1 | < 1 | 1 |
| Sparsely built-up areas | 830 | 189 | 3,231 |
| Villages | 145 | 33 | 554 |
| Other | 8 | 2 | 31 |
| Total | 998 | 228 | 3,888 |
In 1998, NOVA-2003 did not encompass measurements of hazardous substances in wastewater effluent from the properties in rural areas. In the coming years, measurements will be undertaken at a few selected treatment plants solely receiving domestic sewage. In future, it will thus be possible to use the measurements from these plants as a basis for estimating the total discharges of hazardous substances from properties in rural areas.
It is nevertheless already possible to provide a qualified estimate of the total discharges of heavy metals, cf. Table 3.12. The heavy metals discharges have been calculated as a combination of estimates based on two models (Danish EPA, 1997a and Danish EPA, 1999b), and are the best estimates that can be made at present. The calculated discharges are subject to considerable uncertainty, however. It is therefore not reasonable to discuss changes relative to previous years. The differences seen should rather be considered as reflecting improvement in the calculations.
Table 3.12
Calculated discharges of selected hazardous substances in 1998.
| Substance | kg |
| Aluminium (Al) | 1,000 |
| Arsenic (As) | 30 |
| Lead (Pb) | 200 |
| Cadmium (Cd) | 30 |
| Chromium (Cr) | 200 |
| Copper (Cu) | 1,000 |
| Cobalt (Co) | 60 |
| Mercury (Hg) | 20 |
| Nickel (Ni) | 500 |
| Silver (Ag) | 30 |
| Zinc (Zn) | 4,000 |
The future improvement in the treatment of the wastewater that can be expected to result from the initiatives in Act 325 of 14 May 1997 on Wastewater Treatment in Rural Areas (Ministry of Environment and Energy, 1997) must be presumed to have a positive effect as regards heavy metals. It can be expected that the trend will be towards a continual reduction in heavy metals discharges to the aquatic environment.
Wastewater treatment plans
Based on the Regional Plans, which stipulate where treatment of wastewater from rural areas is to be improved, the municipal authorities plan a combination of connection to the sewerage system, soakaways and local treatment of a specified type etc. which will have to apply to the properties in rural areas.
At present, the municipal wastewater plans only encompass a few percent of the properties in rural areas. This is too slender a basis to create a picture of the future types of wastewater treatment for these properties.
The Counties that have a Regional Plan covering wastewater treatment in the rural areas have had difficulty in assessing whether the adopted municipal wastewater treatment plans are in accordance with the Regional Plans with respect to improvement of treatment. Often the Counties have reported that the plans are in accordance. Only in very few cases has it been reported that there is a lack of accordance between the Regional Plan and the wastewater treatment plan requirements as to treatment.
Trend in discharges from properties in rural areas
The calculated discharges are subject to uncertainty. Hence it is not reasonable to discuss changes in the discharges relative to previous years. The changes hitherto observed should be considered as reflecting improvement in the calculations. There has been a real decrease in the discharge of phosphorus, however.
3.1.5 Freshwater fish farms
Freshwater fish farms raise salmonid fish, especially rainbow trout, and for this purpose utilize stream water that is subsequently discharged into watercourses, lakes or the sea.
The year gone by
In 1998, there were 423 freshwater fish farms in operation. Net production of fish was 32,585 tonnes. Total feed consumption was 31,607 tonnes, including feed for the mother fish. Just over 1 kg fish was thus produced for each kg feed used.
The calculations of discharges from freshwater fish farms indicate that 1,241 tonnes nitrogen, 92 tonnes phosphorus and 3,430 tonnes organic matter (BOD5) were discharged in 1998. Based on information on water supply conditions at the fish farms, their total water consumption is estimated to be at least 4,300 million m3 per year.
Relative to the total input of nutrients to the marine environment, the contribution from the freshwater fish farms is limited except in a few estuarine fjords in eastern Jutland (e.g. Mariager Fjord), where phosphorus discharge by freshwater fish farms accounts for a major part of the total load. Similarly, phosphorus loading from freshwater fish farms accounts for a major part of the phosphorus input to a number of lakes in mid Jutland.
The primary impact of the freshwater fish farms on the aquatic environment occurs locally in the watercourse reaches where the fish farms are located. This effect is associated with the discharge of organic matter derived, like the nutrients, from fish excreta and uneaten fish feed.
In connection with the freshwater fish farming, a large amount of medicine (antibiotics) and auxiliary substances are used to prevent and combat various parasites, bacterial diseases and viral diseases. In 1998, the three most used auxiliary substances were copper sulphate (10.2 tonnes), chloramine (10.4 tonnes) and formalin (164 m3). It has not been possible to calculate the total consumption of medicine in 1998.
Trend since 1989
Over the period 1989-98, a considerable reduction has taken place in the calculated discharges of nitrogen, phosphorus and organic matter, cf. Figure 3.6. Relative to 1997, the level of the three parameters is largely the same. Over the period 1989-98, the theoretically calculated discharge of organic matter (BOD5) has decreased by 49%, while nitrogen has decreased by 43% and phosphorus by 61%.
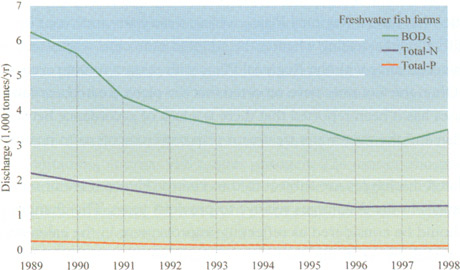
Figure 3.6
Discharges of nitrogen, phosphorus and organic matter from freshwater fish farms
(1993-98).
The decrease in discharges is primarily attributable to increasing compliance with the provisions of the Statutory Order on Freshwater Fish Farms concerning the establishment of treatment measures and setting annual feed consumption limits, as well as requirements on improved feed quality and better utilization of the feed.
The general reduction in the discharge of organic matter from freshwater fish farms has also been registered through measurements of BOD5 in watercourses. By way of example, Figure 3.7 shows time series for the development in the BOD5 level in two watercourses in Ribe County, where freshwater fish farms are the predominant point source. In accordance with the general reduction in organic matter loading by freshwater fish farms, the BOD5 level in these two fish farm-affected watercourses has fallen considerably. The BOD5 concentrations in watercourses affected by freshwater fish farms remain more than twice that in unaffected reference watercourses, however, cf. B�gestrand et al., 1999.
Figure 3.7
Trend in BOD5 concentration (Flow-weighted average) over the period
1987-98 in two watercourses in Ribe county, where
freshwater fish farms are the predominant point source (Data from Ribe County, 1999).
The trend is also reflected in the biological state of the watercourses downstream of the fish farms. In 1998, approx. 40% of watercourse reaches affected by fish farms had an acceptable biological state. This is a marked increase relative to 1989, when less than 15% of the affected reaches had an acceptable state (Danish EPA, 1999b).
The reported consumption of auxiliary substances has virtually doubled since 1997. It is uncertain whether the increase reflects a real increase in consumption or improved quality of data reporting. Clarification of this question and of the effects of these and other auxiliary substances downstream of the fish farms is a precondition for being able to identify how best to deal with the problem.
The heavy metals content of sludge from freshwater fish farms has attracted increasing attention in recent years. The results of one such study indicate that the majority, especially cadmium and nickel, derive from the river water (COWI, 1998).
3.2 Sea-based point sources
The sea-based point sources encompass mariculture, marine dumping of seabed material, offshore industry and ship-based pollution.
3.2.1 Mariculture
By mariculture is meant the farming of fish in sea-based fish farms or land-based fish farms fed by seawater. The latter are not strictly sea-based point sources, but are included here because they are subject to the same regulations as sea-based fish farms.
In Denmark, mariculture is mainly based on rainbow trout. The trout are usually released in the spring at a weight of 700-800 grammes and grow during the course of the summer half year to reach 3-5 kg by the time they are harvested in the autumn. Feeding the fish results in a loss of nutrients and organic matter to the aquatic environment - primarily in the form of excreta from the fish and uneaten feed.
The year gone by
The sea-based fish farms, of which 25 utilized their authorization permits in 1998, are mainly located in protected areas of the Little Belt, the northern Belt Sea, the sea south of Funen and the Great Belt. In 1998, sea-based mariculture used approx. 6,100 tonnes feed. Net production amounted to approx. 5,200 tonnes fish, of which approx. 300 tonnes was in the form of roe. The majority of the land-based mariculture farms, of which 13 were in operation in 1998, are of an elderly type (earth ponds) located alongside Ringk�bing Fjord. A small number of modern land-based mariculture farms are located alongside the Great Belt and the Little Belt, as well as in northern Jutland out towards the Skagerrak. In 1998, land-based mariculture used approx. 2,500 tonnes feed resulting in the net production of 1,900 tonnes fish.
The total discharges from sea-based and land-based mariculture in 1998 were around 290 tonnes nitrogen, 33 tonnes phosphorus and 1,571 tonnes organic matter. The land-based mariculture farms used approx. 232 million m3 water in 1998.
The total consumption of medicine and auxiliary substances in 1998 as reported by the county authorities was approx. 840 kg plus 16 m3 formalin. The most used auxiliary substances were - apart from formalin - Tribrisin (338 kg) and Aquavet S/T (216 kg). The fate of the substances in the sea-based and land-based mariculture farms is relatively unknown, as are the environmental effects of the consumption of medicine and other auxiliary substances.
Trend since 1987
Since 1987, total discharge from sea-based mariculture has decreased markedly in the case of phosphorus. Thus total discharge was around 40 tonnes in 1987, while less than 30 tonnes per year were discharged in recent years. The total nitrogen discharge from sea-based mariculture has fallen from 300 tonnes per year at the end of the 1980s to around 250 tonnes per year in recent years. Figures for land-based mariculture are only available from 1992 onwards. Total discharges have been relatively stable except for a slight fall in the case of nitrogen, cf. Figure 3.10. Expressed per tonne fish produced, discharges from both sea-based and land-based mariculture have fallen considerably.
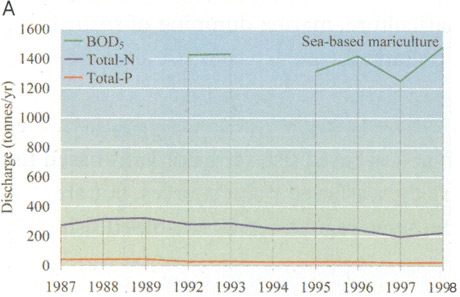
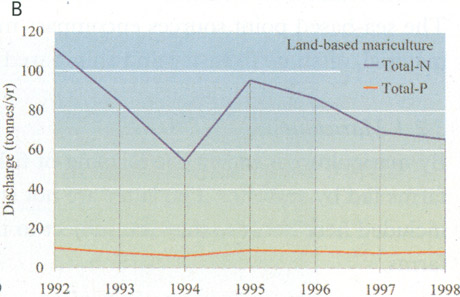
Figure 3.8
Discharges of nitrogen, phosphorus and organic matter from sea-based (A) and
land-based (B) mariculture. No information is available on discharges of organic matter
(BOD5) from land-based mariculture nor for sea-based mariculture in 1994.
Based on the information presently available it is not possible to assess the trend in consumption of medicine and auxiliary substances.
3.2.2 Marine dumping of seabed material
Ship traffic, ferry traffic, fishing vessels and pleasure boats all need harbours and shipping channels of a known depth and width. Each year the county authorities issue permits to dump material from the necessary dredging and excavation operations at selected dumping sites within the County's area of jurisdiction. In some cases, though, the material is so contaminated that a permit for dumping at sea cannot be issued and the material is instead deposited in special deposits near the coast.
Table 3.13
Marine dumping of seabed material (million tonnes) over the period 1989-1998.
| Year | Amount |
| 1989 | 3.3 |
| 1990 | 4.6 |
| 1991 | 8.0 |
| 1992 | 7.0 |
| 1993 | 6.4 |
| 1994 | 5.4 |
| 1995 | 4.2 |
| 1996 | 3.5 |
| 1997 | 4.0 |
| 1998 | 3.7 |
In 1998, approx. 4 million tonnes of dredged and excavated material from harbours and shipping channels were dumped at sea. As is apparent from Table 3.13, no trend can be seen over the period 1989-98. The amount of material very much depends on whether or not major construction projects involving dumping of seabed material have been undertaken during the year in question.
An overview of how much dredged seabed material is deposited on land is not presently available. The material involved usually derives from particularly polluted sections of harbour and surface sediment. Not all the material excavated from harbours and shipping channels is dumped at sea or deposited. Whenever possible, excavated material is used in embankments, roadworks, etc. Another form of recycling is the use of clean seabed material for beach nourishment.
3.2.3 Offshore industry
The activities of the offshore industry result in the discharge of large amounts of substances into the sea, including hydrocarbons, a number of hazardous substances. The major sources of the discharges are:
| Drilling (discharge of drilling muds, cementing chemicals, etc.) | |
| Production water (discharge of residues of hydrocarbons, production chemicals, heavy metals, etc.) | |
| Well maintenance operations (discharge of chemicals), and | |
| Spillage (oils and chemicals). |
The majority of the auxiliary substances and materials used and discharged are considered harmless to the marine environment as they are naturally occurring there or are natural products such as nutshells, cellulose fibres, etc.
Other substances and materials used and discharged into the marine environment are hazardous, however. Depending on the amounts discharged and the inherent properties of the individual substances and materials, including their toxicity, persistence and potential to accumulate in the food chain, the environmental hazard posed varies and will thus be able to affect the marine ecosystems to a varying extent.
The year gone by
According to the annual records submitted to the Danish EPA by the offshore operators, 185 tonnes of oil was discharged into the Danish sector of the North Sea in 1998. The discharge of production water containing oil residues accounted for 174 tonnes while spillage accounted for the remaining 11 tonnes.
The discharge of production water also contributes to heavy metals loading of the marine environment. The heavy metals in production water derive from the oil and gas reservoirs and partly from impurities in production chemicals that can end up in the production water. Barite and bentonite in the drilling muds contain impurities in the form of heavy metals, etc. The amounts of heavy metals discharged reflect the discharges of drilling muds and thus correlate with the number of wells drilled. The figures for heavy metals discharges given in Table 3.14 are based on measurements of production water from a single North Sea field. However, as there can be considerable inter-field variation, the figures are subject to some uncertainty and should be interpreted with caution.
Table 3.14
Marine discharges of heavy metals in connection with drilling (D) and discharge of
process water (P), 1998.
| Metal | D |
P |
kg |
||
| Mercury | 53 |
33 |
| Cadmium | 52 |
7 |
| Zinc | 910 |
98 |
| Lead | 1,318 |
242 |
| Chromium | 209 |
52 |
| Nickel | 135 |
20 |
| Copper | 890 |
38 |
In 1998, 85,316 tonnes of chemical substances and materials were used, of which 41,216 tonnes (48%) are estimated to have been discharged to the sea. The remainder was disposed of in other ways, for example by injection into the seabed, by being taken ashore, or as chemicals mixed in the oil. In addition, part of the chemicals used is retained in the reservoirs during the operations. These might subsequently be retrieved and discharged in the production water. The extent of this is unknown at present, however.
Trend in discharges
In 1998, oil-based muds (OBM), on which there had been a moratorium since 1991, were once again permitted for use in drilling certain sections of difficult wells if their use was deemed to be absolutely necessary. The waste OBM from these drilling operations were disposed of by injection into the seabed or by being taken ashore.
Discharge of oil to the sea in production water increased up through the 1990s (Figure 3.9) due to the general increase in the amount of production water generated. This in turn was partly attributable to increased production during the period and partly an effect of the general ageing of the existing oil and gas fields.
Figure 3.9
Discharge of oil to the sea from the offshore industry. The discharges are
divided into oil-based muds (OBM), production water and spillage. The figure does not
include data on spills for the years 1982-83, 1985-91 and 1993, nor for OBM for the period 1982-83.
The trend in discharges of products containing nonylphenolethoxylates (NPE) in connection with offshore activities is shown in Table 3.15. The development in the discharges of heavy metals from drilling operations is shown in Table 3.16.
Table 3.15
Annual discharge of products containing NPE.
| Year | Discharge of products containing NPE1 |
tonnes |
|
| 1994 | 10.1 |
| 1995 | 8.4 |
| 1996 | 3.9 |
| 1997 | 0.5 |
| 1998 | 0.4 |
1) The values are the amount of product and not the total discharge of NPE.
Table 3.16
Annual discharges of heavy metals in connection with offshore drilling.
| Year | Hg |
Cd |
Zn |
Pb |
Cr |
Ni |
Cu |
kg |
|||||||
| 1991 | 6 |
6 |
541 |
1,121 |
94 |
1 |
636 |
| 1992 | 17 |
18 |
2,734 |
1,107 |
115 |
6 |
729 |
| 1993 | 12 |
14 |
1,051 |
2,258 |
162 |
27 |
1,257 |
| 1994 | 5 |
4 |
348 |
806 |
67 |
23 |
350 |
| 1995 | 7 |
6 |
550 |
1,280 |
97 |
29 |
646 |
| 1996 | 25 |
22 |
636 |
1,606 |
126 |
49 |
110 |
| 1997 | 31 |
34 |
651 |
785 |
155 |
103 |
470 |
| 1998 | 53 |
52 |
910 |
1,318 |
209 |
135 |
890 |
3.2.4 Ship traffic
Ship traffic can also have environmental effects. These are primarily associated with oil spills and the effects of antifouling agents.
Oil spills from ships
When oil pollutes our coasts and beaches the impact on their recreational value to the population is considerable, and can affect the tourist industry in the region.
In nature, oil can also cause considerable damage to ecosystems, animals and plants. The best known effect is on seabirds, whose plumage forms an effective water-repellent and insulating layer. When a bird comes in contact with oil this protective layer is destroyed. The feathers stick together.
In the winter, an oil spot the size of a large coin is sufficient to reduce a bird's insulation such that it dies. Seabirds can also suffer internal damage by consuming oil in the form of oil-contaminated food or when cleaning their oil-coated plumage. The damage is often so great that the birds have little chance of surviving. To avoid heat loss to the surrounding cold water, oil-coated birds often seek onto the coasts where they collect. This renders them very visible and can arouse attention.
Shallow-water areas, which are very productive during the summer and home to fish fry, are very vulnerable to oil pollution. In winter, moreover, the Danish marine waters house large populations of diving ducks etc., just at a time when they are most vulnerable to oil pollution. Bird deaths due to oil pollution are thus almost solely observed during the winter period from October to April. The pollution primarily affects eider ducks, common scoters, velvet ducks and long-tailed ducks.
Relative to the 1970s, when up to 100,000 birds possibly perished, the number of bird deaths as a result of oil pollution has fallen considerably up to the present time. Oil pollution is thus hardly likely to pose a threat to the populations any longer, but still poses an animal welfare problem.
It is not possible to give exact figures for the amount of oil illegally discharged into Danish marine waters. However, it is possible to illustrate the extent of the problem using examples of the number and distribution of oil pollution incidents over the years. A new investigation of the number of oil-coated birds during the period 1984 to 1995 shows a decrease in the Baltic Sea and the Kattegat, but no similar fall in the Skagerrak and the North Sea (Ornis Consult, 1996). In addition, the number of oil pollution incidents in Danish marine waters reported to the Naval Operations Command has remained rather constant over the past 5-10 years at around 400 reports per year - despite a general increase in ship traffic, cf. Table 3.17.
Table 3.17
Annual oil spill reports.
| Year | No. of reports |
| 1989 | 319 |
| 1990 | 345 |
| 1991 | 454 |
| 1992 | 356 |
| 1993 | 320 |
| 1994 | 354 |
| 1995 | 405 |
| 1996 | 393 |
| 1997 | 360 |
| 1998 | 476 |
The number of reported observations of oil pollution cannot be used directly as an indicator of whether or not there is a serious oil pollution problem in Denmark. As a rule, more than half of all observations concern either light oil/diesel, which evaporates, or mud or algae or current boundaries, i.e. false alarms. The Danish EPA considers that these figures indicate that the measures implemented to combat oil pollution have had a preventative effect. The environmental problem is greatest in the North Sea, where unlawful dumping of waste oil still takes place occasionally with resultant pollution of the Jutland west coast. On 1 August 1999, a new international ban on discharges of waste oil in the North Sea entered into force. A corresponding ban has existed for some years in the other Danish marine waters.
Antifouling agents
In order to hinder fouling of ship hulls they are coated with paint containing toxic substances. These have a broad spectrum of impact in the environment such that in addition to having effects on the organisms that cause fouling, they also have undesirable side effects on the environment.
The antifouling agent tributyl tin (TBT), which was introduced in the 1960s, is one of the most toxic substances deliberately released into the marine environment. It is toxic to a number of aquatic organisms, especially molluscs such as snails and mussels, which are affected at extremely low TBT levels right down to under 1 ng/l (Fent, 1996).
In the sea, TBT causes hormonal disturbances that can be registered as the so-called imposex phenomenon in whelks. Imposex is the development of male sexual characteristics in female snails and in extreme cases can lead to sterility and death. NOVA-2003 has encompassed monitoring of the effects of antifouling agents since 1998 (see Section 5.4).
3.3 Cultivated land
In Denmark, 62% of the country is agricultural land and of this, just over 90% is under crop rotation. No other country in Europe has such a high percentage of cultivated land. Agriculture and hence its structure, practices and land use thus have a decisive influence on the aquatic environment and nature in general.
Specialization and intensification of agriculture in Denmark has resulted in a development towards fewer but larger farms and intensively operated livestock farms. The overall livestock density has remained roughly constant, but the average herd size has increased six- to seven-fold over the period 1970-96 by six- to seven-fold in the case of pig herds and 4-fold in the case of dairy herds. The period up to the mid 1980s was characterized by increasing consumption of fertilizer and pesticides. Among other things, this led to loss and discharge of nutrients and hazardous substances, including pesticides etc. to the aquatic environment.
Agricultural pressure of the aquatic environment primarily encompasses ammonia volatilization, nitrogen and phosphorus losses, as well as pesticide losses.
Nitrogen and pesticide losses to the aquatic environment have been regulated for a number of years. Since the mid 1980s, a number of national strategies and action plans have formed the framework for this regulation. The individual plans and/or strategies are reviewed in Chapter 6.
3.3.1 Nitrogen
The latest Danish follow-up to achieve the target of a 50% reduction in nitrogen losses from agricultural sources is the Action Plan on the Aquatic Environment II. In 1987, total nitrogen discharge was calculated to be 260,000 tonnes N per year. The target was to reduce the farmyard load by approx. 30,000 tonnes N per year to a practical minimum and the nitrogen load from fields by approx. 100,000 tonnes N per year (Ministry of the Environment, 1987). The farmyard load encompasses discharges of seepage water from manure and silage stores, wastewater from livestock housing, etc., while the nitrogen load from fields largely encompasses nitrate leaching from cultivated land.
In March 1996, the Government estimated that the farmyard load had been reduced by 20-30,000 tonnes N per year. During preparation of the scientific foundation for the Action Plan on the Aquatic Environment II it was estimated that nitrogen leaching from the root zone had been reduced by approx. 17% over the period 1989/90 to 1995/96 (Iversen et al., 1998). As the nitrogen load from fields started at 230,000 tonnes N per year, this corresponds to a reduction of 35,000-40,000 tonnes per year. The analysis also encompassed assessment of the effect of the implemented and planned regulatory measures in agriculture. It was estimated that full implementation of the previously adopted agricultural measures by 1997, i.e. improved fodder utilization and changed norms for utilization of the nitrogen content of livestock manure, as well as changes in set-aside (from 1997 to 2003) and organic farming (leaching potential calculated from 1996 to 1997) would reduce nitrogen leaching by just over 60,000 tonnes N per year.
The measures in the Action Plan on the Aquatic Environment II were designed to ensure fulfilment of the original reduction target. The specific measures in the plan are described in Section 6.2.1 and is expected to further reduce nitrogen leaching by the remaining 37,000 tonnes N per year (Iversen et al., 1998).
The Danish Institute of Agricultural Sciences (1999) has calculated the total nitrogen balance for Danish agriculture from 1979/80 to 1996/97. The calculations are based on statistical information on purchases of commercial fertilizer and fodder and sales of animal and vegetable products. The balance revealed a total nitrogen surplus for Danish agriculture of approx. 510,000 tonnes N per year at the beginning of the 1990s. In 1996/97, the nitrogen surplus was approx. 415,000 tonnes, i.e. the surplus had been reduced by approx. 95,000 tonnes N per year up to 1996/97.
Ammonia volatilization accounts for a major part of the nitrogen load from agricultural sources – just under 93,000 tonnes N per year in 1996, which is the reference year for the scientific assessment of the Action Plan on the Aquatic Environment II (Andersen et al., 1999). According to the Statutory Order on Livestock Manure, liquid manure stores have to be tightly covered, either by a floating cap layer or by some other means. The aim is to reduce ammonia volatilization as well as to reduce the odour problem. It has been shown that compliance with this requirement is inadequate, especially on pig farms (COWI, 1999). Implementation of the Action Plan on the Aquatic Environment II will have a significant positive effect on ammonia volatilization from agriculture (Iversen et al., 1998), which is expected to be reduced by approx. 22% relative to the 1996 level. Most of this is expected to be achieved through a reduction in volatilization from livestock housing and in connection with manure application on fields.
At the end of the year 2000, the Minister for Environment and Energy and the Minister for Food, Agriculture and Fisheries will publish an action plan to reduce ammonia volatilization from agricultural sources together with the mid-term evaluation of the Action Plan on the Aquatic Environment II. The preparation for the mid-term evaluation includes revision of the calculation of the overall nitrogen balance for the agricultural sector, an assessment of the nitrogen balance being needed that integrates estimates of the various losses such as nitrate leaching, ammonia volatilization, farmyard load, gaseous loss via nitrification/denitrification and accumulation in the soil.
3.3.2 Phosphorus
Phosphorus is not individually regulated within the agricultural sector, but is indirectly regulated through the regulations governing the application of nitrogen in the form of livestock manure. The harmony criteria, which are stipulated in the Statutory Order on Livestock Manure, restrict (at the time of writing) the amount of livestock manure that may be applied to 1.7 LU (livestock units) per hectare. In the case of cattle holdings meeting certain crop requirements, the application of livestock manure equivalent to 2.3 LU per hectare is permitted. The harmony criteria are based on the nitrogen content of the manure and hence do not hinder overfertilization with phosphorus. The main inputs of phosphorus take place on livestock farms. The more stringent harmony criteria stipulated in the Action Plan on the Aquatic Environment II for certain types of livestock farm will indirectly reduce the input of phosphorus.
When applying waste products (e.g. sewage sludge) for agricultural purposes the total input of phosphorus may not exceed 30 kg P per hectare per year (from 1 July 2000) according to the Statutory Order on the Application of Waste Products for Agricultural Purposes.
The phosphorus content of the livestock manure produced in Denmark is equivalent to the total phosphorus requirements of Danish crops. An additional approx. 20,000 tonnes P are applied in the form of commercial fertilizer. The problem with phosphorus is that livestock production in Denmark is concentrated in certain regions, primarily north and western Jutland, thus leading to overfertilization with phosphorus, which accumulates in the soil and might leach to the aquatic environment. Foreign studies indicate that when the phosphorus content of the soil is high, very high levels of leaching can occur.
The agricultural sector must therefore work for a more regionally homogenous distribution of the livestock manure, and use livestock manure on as many fields as possible on the individual farms. Similarly, efforts need to be made to reduce the amount of phosphorus in livestock manure through more effective feeding practices.
3.3.3 Monitoring of agricultural land
Monitoring of the significance of farming practice for the aquatic environment
NOVA-2003 encompasses a subprogramme - the so-called agricultural catchment monitoring programme - to monitor agricultural losses and discharges of nutrients and hazardous substances. The programme is based on seven monitoring catchments ranging in size from 5 to 15 km2 - three sandy soil catchments and four clayey soil catchments. The catchments have been selected to represent the country with respect to soil type, climate, size distribution, livestock density, farm mix and crop mix. The catchments differ in several respects from the national average. Until 1997, the most important difference was a higher livestock density relative to the national average. Inclusion of a new catchment in 1998 resulted in an average livestock density of 0.86 LU per hectare, slightly lower than for the country as a whole (0.96 LU per hectare).
The nitrogen balances and leaching, etc. reflect the agricultural practice used. Agricultural practice in the monitoring catchments - for example fertilizer consumption and yield - is assessed from interview surveys. On the national level, estimates of fertilizer consumption etc. are calculated from the relevant statistics. The data collection methods in the agricultural catchment monitoring programme and the national statistics therefore differ. As a consequence of this and other factors, the monitoring catchments differ from the national norm.
The most important results pertaining to the trend in agricultural practice in the agricultural monitoring catchments and in the country as a whole are summarized below.
Crops and livestock herds
In the agricultural monitoring catchments, 71% of the cultivated land consists of winter green fields. Of this, grass including set-aside, winter rape and undersown cereals (e.g. cereals undersown with grass) accounts for 41% and winter cereals for 41%, with root crops, maize, fields with ploughed-in stubble, and Christmas trees accounting for the remaining 18%. Only the first groups and root crops (sugar beet) can be expected to take up significant amounts of nitrogen in the autumn and winter months. The percentage of winter green fields has increased from 67% in 1990 to 71% in 1998.
Important preconditions for being able to utilize livestock manure are rational handling of the manure, i.e. reduced loss from livestock housing and during storage, appropriate storage capacity, and application method and time. In 1998, 92% of the livestock units were located on farms with at least 9 months’ manure storage capacity, an increase of 53 percentage points over the period 1991-98. In general, storage capacity is slightly greater in the monitoring catchments than the national average. Given that the storage capacity is now so good it should no longer limit the effective utilization of livestock manure.
The majority of the livestock manure is applied in the spring with the percentage applied in spring/summer having increased from 51% in 1990 to 81% in 1998. The increase was greatest from 1993 to 1994 since new regulations requiring farmers to have sufficient storage capacity had to be complied with by the end of 1994. From 1997 to 1998, the percentage of solid manure/deep litter increased with a consequent increase in autumn application.
Fertilizer consumption and utilization
Average nitrogen fertilizer consumption in the monitoring catchments decreased over the period 1990-98. The consumption of commercial fertilizer has decreased so that the utilization of the N content of livestock manure has increased 42 percentage points (increase in utilization relative to the level in 1990). The livestock manure was applied in a more appropriate manner in 1994-98 than previously. The method used to apply liquid manure is of considerable importance with respect to utilization of its nitrogen content. Widespread use of trailing hoses can thus ensure better utilization of the nitrogen. The optimal method is subsurface injection as this reduces ammonia volatilization to a practical minimum.
In 1998, approx. 10% of the area of the agricultural monitoring catchments was overfertilized, although the extent of overfertilization has decreased considerably. Around 14% of the properties that used livestock manure in 1998 did not meet the minimum requirement on utilization of the nitrogen content of the manure.
The handling and storage of livestock manure and the method and time of application of the manure and supplementary commercial fertilizer are of central importance as regards utilization of livestock manure in crop production. Possibilities remain to further improve utilization of the nitrogen content of livestock manure, among other means by reducing volatilization of ammonia prior to application. In order to improve utilization of livestock manure, the consumption of commercial fertilizer needs to be reduced even further.
N-Balance for the agricultural monitoring catchments
The nitrogen surplus or net input of nitrogen to fields in the agricultural monitoring catchments increases with increasing livestock density. The nitrogen surplus has fallen from 128 kg nitrogen per hectare in 1991 to 91 kg nitrogen per hectare in 1998, corresponding to a reduction of approx. 29%. The nitrogen surplus in 1998 for crop farms, livestock farms with 0-1.7 LU per hectare and livestock farms with more than 1.7 LU per hectare was 49, 91 and 132 kg nitrogen per hectare, respectively.
Fertilizer consumption in the whole country
The total input of commercial fertilizer nitrogen at the national level has decreased from 392 million kg nitrogen in 1985 to 277 million kg in 1998. The amount of livestock manure applied (without binding, i.e. manure applied directly to fields) has fallen from approx. 12 million kg nitrogen during the period. The total decrease in nitrogen input (commercial fertilizer and unbound livestock manure) to cultivated fields amounts to 22%. During the same period, crop nitrogen requirements (the economically optimal level for the farmer) has fallen by 36 million kg nitrogen. In 1998, nitrogen requirements and inputs of effective nitrogen fertilizer balanced for the first time at the national level (Grant et al., 1999), cf. Figure 3.10.
Figure 3.10
Trend in total and effective nitrogen input, nitrogen requirement and requirement
for commercial fertilizer during the period 1985-98
(adapted from Grant et al., 1999).
Nitrogen balance for Danish agricultural land
Total nitrogen input (commercial fertilizer, livestock manure, fixation by leguminous plants and atmospheric deposition) to agricultural land in Denmark has fallen from 750 million kg nitrogen in 1985 to 613 million kg in 1998. Nitrogen removal in crops has varied between 308 and 408 million kg. The nitrogen surplus has thus been reduced from 380 million kg in 1985 to 247 million kg in 1998 (Grant et al., 1999).
The nitrogen surplus corresponds to the potential loss, which can take place via leaching, accumulation of organic matter pools in the soil, denitrification and ammonia volatilization.
The net input of nitrogen to agricultural land has fallen from 133 kg N per hectare in 1995 to 92 kg N per hectare in 1998, corresponding to a 27% reduction, cf. Table 3.18. It should be noted that the number of livestock expressed in terms of livestock units has been roughly stable with a tendency towards a weak increase since 1985. The ratio of cattle to pigs has changed markedly, however, such that pigs now account for 49% of all livestock units while cattle only account for 46%.
Table 3.18
Nitrogen balance calculated per unit area agricultural land (kg nitrogen per hectare)
in Denmark in 1985, 1995, 1996, 1997 and 1998 (from Grant et al., 1999).
1985 |
1995 |
1996 |
1997 |
1998 |
|
| Commercial fertilizer | 138 |
113 |
105 |
105 |
104 |
| Applied livestock manure | 91 |
92 |
93 |
85 |
87 |
| Sewage sludge | - |
2 |
3 |
2 |
2 |
| Industrial waste | - |
- |
2 |
4 |
4 |
| Total input (incl. atmospheric deposition) |
263 |
239 |
234 |
227 |
229 |
| N removed in harvest | 130 |
131 |
127 |
135 |
137 |
| Input minus harvest N content | 133 |
108 |
107 |
92 |
92 |
Nitrogen leaching from the root zone
Under the monitoring programme, investigations of nutrient leaching from the root zone have been undertaken at 18 field stations in 3 clayey soil catchments and at 14 field stations in 2 sandy soil catchments (prior to 1998 there were a further 8 stations in a third sandy soil catchment). The study covered 9 hydrological years - 1989/90 to 1997/98.
Average leaching from the root zone during the study period (1989/90 to 1997/98) was 69 kg N per hectare per year for the 3 clayey soil catchments and 124 kg N per hectare per year for the 2 sandy soil catchments. Total nitrogen loss to the watercourses was approx. 25 kg N per hectare per year for clayey soils (36%) and approx. 11 kg N per hectare per year for sandy soils (10%). In comparison, leaching to watercourses from uncultivated areas was 0.6-4.3 kg N per hectare per year. Part of the nitrogen that leaches from the root zone will end up in the groundwater.
Leaching of nitrogen is greatest on cattle holdings. Average leaching over the period 1990/91-1995/96 was 63, 69 and 134 kg N per hectare per year, respectively, for crop farms, pig holdings and cattle holdings (Grant et al., 1998).
As there has been considerable climatically determined interannual variation in nitrogen leaching it is difficult to speak of a general trend. Nevertheless, statistical analysis for the period 1990/91-1996/97 shows a tendency towards a fall in the measured nitrogen concentrations in the soil water.
Loss in drainage water
Studies of drainage water in two clayey soil catchments have shown that approx. 42% of the nitrate leaching from the root zone is lost via drains.
Model calculations of nitrate leaching from the root zone
Leaching of nitrate from the root zone depends on a complex interplay between soil, plants, cultivation practice and climate. This interplay is difficult to describe through the use of models, whether these are complex simulation models or more simple empirical equations such as the model used. Determinations of the magnitude of annual leaching are therefore subject to some uncertainty. The model employed is primarily used to describe the temporal developmental and effect of regulatory measures, i.e. it is the changes in nitrogen leaching that are of interest.
The calculations for leaching of nitrogen from the agricultural monitoring catchments have been made using an empirical model (Simmelsgaard, 1991). The calculations assume a normal climate for the farming years 1989/90-1997/98, thereby isolating the significance of climatic variation.
The average calculated leaching for the period 1990/91-1996/97 was 26% less than the measured value. It is believed that the difference is partly attributable to measurement inaccuracy and to the fact that the model is based on a small number of fields fertilized with livestock manure. The model is consequently unable to take into account the mineralization and after-effects of nitrogen resulting from many years of livestock manure application to several of the field stations.
The model calculations for all fields in the 6 catchments show that the change in agricultural practice from 1989/90 to 1997/98 will eventually reduce leaching from the root zone by approx. 25%. Expressed in terms of kg nitrogen per hectare, leaching has fallen most on sandy soils during the period, namely 20 kg N per hectare as compared with 13 kg N per hectare on clayey soils (see Figure 3.11). Among other things, the decrease in nitrogen leaching on sandy soils is attributable to improvements in the handling of livestock manure.
Figure 3.11
Calculated leaching under normal climatic conditions for the six agricultural
monitoring catchments for the farming years 1989/90-1997/98
(adapted from Grant et al., 1999).
Phosphorus balance for the agricultural monitoring catchments
The greatest decrease in phosphorus input to the agricultural monitoring catchments took place from 1997 to 1998 and was primarily due to reduced use of commercial and animal fertilizer. The net input of phosphorus to agricultural land in the monitoring catchments has fallen from approx. 10.5 kg P per hectare in 1991-92 to 5.1 kg P per hectare in 1998.
Phosphorus balance for Danish agricultural land
The input of commercial fertilizer phosphorus per unit area agricultural land fell from 16.7 kg P per hectare in 1985 to 7.7 kg P per hectare in 1998. The input of phosphorus in livestock manure in 1998 was 20.9 kg per hectare. Phosphorus removal in crops has varied between 17 kg and 22 kg phosphorus per hectare. The net input of phosphorus to agricultural land has thus fallen from approx. 15 kg to 11 kg P per hectare over the period 1985 to 1998.
Phosphorus tends to accumulate in the soil, especially on livestock farms, thereby enhancing the soil's so-called phosphorus status. Thus in many areas where the livestock density and hence phosphorus input are high, the phosphorus binding capacity of the soil is very low. The phosphorus status in the form of a phosphorus index is an expression of the amount of soil phosphorus available to plants, and hence also of the risk of loss to the aquatic environment via erosion and leaching. In 1997, more than 50% of Danish soils had a phosphorus index exceeding 4.0. A phosphorus index of 2.0-3.5/4.0 is optimal for crop production.
Phosphorus leaching from the root zone
Leaching of phosphorus from the root zone has been low at the majority of the monitoring stations encompassed by the monitoring programme, averaging 0.049 kg phosphorus per hectare per year during the nine-year measurement period. The concentrations were 0.011-0.015 mg phosphorus per litre. At a few monitoring stations, in contrast, high concentrations have been recorded ranging from 0.042-0.410 mg phosphorus per litre. These high phosphorus concentrations are an effect of the very high soil phosphorus index. The total phosphorus loss from cultivated land to watercourses during the measurement period averaged 0.32 kg P per hectare per year. In the watercourses of the cultivated catchments, the phosphorus concentrations are 3-fold higher than in the uncultivated catchments, therefore considerably affecting most of the lakes.
Loss in drainage water
Phosphorus loss via drains has lain at approx. 0.043 kg P per hectare per year. From the beginning of the runoff year 1998/99, drainage water studies have been extended to also encompass continuous sampling in order to facilitate more accurate determination of phosphorus loss via drains.
3.3.4 Hazardous substances
Hazardous substances
As a part of NOVA-2003, monitoring of hazardous substances is undertaken in the agricultural monitoring catchments. Pesticides or pesticide residues have been detected in the groundwater at approx. 46% of the abstraction well filters investigated. In approx. 10% of these, moreover, the limit level was exceeded. Other hazardous substances have been detected at 5 wells, corresponding to 13% of those investigated. The substances detected are aromatic hydrocarbons, alkylphenol compounds and plasticizers. The groundwater content of hazardous substances is examined more closely in Section 5.1.
Pesticide consumption in Denmark and the agricultural monitoring catchments
The target of a 50% reduction in the consumption of pesticide active substance relative to the average for 1981-85 (see also Section 6.2.2) has been achieved for all pesticide groups except herbicides. The corresponding 50% reduction target for pesticide treatment frequency is far from being met, only an 8% reduction having so far been achieved, cf. Figure 3.12.
Figure 3.12
Treatment frequency and pesticide sales (Danish EPA, 1999d).
3.4 Emissions to the atmosphere
Nitrogen emissions
The aquatic environment and especially the sea receive considerable amounts of nitrogen from the atmosphere. The nitrogen thus deposited derives from both Danish and foreign sources.
Nitrogen emissions to the atmosphere from Danish sources encompass nitrogen oxides (NOx) and ammonia (NH3). The nitrogen oxides mainly derive from power stations, industry and traffic, while the ammonia mainly derives from agricultural sources (see Section 3.3.1). Due to flue gas abatement measures in power stations and industry and catalytic converters on cars, NOx emissions are tending to decline. In 1997, approx. 248,000 tonnes nitrogen were emitted to the atmosphere as nitrogen oxides from Danish sources. Ammonia emissions the same year totalled 102,000 tonnes and have remained largely unchanged since 1989, cf. Figure 3.13.
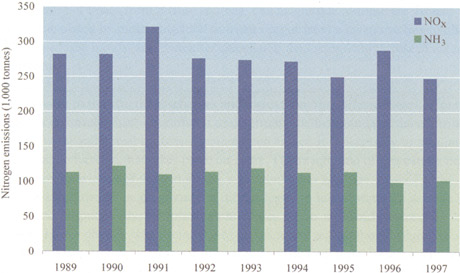
Figure 3.13
Danish emissions of nitrogen (Danish EPA, 1999e).
Heavy metals emissions
Since the beginning of the 1990s, emissions of heavy metals to the atmosphere from Danish sources have decreased, especially in the case of lead, cf. Table 3.19.
Table 3.19
Heavy metals emissions (Danish EPA, 1999e and Illerup et al., in prep.).
| Metal | 1990 |
1994 |
1995 |
1996 |
19971) |
kg |
|||||
| Lead (Pb) | 124,234 |
45,632 |
43,026 |
20,121 |
8,474 |
| Cadmium (Cd) | 1,123 |
1,156 |
1,120 |
1,085 |
847 |
| Mercury (Hg) | 3,171 |
8,196 |
8,485 |
2,677 |
2,126 |
| Arsenic (As) | 1,447 |
1,333 |
- |
1,270 |
839 |
| Chromium (Cr) | 6,200 |
4,724 |
- |
3,399 |
2,958 |
| Copper (Cu) | 9,669 |
14,972 |
- |
10,447 |
8,755 |
| Nickel (Ni) | 26,479 |
27,464 |
- |
25,396 |
21,098 |
| Selenium (Se) | 4,234 |
2,928 |
- |
3,586 |
2,256 |
| Zinc (Zn) | 34,353 |
56,315 |
- |
36,103 |
25,797 |
1) The emission factors for 1997 are updated in relation to previous years. Only 1990 and 1997 have so far been recalculated using the updated factors.
Emissions of hazardous substances to the air
The estimates of annual Danish emissions of hazardous substances to the atmosphere encompass dioxins and furans as well as polyaromatic hydrocarbons (PAH). In 1997, emissions of these substances amounted to 20 g and 1,125 g, respectively (Danish EPA, 1999e).
Emissions of the following substances were zero or close to zero in 1997: Hexachlorobenzene (HCB), hexachlorocyclohexane (HCH), DDT, polychlorobiphenyls (PCB), Aldrin, Chlordane, Chlordecone, Dieldrin, Endrin, Heptachlor, Hexabromobiphenyl, Mirex, Toxaphene, pentachlorophenol and short-chained chlorinated paraffins (Danish EPA, 1999e).
[Front page] [Contents] [Previous] [Next] [Top] |