[Front page] [Contents] [Previous] [Next] |
Aquatic Environment 1999
4. Inputs to inland and marine waters
This chapter examines inputs of pollutants to the various water bodies. Contrary to what one might believe, the magnitude of the inputs to the aquatic environment is not identical with the discharges from the sources of pollution examined in the previous chapter. This is due to the fact that removal or further addition of pollutants occurs at many places along the water cycle. In this connection it is worth remembering that the various parts of the aquatic environment and the pollutant cycles can change roles depending on the angle from which they are viewed. For example, a watercourse polluted by nutrients from a wastewater outfall itself becomes a source of pollution when considering inputs to the sea.
In order to be able to undertake effective environmental management it is necessary to know the amounts of pollutants input to the aquatic environment from the various sectors of society, thereby enabling political initiatives to be targeted appropriately. Not all types of pollution are easy to measure, however. In particular, it is difficult to measure nutrient losses from diffuse sources. The magnitude of these are instead typically calculated by measuring total nutrient output from a given catchment and total point-source inputs, and thereafter calculating the losses from diffuse sources as the difference.
On their route to the sea, the discharges and losses from the different sources intermingle. As a consequence, it is difficult to determine the magnitude of the contribution made by the individual sources. As mentioned earlier, it is necessary to take into account the conversion that takes place on route. The magnitude of this can be determined from knowledge of the conditions, e.g. the number and size of lakes in the individual catchment. The magnitude of diffuse losses to inland waters is assumed to equal riverine inputs to the sea minus point-source inputs to inland waters plus retention. In this chapter when referring to inputs to the sea, all the nutrient removal that takes place between the point of discharge and the final input to the sea or lake is solely applied to the diffuse losses. This consequently leads to slight underestimation of the significance of the diffuse sources relative to the point sources. The reason for doing so is partly because discharges from point sources usually occur far downstream along the watercourses. All other things being equal, the retention processes will therefore have less influence on the point-source discharges. The diffuse sources can be divided into sparsely built-up areas, agriculture and the natural background loss. The latter is calculated on the basis of measurements in a few catchments largely devoid of human activity. The size of this contribution at the national level is thus subject to some uncertainty.
The trend in inputs from the individual sources is naturally highly dependent on the specific measures implemented to combat the source in question. However, it is also very much dependent on natural conditions such as precipitation and temperature. The various types of source differ in "sensitivity" to climatic variation. For example, variation in precipitation affects inputs from cultivated land more than inputs from wastewater treatment plants. One must therefore be cautious when comparing trends in inputs from different types of source over a period of years.
4.1 Nitrogen inputs
This section examines inputs of nitrogen to the inland and marine waters. The most important parts of the nitrogen cycle are outlined in Figure 1.1. Apart from the types of source described in Chapter 3, the present section also examines nitrogen inputs of natural origin, the so-called background loading. The section is divided in two parts, a status report for 1998 and a description of the trend since 1989.
4.1.1 The year gone by
Lakes
NOVA-2003 encompasses 31 lakes selected so as to be representative of all Danish lake types ranging from completely pollution-free clearwater lakes to lakes that have long been affected by high levels of nutrient loading. The relative significance of the various sources of nitrogen inputs to the 31 lakes is illustrated in Figure 4.1.
The rural areas, which encompass the sources sparsely built-up areas, agriculture and background, accounted for most of the nitrogen inputs to the monitoring programme lakes in 1998. As mentioned above, these lakes encompass a very wide spectrum of lake types. As a consequence, calculations of the relative distribution of those source types that have not been directly measured are subject to considerable uncertainty. With this reservation, it is estimated that 60-80% of the inputs derive from agricultural sources. It can be seen that approx. 17% of the nitrogen inputs to lakes derives from the atmosphere. The origins of these inputs are largely to be found in the close vicinity of the lakes, with the main source being ammonia volatilization from agricultural sources.
Watercourses
The relative significance of the various sources of nitrogen inputs to watercourses in 1998 is illustrated in Figure 4.2.
As with lakes, agriculture is by far the most important source of
nitrogen inputs to watercourses.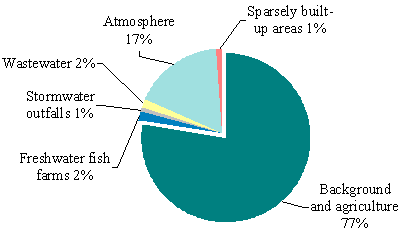
Figure 4.1
Source apportionment of nitrogen inputs to the lakes in 1998 (adapted from Jensen
et al., 1999).
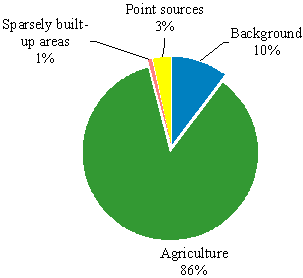
Figure 4.2
Source apportionment of nitrogen inputs to Danish watercourses in 1998 (adapted
from Bøgestrand et al., 1999).
The sea
Compared with inputs to inland waters, inputs to the sea differ in three important respects.
Firstly, it is the inputs from the atmosphere that are of greatest significance. The reason for this is simple, namely that the total area of the marine waters is many times greater than that of the inland waters. Secondly, the same area of sea can behave both as a source and as a recipient of nitrogen. In contrast to watercourses, there is no such thing as one-way flow in the sea. Some days the current runs from the Baltic Sea to the Kattegat while on other days it runs in the opposite direction. Finally, the nutrient retention mentioned in the introduction to this chapter is of greater significance in the case of inputs to marine waters, mainly because the water and hence the nutrients often take a long time to travel from the primary source to the sea. Considerable retention often takes place in lakes and other wetlands along the watercourses. These processes also occur in the coastal areas, where considerable retention and transformation can occur before the nutrients reach the open sea.
The marine environment receives nutrient inputs from a number of different sources. Quite a few wastewater treatment plants and industrial enterprises discharge directly to the sea via marine outfalls. Sources of this type are termed direct point sources. Discharges from land-based and sea-based mariculture, marine dumping of seabed material and discharges from the offshore industry are also encompassed by this category.
Finally, a considerable part of the nutrient inputs to Danish marine waters derives from the atmosphere and adjoining marine waters.
The relative significance of the various sources of nitrogen inputs to the sea in 1998 is illustrated in Figure 4.3.
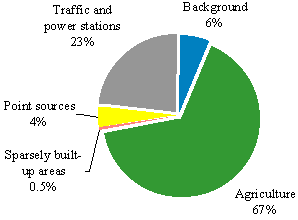
Figure 4.3
Source apportionment of nitrogen inputs to the sea via watercourses, the
atmosphere and direct discharges in 1998 (adapted from Bøgestrand et al., 1999).
The figure encompasses several different input routes: Direct discharges, inputs via watercourses and inputs via the atmosphere. The inputs via the atmosphere encompass both Danish and foreign sources.
The inputs of nitrogen to Danish marine waters via watercourses in 1998 are calculated to be 96,000 tonnes. Inputs from direct discharges amounted to a further approx. 4,300 tonnes. The figures for source apportionment are based on measurements of discharges from point sources and knowledge of the "natural input" and retention.
Total atmospheric deposition of nitrogen on Danish marine waters is calculated to be approx. 104,500 tonnes. Taking all Danish marine waters as a whole, by far the majority of the deposited nitrogen derives from foreign sources. Thus only approx. 14% derives from Danish sources (Skov et al., 1999). In the coastal waters, however, a greater share (up to 50%) will be Danish in origin. The Danish contribution in percent of the total deposition from Danish and foreign sources is shown in Table 4.1. The converse also applies, however, and marine waters of other countries receive nitrogen from Danish sources.
Table 4.1
Contribution from Danish sources in percent of total nitrogen deposition on Danish
marine waters in 1998
(Skov et al., 1999).
| Marine water | % |
| North Sea | 7 |
| Skagerrak | 20 |
| Kattegat | 27 |
| Belt Sea (N) | 29 |
| Little Belt | 23 |
| Great Belt | 21 |
| The Sound | 19 |
| Belt Sea (S) | 9 |
| Baltic Sea | 9 |
| All marine waters | 14 |
Approximately 55% of the nitrogen deposition on the open Danish marine waters is estimated to derive from agricultural sources and the remainder from the combustion of fossil fuels (Frohn et al., 1998). This corresponds to an input of approx. 60,000 tonnes nitrogen from agricultural sources and 45,000 tonnes from industry, power stations and traffic. The latter derive almost exclusively from foreign sources.
Agriculture is clearly the predominant source of nitrogen inputs to the marine areas. Approx. 40% of the agricultural inputs takes place via the atmosphere while the remainder is input via watercourses. As mentioned earlier, only a small part of the total atmospheric deposition of nitrogen derives from Danish sources. It is estimated that approx. 15,000 tonnes of the nitrogen input to Danish marine waters via the atmosphere derives from Danish agriculture (O. Hertel, National Environmental Research Institute, personal communication).
Another important source is the nitrogen inputs from various forms of power production and transport. These inputs take place exclusively via the atmosphere.
Pollutant transport in the sea
As mentioned earlier, considerable amounts of nitrogen are transported to Danish marine waters from adjoining marine waters. In connection with NOVA-2003, a model has been established to describe the exchange of nutrients between the various Danish marine waters.
Based on model simulations of water and salinity conditions during the year 1998, the transport of nitrogen has been calculated for the following three control transects (DHI, 1999c):
| The Sound/Arkona Sea: Dragør-Limhamn | |
| Femer Belt/Arkona Sea: Gedser-Darss | |
| Kattegat/Skagerrak: Vorså-Kungsbacka (over Læsø). |
The calculations show that:
| The net transport of total and inorganic nitrogen from the Baltic Sea to the Sound in 1998 was in a northerly direction (approx. 33,600 tonnes total-N and 406 tonnes inorganic N) | |
| The net transport of nitrogen from the Baltic Sea to the Femer Belt in 1998 was in the direction out of the Baltic Sea (approx. 32,000 tonnes) | |
| Total transport of nitrogen through the transects in the northern Kattegat in 1998 was northerly in direction (approx. 77,000 tonnes). |
4.1.2 The trend
Inland waters
The trend in point-source inputs of nitrogen to inland waters since 1989 is illustrated in Figure 4.4. Wastewater treatment plants still comprise the main point source of nitrogen inputs to inland waters, despite the fact that these have fallen to a third of the original level in 1989. Inputs from industry and freshwater fish farms have also fallen. It is worth noting that for the first time in 10 years, inputs from point sources have increased. The increase, although modest, is seen for both nitrogen, phosphorus and organic matter and is accounted for by discharges from wastewater treatment plants, industry and stormwater overflows. The reason for the increase is that 1998 was a relatively wet year thus placing more pressure on the wastewater treatment plants than in the two preceding very dry years.
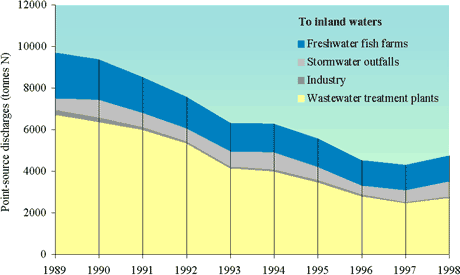
Figure 4.4
Trend in point-source nitrogen inputs to Danish inland waters (adapted from
Danish EPA, 1999b).
The trend in nitrogen inputs to inland waters from all sources since 1989 is illustrated in Figure 4.5. As the trend in inputs to the lakes and watercourses largely follows the same pattern, only the data for the watercourses is presented here as in contrast to the lakes, the watercourses are representative of the whole country. Inputs from the atmosphere, which only account for less than one tenth of a percent, are not included.
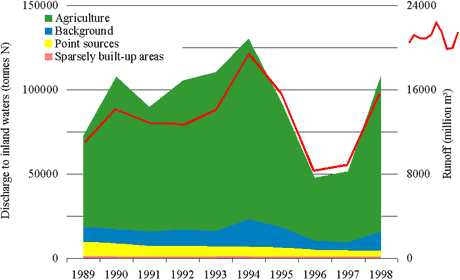
Figure 4.5
Trend in nitrogen inputs to Danish inland waters from all sources except the
atmosphere (adapted from Bøgestrand et al., 1999).
The trend for inputs from all sources is rather different from that for point sources alone. The most obvious feature is that the virtually constant fall in point-source inputs is masked by the great variation in inputs from the diffuse sources.
Since 1989 the agricultural sector has remained the main source of nitrogen inputs to watercourses. If one compares the trend in inputs from agriculture and the background load with the trend in runoff, a close correlation can be seen. This has been tested statistically and it transpires that 90% of the variation in the trend in diffuse sources can be explained by the variation in runoff (Bøgestrand et al., 1999). However, there is a tendency towards a nonstatistically significant fall in the total diffuse (sparsely built-up areas, agriculture and background) inputs of nitrogen to the inland waters. While the uncertainty makes it difficult to pinpoint the reason, a clear fall can be seen in inputs from sparsely built-up areas. This fall is probably attributable to changes in the calculation methods (see Chapter 3). No clear trend can be detected in inputs of nitrogen from the agricultural sector.
When preparing the first report of the Nationwide Monitoring Programme under the Action Plan on the Aquatic Environment in 1990 (Danish EPA, 1990), the conclusion was reached that nitrogen was also being lost to the aquatic environment in the form of the so-called farmyard load. As a result of the action plan's requirements on better manure storage etc., it is assumed that this source of nitrogen input is now negligible. The trend in inputs to watercourses and the onwards transport to the marine waters does not reflect this, however, possibly due to uncertainty in the calculations or due to initial overestimation of the farmyard load.
The sea
The trend in direct point-source inputs of nitrogen to Danish marine waters is illustrated in Figure 4.6. Nitrogen inputs to the sea from point sources have decreased considerably and are now approximately one quarter of the level in 1989. The fall is mainly accounted for by the wastewater treatment plants. These still represent the dominant point source of nitrogen, however.
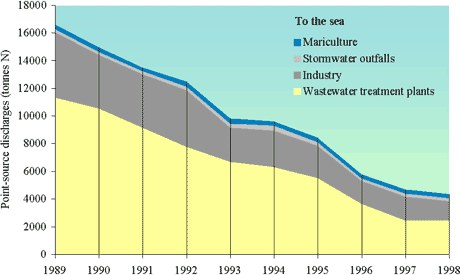
Figure 4.6
Trend in direct point-source discharges of nitrogen to the sea (adapted from
Danish EPA, 1999b).
Total inputs of nitrogen to Danish marine waters from direct point sources, watercourses and the atmosphere are given in Table 4.2. This form of presentation corresponds to the way that the data has to be reported annually to the international conventions OSPAR and HELCOM. The information is combined here in a single table to provide a nationwide impression.
Table 4.2
Discharges and inputs of nitrogen to Danish marine waters via direct discharges,
watercourses and the atmosphere over the period 1989–1998.
Abbreviations: WTP - Wastewater treatment plants, SID - Separate industrial
discharges; SWO - Stormwater outfalls; SBA - Sparsely built-up areas; MFF - Marine fish
farms; DD - Direct discharges; WC - watercourses; AD - atmospheric deposition.
WTP |
SID |
SWO |
SBA |
MFF |
DD |
WC |
AD |
Total |
|
tonnes |
tonnes |
||||||||
| 1989 | 11,300 |
4,700 |
240 |
12 |
320 |
16,700 |
61,900 |
98,000 |
176,600 |
| 1990 | 10,500 |
3,900 |
230 |
12 |
330 |
15,000 |
97,000 |
116,000 |
228,000 |
| 1991 | 9,100 |
3,800 |
240 |
12 |
270 |
13,500 |
78,500 |
108,000 |
200,000 |
| 1992 | 7,800 |
4,100 |
260 |
12 |
360 |
12,500 |
91,700 |
101,000 |
205,200 |
| 1993 | 6,700 |
2,500 |
310 |
12 |
370 |
9,800 |
98,200 |
87,000 |
195,000 |
| 1994 | 6,300 |
2,600 |
370 |
12 |
300 |
9,600 |
119,100 |
99,000 |
227,600 |
| 1995 | 5,500 |
2,400 |
250 |
4 |
350 |
8,400 |
84,400 |
96,000 |
188,800 |
| 1996 | 3,600 |
1,600 |
190 |
3 |
330 |
5,800 |
42,500 |
97,000 |
145,300 |
| 1997 | 2,400 |
1,700 |
230 |
1 |
270 |
4,700 |
45,400 |
96,000 |
146,100 |
| 1998 | 2,500 |
1,400 |
240 |
3 |
290 |
4,400 |
96,600 |
105,000 |
205,900 |
No statistically significant trend is apparent in the calculated atmospheric deposition of nitrogen on the Danish marine waters since 1989. There has been a tendency towards a weak fall, however, although this is not statistically significant (Skov et al., 1999). Measurements of the concentration of nitrogen compounds in the air show a statistically significant fall, however.
The trend in the total inputs of nitrogen to the sea from all sources is illustrated in Figure 4.7. As no trend could be detected in inputs from the atmosphere (see above), these are not included in the figure.
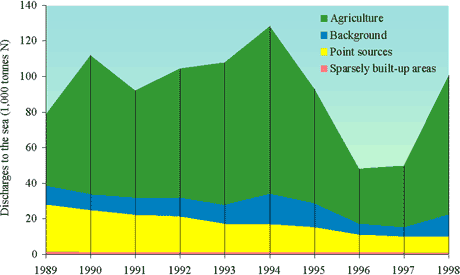
Figure 4.7
Trend in nitrogen inputs to the sea from all sources except the atmosphere
(adapted from Bøgestrand et al., 1999).
The trend in the total inputs of nitrogen to the sea is particularly characterized by the variation in the diffuse inputs, especially from agricultural sources. As with the inputs to inland waters, there is a clear correlation between runoff and the inputs. Even though it is largely the runoff that influences the trend, a statistically significant downward trend in total inputs can nevertheless be detected (Bøgestrand, et al., 1999). Taking the individual marine waters, a statistically significant fall in total inputs of nitrogen via watercourses and direct point sources is seen for all marine waters except the North Sea, the Kattegat and the northern Belt Sea. In contrast, no statistically significant trend is detectable in diffuse loading (Bøgestrand et al., 1999). In those places where a fall in inputs of nitrogen is detectable, this can almost always be attributed to improved wastewater treatment.
4.2 Phosphorus inputs
This section reviews phosphorus inputs to Danish inland and marine waters, examining the same topics as the section on nitrogen. Moreover, it is organized in the same manner, starting with a status report for the year 1998 and thereafter a description of the trend since 1989.
The most important parts of the phosphorus cycle are outlined in Figure 1.2. As with nitrogen, phosphorus can be divided into organic and inorganic compounds. Some phosphorus compounds can easily bind to the soil or other material. Thus in several parts of the phosphorus cycle, large amounts of phosphorus will be stored that under certain conditions can be released into the aquatic environment.
It is also worth noting that phosphorus is not transported around by the air to anything like the same degree as nitrogen.
4.2.1 The year gone by
Lakes
The relative significance of the various sources of phosphorus inputs to the monitoring programme lakes in 1998 is illustrated in Figure 4.8.
As mentioned earlier, the NOVA lakes encompass a wide spectrum of different lake types. For this reason it is not yet possible to undertake complete subdivision of the diffuse sources. It is estimated, though, that agriculture is the dominant phosphorus source in the majority of the lakes. It can be seen that approx. 12% of the phosphorus input to lakes derives from the atmosphere. These inputs originate in the vicinity of the lakes, but it is not possible to apportion them by source either.
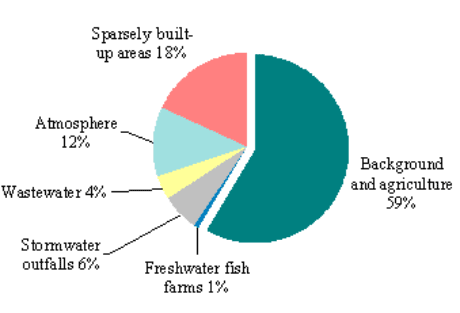
Figure 4.8
Source apportionment of phosphorus inputs to the NOVA lakes in 1998 (adapted from
Jensen et al., 1999).
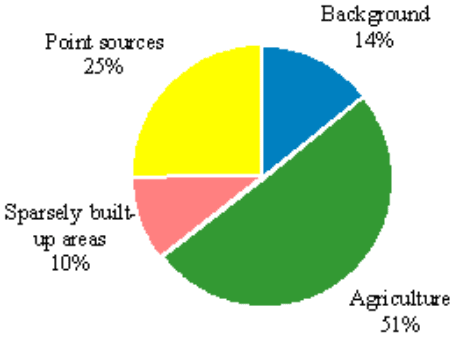
Figure 4.9
Source apportionment of phosphorus inputs to Danish watercourses in 1998 (adapted
from Bøgestrand et al., 1999).
Watercourses
The relative significance of the various sources of phosphorus inputs to watercourses is illustrated in Figure 4.9. As with nitrogen, agriculture is the most important source of phosphorus input to watercourses.
The sea
The relative significance of the various sources of phosphorus inputs to the sea in 1998 is illustrated in Figure 4.10.
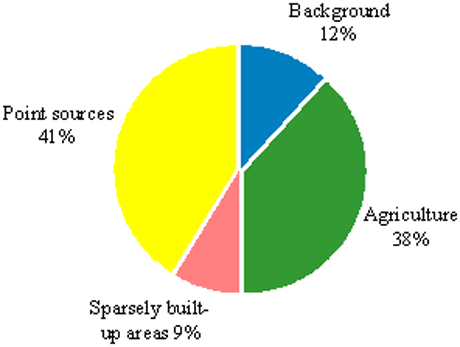
Figure 4.10
Source apportionment (apart from the atmosphere) of phosphorus inputs to the sea
in 1998 (adapted from Bøgestrand et al., 1999).
The phosphorus inputs are roughly equally divided between wastewater (point sources and sparsely built-up areas) and agriculture. This is the first time during the monitoring period that inputs from agriculture exceed the point-source inputs. As the origins and the bioavailability of the atmospheric inputs of phosphorus are largely unknown, these inputs are not included in the figure.
The calculated inputs of phosphorus via watercourses in 1998 are approx. 2,090 tonnes.
Phosphorus deposition on the sea
The deposition of phosphorus on the Kattegat, the northern Belt Sea, the Little Belt, the Great Belt, the Sound and the southern Belt Sea is estimated to be approx. 8 kg phosphorus per km2, corresponding to approx. 280 tonnes phosphorus per year. This estimate is the upper limit for phosphorus deposition. Based on this it is estimated that total phosphorus deposition on all Danish marine waters can be no more than 1,000 tonnes per year. The estimated deposition of phosphorus is subject to considerable uncertainty. A large part of the phosphorus deposition probably derives from biological sources or geological, among other things small soil particles (Ellermann et al., 1997). A very large part of the phosphorus that is input from the air is probably not biologically available.
Phosphorus transport in Danish marine waters
The Danish marine waters also receive large amounts of phosphorus from the adjoining marine waters. Calculations of phosphorus transport based on model simulations of water and salinity conditions during the year 1998 (DHI, 1999c) show that:
| Net transport of total phosphorus took place from the Baltic Sea to the Sound (approx. 1,600 tonnes), while the transport of inorganic phosphorus was in the direction of the Baltic Sea (approx. 155 tonnes). | |
| Net transport of both total phosphorus and inorganic phosphorus took place towards the Baltic Sea from the Femer Belt (approx. 5,600 tonnes total-P and approx. 2,200 tonnes inorganic P). | |
| Total transport of phosphorus through the transects in the northern Kattegat in 1998 was southerly in direction (approx. 1,460 tonnes). |
4.2.2 The trend
Inland waters
The trend in point-source inputs of phosphorus to inland waters since 1989 is illustrated in Figure 4.11.
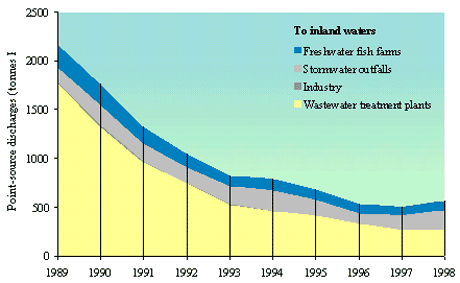
Figure 4.11
Trend in point-source phosphorus inputs to Danish inland waters (adapted from
Danish EPA, 1999b).
Point-source inputs of phosphorus to inland waters mainly derive from the wastewater treatment plants, which have been the dominant source throughout the whole period. The inputs have fallen by around 80%, however. Inputs from freshwater fish farms have also decreased markedly to approx. one third of the level in 1989.
As with nitrogen, this is the first time that inputs from point sources have increased. The reasons are considered to be the same as those for nitrogen (see Section 4.1.2).
The trend in phosphorus inputs to inland waters from all sources since 1989 is illustrated in Figure 4.12. As the trend in inputs to the NOVA lakes and watercourses largely follows the same pattern, only the data for the watercourses is presented here as in contrast to the 31 NOVA lakes, the watercourses are representative of the whole country. Inputs from the atmosphere, which only account for less than one tenth of a percent, are not included.
The trend for inputs from all sources is very different from that for inputs from point sources alone. The most obvious feature is that the virtually constant fall in point-source inputs is masked by the great variations in inputs from the diffuse sources. The inputs of phosphorus from diffuse sources are also closely coupled to the runoff, with almost 85% of the variation being explicable in this way. Thus in this case too, no statistically significant trend is apparent.
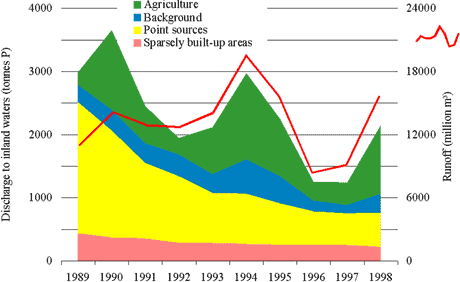
Figure 4.12
Trend in phosphorus inputs to Danish inland waters from all sources except the
atmosphere (adapted from Bøgestrand et al., 1999).
The sea
The trend in direct point-source inputs of phosphorus to Danish marine waters is illustrated in Figure 4.13.
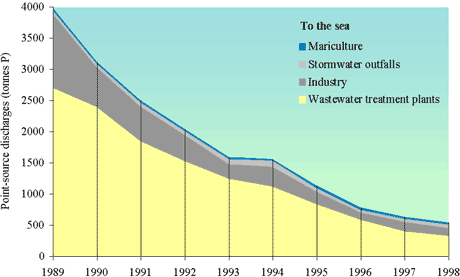
Figure 4.13
Trend in direct point-source discharges of phosphorus to Danish marine waters
(adapted from Danish EPA, 1999b).
The slight increase in point-source inputs to inland waters seen since last year is not reflected in the direct point-source discharges to the sea. One of the reasons is a concomitant major improvement in treatment at Denmark's largest wastewater treatment plant, Lynetten.
As mentioned earlier, atmospheric deposition of phosphorus on Danish marine waters amounts to around 1,000 tonnes per year. There are no signs of any trend as regards inputs from this source. Total inputs of phosphorus to Danish marine waters from direct point sources, watercourses and the atmosphere are given in Table 4.3.
The trend in inputs of phosphorus to the sea from all sources is illustrated in Figure 4.14. Even though total phosphorus inputs to the sea vary markedly in line with the runoff, a clear downward trend can be demonstrated. This is attributable to a downward trend in inputs from point sources. A statistically significant downward trend in inputs from point sources is seen for all the individual marine waters. In the case of the diffuse inputs, a statistically significant fall in inputs can only be demonstrated for the Little Belt, while there is a tendency towards an increase in the other marine waters. On the figure it can be seen that there were no inputs of phosphorus to the sea from agricultural sources in 1989. The reason for this is that the phosphorus removal and retention that took place on route to the sea was greater than the inputs from agricultural sources. This is an example of the relative underestimation associated with calculation of the diffuse sources.
Table 4.3
Discharges and inputs of phosphorus to Danish marine waters via direct discharges,
watercourses and the atmosphere over the period 1989–1998.
Abbreviations: WTP - Wastewater treatment plants, SID - Separate industrial
discharges; SWO - Stormwater outfalls; SBA - Sparsely built-up areas; MFF - Marine fish
farms; DD - Direct discharges; WC - watercourses; AD - atmospheric deposition.
WTP |
SID |
SWO |
SBA |
MFF |
DD |
WC |
AD |
Total |
||
tonnes |
tonnes |
|||||||||
| 1989 | 2,700 |
1,200 |
59 |
5 |
44 |
4,000 |
2,800 |
1,000 |
7,800 |
|
| 1990 | 2,400 |
630 |
56 |
5 |
40 |
3,100 |
3,600 |
1,000 |
7,700 |
|
| 1991 | 1,800 |
560 |
62 |
3 |
36 |
2,500 |
2,300 |
1,000 |
5,800 |
|
| 1992 | 1,500 |
420 |
67 |
3 |
37 |
2,000 |
2,000 |
1,000 |
5,000 |
|
| 1993 | 1,200 |
240 |
78 |
3 |
39 |
1,600 |
2,000 |
1,000 |
4,600 |
|
| 1994 | 1,100 |
310 |
94 |
3 |
32 |
1,600 |
3,000 |
1,000 |
5,000 |
|
| 1995 | 830 |
200 |
65 |
1 |
37 |
1,300 |
2,200 |
1,000 |
3,500 |
|
| 1996 | 580 |
120 |
47 |
0 |
35 |
800 |
1,200 |
1,000 |
3,000 |
|
| 1997 | 400 |
140 |
57 |
0 |
30 |
600 |
1,200 |
1,000 |
2,800 |
|
| 1998 | 330 |
120 |
62 |
0 |
33 |
500 |
2,100 |
1,000 |
2,700 |
|
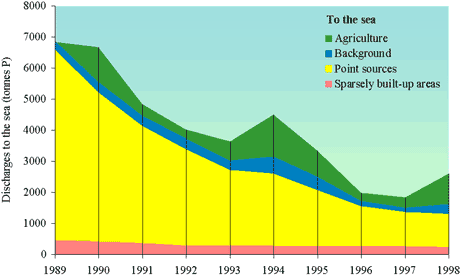
Figure 4.14
Trend in phosphorus inputs to Danish marine waters from all sources except the
atmosphere (adapted from Bøgestrand et al., 1999).
4.3 Organic matter
The estimates of organic matter inputs to the various water bodies only encompass inputs from point sources and sparsely built-up areas. In addition, the inputs to the sea via watercourses are calculated. The inputs from sparsely built-up areas are usually calculated as part of the diffuse sources. In NOVA-2003, however, inputs of organic matter from other diffuse sources are not determined. Thus inputs from sparsely built-up areas are examined here together with the point-source inputs.
4.3.1 The year gone by
The relative significance of the various sources of organic matter inputs to inland waters is illustrated in Figure 4.15. The main sources are freshwater fish farms and sparsely built-up areas. The relative significance of the various sources of organic matter inputs to the sea is illustrated in Figure 4.16. By far the dominant point source of organic matter inputs to the sea is industry.
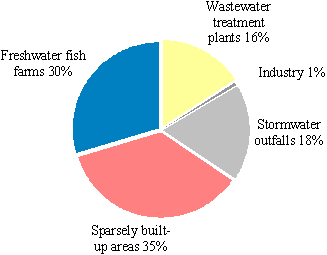
Figure 4.15
Source apportionment of organic matter inputs to inland waters from point sources
(adapted from Danish EPA, 1999b).
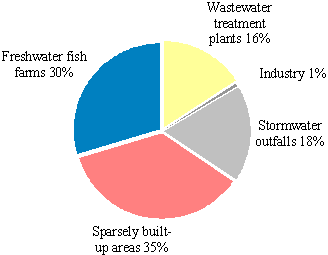
Figure 4.16
Source apportionment of organic matter inputs to the sea from point sources
(adapted from Danish EPA, 1999b).
Inputs of organic matter to the sea via watercourses in 1998 are calculated to be 26,700 tonnes. The majority of this is attributable to natural sources such as algal growth, dead leaves, etc. In 1998, the Danish marine waters thus received a total of approx. 41,000 tonnes organic matter via watercourses and direct point sources.
4.3.2 The trend
The trend in organic matter inputs to inland waters from point sources and sparsely built-up areas is illustrated in Figure 4.17.
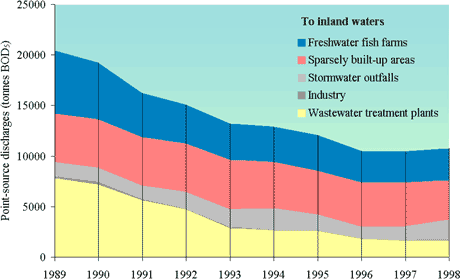
Figure 4.17
Trend in organic matter inputs to inland waters from point sources and sparsely
built-up areas (adapted from Danish EPA, 1999b).
Whereas wastewater treatment plants used to be by far the most important point source of organic matter, inputs from this source have fallen by approx. 80% since 1989. Inputs from freshwater fish farms have also fallen markedly to approx. half of the original level in 1989. Excluding sparsely built-up areas, freshwater fish farms still comprise the most significant source of organic matter inputs to inland waters, however.
It can be seen that sparsely built-up areas have become the greatest single source of organic matter inputs to inland waters. The inputs have only fallen slightly by approx. 20-25% over the period 1989-1998.
The trend in organic matter inputs to the sea from point sources and sparsely built-up areas is illustrated in Figure 4.18. It can be seen that inputs from all sources have fallen since 1989. Inputs from wastewater treatment plants have fallen particularly much and now only comprise just over 10% of the total as compared with just under half at the beginning of the period. Despite a marked downward trend, inputs from separate industrial discharges are still the dominant direct point source of organic matter inputs to the sea.
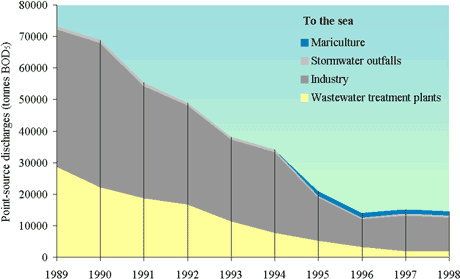
Figure 4.18
Trend in organic matter inputs to the sea from point sources and sparsely
built-up areas (adapted from Danish EPA, 1999b).
In the northern Belt Sea and the Little Belt, inputs from sea-based and land-based mariculture are the main sources of organic matter inputs (Danish EPA, 1999b).
4.4 Hazardous substances
Determination of discharges of hazardous substances is one of the new areas encompassed by NOVA-2003 as compared with the earlier monitoring programmes. Moreover, the measurements are made with a lower frequency and with less geographic coverage than the remainder of the programme. The data foundation in this area is therefore not yet of the same quality as for nutrients.
Monitoring of inputs of heavy metals to the aquatic environment under NOVA-2003 encompasses inputs from point sources including sparsely built-up areas, transport in watercourses and deposition from the atmosphere. As yet it is only possible to present data concerning point sources, sparsely built-up areas and atmospheric deposition.
As is apparent from their name, heavy metals are metals and hence elements. They are therefore naturally occurring in the environment in low concentrations. However, human activity has resulted in the dispersal of a number of heavy metals into the environment in concentrations known to cause harmful effects to man or the environment. As with all other elements, heavy metals are by definition nondegradable. Thus there is no such thing as "gone" when it comes to heavy metals. The removal processes that make nutrients disappear on route from the source to the aquatic environment are thus without effect as regards heavy metals. At best they can be delayed on route. Some of the hazardous substances are so persistent that the same also applies to them.
Discharges of hazardous substances have been examined in Chapter 3. The present section provides a short review of the various transport pathways and types of source.
Point sources
In addition to the sources encompassed by NOVA-2003, heavy metals are input to the aquatic environment from a number of other point sources. These include offshore activities and marine dumping of seabed material such as harbour sediments, etc. It is open to question whether marine dumping of seabed material comprises an actual source, or whether it is really just represents redistribution of material previously input to the aquatic environment. Moreover, from the available data it is very difficult to determine the total inputs of heavy metals from this source. As a consequence, inputs of heavy metals via marine dumping of seabed material are not included here.
The total inputs to the aquatic environment via wastewater treatment plants, separate industrial discharges and the offshore industry are included under point sources in Table 4.4. Sparsely built-up areas are given as an independent source. The figures for inputs from point sources and sparsely built-up areas have been determined in different ways and hence are not fully comparable.
Table 4.4
Heavy metals inputs to the aquatic environment from point sources, sparsely built-up
areas and the atmosphere in 1998 (data from Chapter 3 and Hovmand & Kemp, in prep.).
| Metal | Point sources |
Sparsely built-up areas |
Atmospheric deposition |
kg |
|||
| Arsenic (As) | 10,000 |
30 |
7,300 |
| Lead (Pb) | 3,300 |
200 |
45,000 |
| Cadmium (Cd) | 720 |
30 |
1,500 |
| Copper (Cu) | 10,300 |
1,000 |
33,000 |
| Chromium (Cr) | 2,600 |
200 |
5,300 |
| Mercury (Hg) | 590 |
20 |
- |
| Nickel (Ni) | 11,600 |
500 |
12,000 |
| Zinc (Zn) | 91,700 |
4,000 |
352,000 |
There is probably quite a lot of mercury accumulated in the sewerage systems that is slowly being discharged via the wastewater treatment plants despite the marked reduction there has been in mercury consumption.
Heavy metals are also input to the aquatic environment from a number of other diffuse sources. Wastewater treatment generates a large amount of sewage sludge in which a large part of the heavy metals content of the wastewater will be retained. The majority of the sludge is disposed of by being used as fertilizer on agricultural land, with the remainder being incinerated or deposited at a waste depository. The total amount of heavy metals in sewage sludge is given in Table 3.6. It is known that the heavy metals are strongly bound to the sludge and that very little release to the aquatic environment is likely. Nevertheless, it must be expected that some release will occur in the span of years. In connection with rust protection of harbour structures, bridges, ships, etc., large amounts of zinc are released that may contain traces of other metals such as cadmium. Heavy metals are also released from the antifouling paints used on ship hulls.
Deposition from the atmosphere
A large part of the total inputs of heavy metals to the aquatic environment derives from the atmosphere, cf. Section 3.4. Heavy metals inputs to Danish marine waters from this source (Table 4.4) have been determined on the basis of measurements of their concentrations in the air (Hovmand & Kemp, in preparation).
Transport in watercourses
In connection with the submission of data to OSPAR in 1990, measurements were made of heavy metals transport to the North Sea and the Skagerrak via a number of watercourses. It has subsequently been estimated that inputs to these marine areas via watercourses comprise 20% of total riverine loading. The total inputs of heavy metals to the sea via watercourses in 1990 estimated on this basis are given in Table 4.5.
Table 4.5
Heavy metals inputs to the marine environment via watercourses in 1990 (based on
OSPAR, 1998).
| Metal | kg |
| Lead (Pb) | 14,500 |
| Cadmium (Cd) | 1,950 |
| Copper (Cu) | 32,000 |
| Mercury (Hg) | 110 |
| Zinc (Zn) | 269,000 |
As the total inputs are estimated on the basis of measurements in just a few watercourses, the figures are subject to considerable uncertainty. Moreover, the analysis methods used were less sensitive than those in use today. The figures should therefore be interpreted as giving only a very rough picture of the general conditions at the end of the 1980s and beginning of the 1990s.
Inputs of heavy metals to Danish marine waters via watercourses in 1998 are not reported.
Hazardous substances
Due to analytical problems etc., the data foundation for calculating inputs of hazardous substances to the aquatic environment is far from adequate. It is anticipated that the first analysis of this area will be undertaken in connection with preparation of the theme report in 2002.
[Front page] [Contents] [Previous] [Next] [Top] |