[Front page] [Contents] [Previous] [Next] |
Aquatic Environment 1999
5. State of the aquatic environment - status and trends
The following sections review the environmental state of the groundwater (Section 5.1), watercourses (Section 5.2), lakes (Section 5.3) and the sea (Section 5.4) based on the activities conducted under NOVA-2003. As a consequence of the fact that the monitoring programme does not fully cover all areas, information has also been incorporated from other sources, for example data from county and state supervision activities.
5.1 Groundwater
Systematic monitoring of the Danish groundwater encompasses three main elements: 1) County monitoring in connection with NOVA-2003 (the GRUMO programme), 2) The agricultural catchment monitoring programme under NOVA-2003 (LOOP), and 3) Waterworks statutory routine control of abstraction wells, cf. Statutory Order No. 515 of 29 August 1988 on Water Quality and Supervision of Water Supply Plants (Ministry of the Environment, 1988) and associated official Danish EPA Guidelines.
The present overview of the state and overall trend in groundwater quality over the monitoring period is based on the 1998 nationwide scientific report on the combined systematic groundwater monitoring programme (GEUS, 1999).
Groundwater monitoring under NOVA-2003 is conducted in so-called groundwater monitoring areas (GRUMO areas) and in the six agricultural monitoring catchments (designated LOOP), where the focus is on newly formed subsurface groundwater. In the GRUMO programme, samples are collected from both the upper "secondary" aquifers (point-monitored filters) and in the deeper-lying "primary" aquifers (serial or volume-monitored filters), thereby enabling assessment of the quality of both young and old groundwater.
5.1.1 The year gone by
Main constituents of groundwater
The following section examines the 1998 results concerning the groundwater content of nitrate and phosphorus. The other main constituents (e.g. chloride and sulphate) have been examined in detail in the Theme Report on groundwater (GEUS, 1995). The situation regarding these substances has not changed significantly since then.
Nitrate
The results of the agricultural catchment monitoring show that the water that is on its way to the aquifers in sandy areas contains high concentrations of nitrate. The average concentration measured in the filters is around 50 mg per litre. This corresponds to the limit value in drinking water. In clayey areas, the nitrate concentration in the newly formed groundwater averaged 25 mg per litre.
Deeper down in the ground one finds groundwater aquifers with an unconfined water table, which is the type of aquifer that is most vulnerable with respect to nitrate leaching. In 1998, the nitrate concentration in this type of groundwater aquifer – which is widespread in western Jutland – averaged approx. 50 mg per litre in those filters in which nitrate was detected. In general, the nitrate concentration decreases with increasing age of the water. In all, approx. 60% of the filters encompassed by the groundwater monitoring programme are nitrate-free.
The results of the waterworks routine control of abstraction wells show that approx. 3% of the abstracted water exceeds the limit value for nitrate in drinking water, while approx. 6% exceeds the guide level of 25 mg per litre. Two thirds of the wells do not contain nitrate, however. The findings demonstrate clear regional differences in nitrate contamination of the drinking water. The highest levels are found in the so-called nitrate belt across Jutland (Nordjylland, Viborg and Aarhus counties), cf. Figure 5.1. Nitrate comprises a serious problem for the water supply, especially in the western part of the country where there is intensive livestock production and little or no clay cover bed over the groundwater aquifers, and hence considerable vulnerability to nitrate leaching.
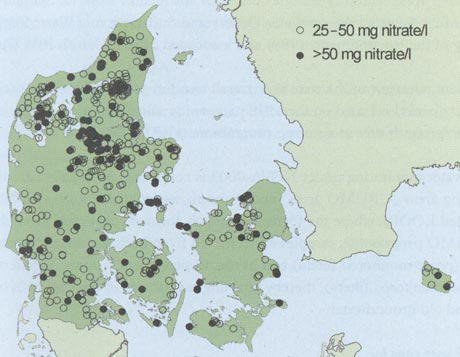
Figure 5.1
Nitrate concentrations in waterworks abstraction wells for the period 1990-98. Only wells where the nitrate concentration exceeds 25
mg per litre are included (adapted from GEUS, 1999).
Phosphorus
The phosphorus concentration in the newly formed groundwater measured in the agricultural monitoring catchments was unchanged and low in 1998, although with slightly higher levels in the sandy areas. Under the groundwater monitoring programme, phosphorus was detected in concentrations exceeding the limit value for drinking water of 0.15 mg per litre in 14% of the filters in 1998. Control of the water supply abstraction wells revealed that around 20% exceed this limit. As the majority of the phosphorus is removed from the water during routine treatment it does not generally comprise a problem for the drinking water supply. The enhanced phosphorus concentration in the groundwater is often attributable to the geological conditions.
Age of the groundwater
Dating of the groundwater from some of the wells encompassed by the monitoring programme was undertaken in 1997–98. This revealed:
| that no more than 10% of the water analysed under the groundwater monitoring programme was formed after the adoption of the Action Plan on the Aquatic Environment in 1987, | |
| that the majority of the groundwater that is monitored was formed between 1940 and 1990, | |
| that in Copenhagen, Vestsjćlland and Funen counties, a large part of the groundwater was formed prior to 1970, | |
| that in Ribe and Nordjylland counties, a large part of the groundwater was formed after 1980, and | |
| that 10% of the water investigated was formed before 1940. |
Heavy metals and inorganic trace elements
The heavy metals and trace elements encompassed by the monitoring programme include aluminium, arsenic, barium, lead, cadmium, copper, nickel, selenium and zinc. The monitoring results for the upper groundwater in the agricultural monitoring catchments in 1998 indicate that heavy metals and inorganic trace elements are retained and accumulated in the root zone.
Under the groundwater monitoring programme, one or more heavy metals or inorganic trace elements were found at one time or another in all the filters investigated during the period 1993-98. In more than 30% of the analyses for the trace element barium, the concentration detected exceeded the guide level for drinking water of 100 microgrammes per litre. Barium is naturally occurring but its presence can also be due to local pollution around the well, possibly in conjunction with the establishment of the well. Thereafter follow aluminium, nickel and zinc, where the concentration in the groundwater exceeds the limit values for drinking water of 0.2 mg/l, 50 mg/l and 5 mg/l, respectively, in 8%, 4% and 4% of the analyses.
Of the above-mentioned substances, only nickel and aluminium were encompassed by the majority of the analyses conducted under the waterworks routine well control, cf. the requirements stipulated in the Statutory Order on Water Quality and Supervision of Water Supply Plants. Up to 1998, though, heavy metals and/or inorganic trace elements had been detected in 40% of the abstraction wells investigated. The concentration exceeds the limit value for drinking water in approx. 4% of the wells - in the majority of cases due to nickel contamination. Enhanced nickel concentrations are often seen in cases where water abstraction has lowered the groundwater table. Other substances, for example zinc, aluminium and arsenic, are also occasionally found in waterworks wells in concentrations exceeding the limit value for drinking water. Common for this group of substances, though, is the fact that they are largely removed from the water during ordinary simple treatment at the waterworks.
Organic micropollutants
The organic micropollutants can be subdivided into chlorinated hydrocarbons, aromatic hydrocarbons, phenols and chlorophenols, detergents, and miscellaneous organic micropollutants.
The chlorinated hydrocarbons chiefly derive from industry, where they are used as solvents and degreasing agents etc., as well as coolants. Thus they are mainly present in the groundwater in connection with waste depositories and contaminated sites. Under the groundwater monitoring programme in 1998, one or more chlorinated hydrocarbons were detected in 29% of the wells analysed. The substances most frequently detected were chloroform, 1,1,1-trichloroethane and trichloroethylene. Chloroform can be formed naturally, for example under coniferous forest, while the other substances derive from human activities. The chlorinated hydrocarbons most frequently detected in waterworks wells are vinyl chloride and trichloroethylene: Over the period 1987-98, these were detected in 15% and 13% of the wells, respectively.
Aromatic hydrocarbons are mainly oil products such as petrol. During the period 1989-98, aromatic hydrocarbons were detected in 24% of the well filters in the groundwater monitoring areas. Those most frequently detected were the petrol constituents benzene and toluene. The median concentration of these two substances in groundwater is approx. 0.1 microgramme per litre as compared with the limit value for drinking water of 1 microgramme per litre. Of the waterworks wells investigated during the same period, aromatic hydrocarbons were detected in 14%. The substances are present in the waterworks wells at approximately the same frequency - and in the same concentrations - as in the groundwater monitoring wells.
Phenols and chlorophenols were detected in approx. 25% of the groundwater monitoring wells at low concentrations near the detection limit, while they were found in 6% of the waterworks wells - likewise at concentrations that generally lie well below the limit values for drinking water (0.5 microgrammes per litre for phenols and 1 microgramme per litre for chlorophenols). A possible source of the chlorinated phenols is the degradation of natural organic matter (e.g. livestock manure), while the phenols can stem from pesticides. The chlorinated phenol pentachlorophenol, which is used in the impregnation of wood, is detected in approx. 1% of the wells. Nonylphenols, which are found in cleaning agents, cosmetics, paints and plastics, are discussed below in connection with the hormone-like substances. The few available analysis results indicate that the nonylphenols are present at a high frequency and in relatively high concentrations. Attempts will be made to confirm these findings in the future groundwater monitoring work.
Detergents can also be naturally occurring, but probably mainly stem from washing powders and cleaning agents. In addition, detergents are used in pesticide products. Detergents are widely detected - also in the deeper groundwater. Under the groundwater monitoring programme, detergents were detected in 87% of the wells analysed during the period 1989-97. In 1998, detergents were detected in just over half of the waterworks wells at a median concentration of 6 microgrammes per litre, i.e. well below the limit value for drinking water of 100 microgrammes per litre. The limit value for detergents is based not on possible health effects, but on their foaming properties.
As regards the miscellaneous organic micropollutants, plasticizers were detected in 39% of the groundwater monitoring wells analysed. Of the only 37 waterworks wells investigated for plasticizers in 1998, 9% proved positive. No limit value has been set for plasticizers in drinking water. With respect to the percentages given here it should be noted that the analysis methods for plasticizers are subject to relatively great uncertainty and that false "positives" can occur due to contamination from plastic tubing during sample collection if the tubing contains plasticizers.
The petrol additive MTBE has not been detected in any of the 12 groundwater monitoring wells investigated in 1998. Of the waterworks wells investigated, MTBE was detected in approx. 10% in an average concentration of 0.33 microgrammes per litre (the preliminary limit level for drinking water announced in connection with the MTBE Action Plan is 30 microgrammes per litre).
All in all, organic micropollutants have been detected in 94% of the filters investigated up to 1998. Under the waterworks routine well control, micropollutants were detected in 29% of the filters investigated in 1998. In general, the concentrations of organic micropollutants are greatest in the uppermost part of the groundwater aquifers. Aromatic hydrocarbons and phenols also occur in the deeper-lying parts of the aquifers, however.
Pesticides and pesticide residues
Although pesticides is a generic term for herbicides, fungicides and insecticides, in the groundwater context the term pesticides is generally used synonymously with herbicides. Thus no other pesticides than herbicides have been detected in groundwater in concentrations exceeding the limit value for drinking water.
As regards the pesticide content of the upper groundwater, the agricultural catchment monitoring revealed pesticides and/or pesticide residues in 40% of the filters investigated. Those detected in the upper groundwater are mainly of the atrazine family and their degradation products. The detection percentage is comparable with that for the subsurface groundwater in the groundwater monitoring areas.
Under the groundwater monitoring programme, pesticides were detected in 29% of the wells in 1998, with the concentrations exceeding the limit value for drinking water (0.1 microgramme per litre) in 8% of the wells. The detection frequency decreases almost linearly with depth, cf. Figure 5.2. The high detection frequency in the upper groundwater is largely attributable to the presence of BAM, a degradation product of dichlobenil and chlorothiamide. The pesticides most frequently detected are atrazine, dichlorprop and mecoprop.
Figure 5.2
Pesticide detection frequency (total and above limit value) in groundwater at
different depths (adapted from GEUS, 1999).
In step with the phase-out of pesticides able to leach into the groundwater, consumption of the product Round-up has increased. The active substance glyphosat and the degradation product AMPA were detected in a couple of low wells on agricultural land in 1998. The substances might occur as a result of very localized contamination around the well, though, either as a result of the so-called chimney effect, whereby the substances seep down to the sampling filters along the well wall, or as a result of contamination with water that has run into the well from above. Attempts will be made to confirm these findings in the future groundwater monitoring work.
Routine control of waterworks wells in 1998 revealed pesticides in 32% of the wells - with the concentration exceeding the limit value for drinking water in 12% of the waterworks wells. BAM is the substance most frequently detected, followed by the atrazine family of pesticides and their residues, cf. Figure 5.3. The pesticides found in the greatest concentrations in drinking water are thus substances (or their residues) whose use is already prohibited.
Figure 5.3
Pesticides detected in waterworks wells during the period 1989-98 in concentrations exceeding the limit value for drinking water
(adapted from GEUS, 1999).
Groundwater potential
The groundwater table was generally low in 1998 due to the dry winters of 1996/97 and 1997/98. The wet autumn in 1998 has recharged the groundwater table to a more normal level, however.
Groundwater abstraction
In 1998, groundwater abstraction totalled 741 million m3. Of this, approx. 60% was abstracted by common waterworks (primarily for household use), approx. 30% by commercial users (irrigation) and approx. 10% by industry.
Closure of contaminated wells
Notifications from the municipal authorities show that 28 abstraction wells were closed down in 1998 as a result of anthropogenic pollution with pesticides, other hazardous substances or nitrate. Pesticides are currently by far the most frequent cause of contamination-related closure of abstraction wells, accounting for 25 (89%) of the closures. Of the remaining three wells, two were closed down because of contamination with other hazardous substances while one was closed down because of nitrate contamination.
Groundwater modelling
For the second year in a row, the 1998 monitoring reports contain a description of the groundwater models established by the county authorities. The models are used by them in connection with assessments of the size of the groundwater resource, remedial measures against groundwater contamination, etc. The groundwater models for each area contain information on geological conditions such as the number of geological layers, etc. For each geological layer, figures are given describing its water conductance. The groundwater models also contain information on the hydrological conditions such as precipitation, watercourses and lakes. The model established for each area can be fed into a computer programme and used to predict how groundwater flow and the groundwater table will change in response to various measures, for example the abstraction of groundwater in a specific part of the model area.
5.1.2 Trend over the period 1989-98
Nitrate
The variation in the nitrate content of the upper groundwater is primarily a function of the variations in precipitation and harvest yield. Thus no clear trend can be seen in the data from the agricultural monitoring catchments (LOOP) over the monitoring period and hence it is not possible to identify any effect of the reduced nitrogen losses from agricultural sources on the newly formed groundwater. The average nitrate concentration in the approx. 40% of the well filters in which nitrate has been detected is shown in Figure 5.4.
Figure 5.4
Trend in groundwater nitrate concentration in filters with more than 1 mg/l in
the groundwater monitoring areas (GRUMO) and agricultural monitoring catchments (LOOP) in
sandy and clayey areas (adapted from GEUS, 1999).
Neither can a clear trend be identified in the deeper-lying groundwater (GRUMO), although a slight increase in nitrate concentration can be seen in the unconfined aquifers of the sandy areas.
The groundwater dating studies reveal that only a minor part of the groundwater analysed for nitrate stems from after implementation of the Action Plan on the Aquatic Environment. Thus one cannot yet expect to see an effect of the Action Plan measures on groundwater quality.
The nitrate concentration in the water supply wells has remained roughly stable during the period 1990-98. The distribution according to nitrate concentration is shown in Table 5.1.
Table 5.1
Water supply abstraction wells apportioned by nitrate content.
| Conc. mg/l |
No. |
% |
| >50 | 251 |
2.9 |
| 25–50 | 544 |
6.3 |
| 1–25 | 2,134 |
24.7 |
| <1 | 5,711 |
66.1 |
| Total | 8,640 |
100.0 |
Phosphorus
The presence of phosphorus in groundwater is primarily determined by the geological conditions. Thus the groundwater monitoring programme cannot be expected to reveal marked changes. In accordance with this, the phosphorus concentration appears to have remained stable during the period 1990-98.
Organic micropollutants
The trend over the monitoring period 1989-98 for a couple of the substances examined in Section 5.1.1 is outlined below.
The average concentration of the chlorinated hydrocarbons detected in the highest concentrations in the groundwater monitoring wells is about half of the limit level for drinking water. The same is true for the substances most frequently detected in the waterworks wells. Vinyl chloride has been detected in 40 (15%) out of the 268 wells investigated. The concentration of vinyl chloride in the waterworks wells investigated during the period has increased to an average of 0.6 microgrammes per litre. Vinyl chloride is a stable degradation product of the other chlorinated hydrocarbons and it is therefore not surprising that some accumulation of it has taken place in the groundwater.
As regards detergents in drinking water, these have been detected in between 50% and 60% of waterworks wells since 1993 with no evidence of any clear trend over the period.
Pesticides and pesticide residues
The groundwater monitoring programme previously encompassed 8 pesticides. Since 1998 under NOVA-2003 it has encompassed approx. 50 pesticides and pesticide residues.
In the agricultural catchment monitoring programme, pesticides and/or pesticide residues have been detected in 46% of the filters over the period 1990-99, with the concentration exceeding the limit value for drinking water in 10% of the filters. It is particularly pesticides of the atrazine family that are detected in high concentrations. The concentration has fallen during the period, which is as would be expected since the sale of atrazine ceased in 1994.
In the groundwater monitoring programme, pesticides and/or pesticide residues have been detected in 30% of the filters over the period 1989-98, with the concentration exceeding the limit value for drinking water in 10% of the filters.
The detection frequency fell slightly from 1990 to 1992, cf. Figure 5.5. This is mainly attributable to the fact that the county authorities previously collected the samples from high-lying filters. The increase between 1994 and 1998 is due to the fact that since the detection of atrazine at Ejstrupholm, the counties now analyse for a far greater number of substances. Finally, the increase is also attributable to BAM.
Routine control at the waterworks revealed pesticides and/or pesticide residues in an average of 23% of the wells over the period 1989-98, with the concentration exceeding the limit value for drinking water in 9% of the filters.
Figure 5.5
Number and percentage of groundwater monitoring wells containing pesticides
(adapted from GEUS, 1999).
Groundwater potential
The variation in the groundwater table over the period 1989-98 is illustrated in Figure 2.5. As a result of the dry winters of 1996/96 and 1997/98, the groundwater table at the end of the monitoring period was the lowest in 20 years.
Water abstraction
Total groundwater abstraction in 1998 amounted to approx. 741 million m3. Since 1989, total abstraction has decreased by approx. 30%, cf. Figure 5.6.
Figure 5.6
Trend in groundwater abstraction apportioned by category over the period 1989-98 (adapted from GEUS,1999).
The fall in abstraction by the public waterworks over the period is attributable to water economy measures and levies on water. The marked variation in water abstraction for irrigation reflects the variation in precipitation since this category also encompasses the sprinkling of agricultural crops.
Closure of contaminated wells
Notifications from the municipal authorities show that 478 abstraction wells were closed down over the period 1987-98 as a result of anthropogenic pollution. Pesticides are the most frequent cause of contamination-related closure of abstraction wells, accounting for 47% of the closures. The corresponding figures for other hazardous substances and nitrate are 22% and 31%, respectively. Some clear trends are apparent regarding the type of substance that contaminates the water supply:
| The number of wells closed down because of contamination with pesticides and/or pesticide residues has increased markedly since 1993 when the waterworks seriously started to analyse for pesticides. | |
| The number of wells closed down as a result of contamination with nitrate and other hazardous substances has remained roughly constant during the period. |
Groundwater modelling
The use of groundwater models has increased markedly during the period 1989-98 in line with enhanced legislative requirements as to county planning and management of the groundwater resource, among other things the Danish EPA's forthcoming zoning guidelines. Moreover, the trend within information technology, which has enabled groundwater models to be used on ordinary computers, has made it more common to use groundwater models as a tool in routine administration of groundwater resources.
5.2 Watercourses and springbrooks
The majority of the monitoring and supervision of the Danish watercourses and springbrooks is undertaken by the county authorities.
The selection of stations in the former monitoring period (1989-97) was primarily based on the need to calculate nutrient loading of lakes and marine waters. In general, therefore, most of the watercourses included in the station network were large or medium-sized. The majority of the approx. 64,000 km of watercourse in Denmark are small watercourses less than 2.5 metres wide, cf. Table 5.2. The small watercourses were thus clearly underrepresented in the station network relative to their total length. This imbalance has now been redressed in the revised station network for assessment of biological watercourse quality. Thus the stations for the monitoring period 1998-2003 have been selected so as to be more representative of the Danish watercourses as a whole, both with respect to watercourse size and general environmental state.
Table 5.2
Estimated length of Danish watercourses (Windolf et al., 1997).
| Watercourse width | Length |
| 0–2.5 m | 48,000 |
| 2.5–8.0 m | 14,500 |
| >8.0 m | 1,500 |
| Total | 64,000 |
NOVA-2003 also encompasses water chemistry monitoring stations and springbrook stations carried forward from the previous programme period with minor adjustments. A completely new element of the programme is the monitoring of hazardous substances. A further new element is the establishment of an extended biology programme to elucidate the relationship between the biological state of the watercourses and various pressures.
The results are reported both independently by the county authorities and in the form of nationwide scientific reports based on the results of the county and state monitoring. The following description of the current environmental state of Danish watercourses and the overall trends is based on the report "Watercourses and springs" (Břgestrand et al., 1999), supplemented by information from the county regional supervision of watercourses (Danish EPA & National Forest and Nature Agency, in preparation).
5.2.1 The year gone by
Springbrooks
NOVA-2003 encompasses the monitoring of 58 springbrooks for various selected water chemistry variables in order to follow the quality of and overall trend in the groundwater that naturally flows into the watercourses.
Phosphorus and nitrogen in springbrooks in 1998
No significant changes were observed in the phosphorus concentration in the springbrooks in 1998 relative to preceding years. Thus the total phosphorus concentration in 1998 was 0.074 mg P per litre in springs in cultivated catchments and 0.054 mg P per litre in springs in uncultivated rural catchments. The corresponding values for 1997 were 0.073 mg P per litre and 0.048 mg P per litre, respectively.
As in the preceding years, an increase in the nitrate concentration of spring water was observed in cultivated catchments. Thus the nitrate concentration increased from 6.21 mg N per litre in 1997 to 6.83 mg N per litre in 1998. No such increase was detected in springs located in uncultivated rural catchments.
Nitrogen in watercourses
The 1998 results show that as was the case in the preceding years, the concentration of total nitrogen was highest in watercourses draining cultivated catchments. Thereafter follow the watercourses in catchments with point-source discharges, watercourses affected by wastewater from freshwater fish farms and finally, watercourses in uncultivated rural catchments.
1998 was characterized by a high level of runoff and hence a relatively high level of nitrogen leaching. Area-specific nitrogen runoff was greatest in the watercourses in cultivated catchments. Because of the high level of runoff in 1998, nitrogen loading from fish farms in some of the watercourses traditionally considered to be "fish farm watercourses" was 30% less than in the low-precipitation years 1996 and 1997.
Phosphorus in watercourses
As in the preceding years, the concentration of total-P in watercourses was highest in catchments with point-source discharges, followed by watercourses in the cultivated catchments, after which follow watercourses with wastewater discharges from fish farms, with the lowest concentrations in watercourses in uncultivated rural catchments.
Agriculture was the chief source of phosphorus transport in both the cultivated catchments and the catchments with point-source discharges. Discharges from sparsely built-up areas also accounted for a considerable part of the phosphorus transport in watercourses in cultivated catchments. In watercourses in catchments with point-source discharges, wastewater discharges comprised the second-largest share of the phosphorus transport.
Organic matter in watercourses
The organic matter concentration in watercourses in 1998 was highest in watercourses affected by wastewater discharges and in "fish farm watercourses", and least in watercourses in uncultivated rural catchments. There is a significant difference in the organic matter content of watercourses located east and west of the Great Belt, with the organic matter content being highest east of the Great Belt. The difference is not sufficient to explain the marked difference in watercourse environmental quality between the two regions of Denmark, however.
Hazardous substances
Because of methodological problems with the analyses, monitoring of hazardous substances will not be initiated until the year 2000. Similarly, very little data is available concerning heavy metals.
Physical conditions and watercourse maintenance
The objects clause of the Watercourse Act stipulates that it is permissible to use watercourses for drainage of water, but that this must be done in deference to stipulations concerning watercourse environmental quality laid down in other legislation (Ministry of Environment, 1992). The drainage capacity of watercourses can be improved, for example by channelization and weed clearance. Weed clearance practice can be classified as "no weed clearance", "gentle weed clearance", where a minor part of the watercourse vegetation is cleared and "hard-handed weed clearance", where all the watercourse vegetation is cleared. The weed clearance method influences watercourse physical variation. In watercourses that are not maintained or are maintained gently, hard substrates such as stones and gravel comprise a larger part of the stream bed.
NOVA-2003 shows that hard-handed maintenance is chiefly employed in watercourses where the adjoining land is cultivated. The land alongside watercourses where no or gentle weed clearance is employed encompasses both intensively cultivated, extensively cultivated and uncultivated land. Of the watercourses encompassed by the monitoring programme, the majority of the affected watercourses are cleared of weeds 1-2 times yearly (56%), while 11% are cleared more than twice yearly. The majority of the affected watercourses are cleared using scythes (64%), while a relatively large percentage are cleared using mechanical weed cutters (36%).
Another important element as regards watercourse physical quality is obstructions such as falls in connection with road underpasses etc,. and dams in connection with fish farms.
Extensive biological monitoring programme
A total of 444 watercourse stations were included in the extensive biological monitoring programme in 1998. The results show that the dominant state in Danish watercourses is fauna class 4. This corresponds to a moderately effected fauna, where the majority of the more demanding macroinvertebrates are either absent or only present in very small numbers. The watercourses at 43% of the stations are rated as fauna class 4. At 37% of the stations the watercourses are either unaffected or only slightly affected (fauna classes 5, 6 and 7). At the remaining 20% of the stations the watercourses are markedly or severely affected (fauna classes 1, 2 and 3).
Subdividing the watercourses into 5 size classes based on watercourse width reveals that fauna class 4 is the most frequent state in all 5 classes. There is nevertheless a clear tendency for the large watercourses (more than 5 m wide) to have a better general state than the small watercourses (less than 2 m wide). Fauna classes 1, 2 and 3 (severely affected) are found at 25% of the stations in small watercourses as opposed to only 7.5% of the stations in large watercourses.
The state of the watercourses in 1998 is significantly better in Jutland and on Funen than in the remainder of the country. Thus the state of the watercourse is good or very good (fauna classes 5, 6 and 7) at 44% of the stations in Jutland and on Funen and bad or very bad at 14%. The corresponding figures for the remainder of the country (Zealand, Lolland and Falster) are 12% and 42%.
Extended biological monitoring programme
The programme encompasses a total of 80 watercourse stations nationwide, all of which are located in small watercourses in rural areas. 15 of the watercourse stations are reference stations characterized by being unaffected as regards physical variation, fauna and/or flora. Land use at the stations is usually extensive (meadows, reed swamps). Cultivated land is far more frequent along the affected watercourses, which are also far more frequently channelized. Watercourses with undercut banks are present in both watercourse types, just as there is no significant difference in the nature of the bed substrate. The water temperature is higher in the affected watercourses.
The monitoring results reveal that there are significant differences in the plant, macroinvertebrate and fish communities in the two types of watercourse. Weed clearance thus has a considerable influence on plant distribution in the watercourses. The percentage of bed substrate comprised of sediment is of great significance as regards plant distribution, while the percentage of fine gravel is of less significance. The impact of the method and frequency of weed clearance and the implements used on the current velocity and bed substrate affect the competitiveness of the various plant species, thereby changing the plant communities. The total number of plant species, the species composition and the percentage of watercourses where one plant species comprises more than 50% of the total plant cover shows that watercourses subject to hard-handed or partly gentle maintenance are impoverished relative to watercourses in which weed clearance is not undertaken.
The number of macroinvertebrates is lower in the affected watercourses than in the reference watercourses. The Danish Stream Fauna Index for spring and summer is 4 (moderately affected fauna) in the affected watercourses while it is 6 and 5 (mildly affected fauna), respectively, in the reference watercourses. In the late summer, the mocroinvertebrate communities are also more diverse in the reference watercourses.
There is no significant difference in the number of fish species in the two types of watercourse. Trout make more specific demands on watercourse quality than for example pike, eel and 3-spined and 9-spined sticklebacks. There is a tendency for the number of trout to be greater in the reference watercourses than in the affected watercourses, but the difference is not statistically significant. This tendency is enhanced if only watercourses in which trout stocking is not undertaken are included.
Quality objective compliance
According to the county regional supervision reports, only 44% of the watercourses complied with their quality objectives as stipulated in the county Regional Plans (Danish EPA & National Forest and Nature Agency, in preparation).
5.2.2 Trend in watercourse environmental state
Springbrooks
During the period 1989-98, the nitrate concentration in springs in cultivated catchments has been 10-fold higher than in springs in uncultivated rural catchments. Moreover, the nitrate concentration in springs in cultivated catchments has been increasing since 1994. In contrast, there has been no evidence of any changes in phosphorus and nitrogen concentrations in springs in uncultivated rural catchments.
Nitrogen in watercourses
The pattern of watercourse nitrogen transport since 1989 has largely followed that of runoff, high levels of runoff thus being accompanied by high nitrogen transport. The great variation in runoff in recent years therefore makes it difficult to draw any general conclusions as to the overall trend and hence to assess the effect of the environmental measures implemented.
When taking the variation in water flow into account, the calculations show that the nitrogen concentration has fallen 9% in the majority of the watercourses over the period 1989-99. The fall is statistically significant at 35 out of 116 stations at which a fall in concentration was detected. The variation is considerable, however. In sandy soil areas, there is a weak tendency towards an increase in watercourse nitrogen concentration.
Phosphorus in watercourses
The pattern of phosphorus transport in watercourses in uncultivated rural catchments without point-source loading since 1989 has generally followed the variation in runoff. Thus water flow and phosphorus transport were higher in 1998 than in the dry years 1996 and 1997. The flow-weighted phosphorus concentrations, which are less affected by runoff, do not reveal any general trend in watercourses in uncultivated rural catchments. In watercourses in cultivated catchments, in contrast, the flow-weighted concentrations have fallen from a level of 0.13-0.15 mg P per litre in 1989-91 to 0.11-0.13 mg P per litre in 1994-98.
Phosphorus discharges to watercourses in catchments with wastewater discharges from point sources and freshwater fish farms have fallen markedly due to a fall in phosphorus discharges from wastewater treatment plants and fish farms.
Organic matter in watercourses
As long time series of organic matter data are only available for a small number of stations, no analysis has been made of the general trend.
One of the chief sources of organic matter in several watercourses in Jutland is freshwater fish farms, discharges from which have often been the cause of an unacceptable environmental state in watercourse reaches affected by fish farms.
Since 1989, organic matter discharges from freshwater fish farms have been reduced considerably from more than 6,000 tonnes in 1989 to 3,500 tonnes in 1998. The measurements of organic matter in watercourses made under NOVA-2003 – especially in the catchments where the wastewater from freshwater fish farms accounts for a considerable part of the point-source load – documents the reduction in discharges of organic matter from fish farms.
Hazardous substances
As mentioned above, the basis for assessing the occurrence and transport of hazardous substances in watercourses is presently too inadequate to enable such assessment of these factors.
Over the period 1994-97, Funen County conducted screening for the occurrence of pesticides in selected watercourses, springs and drains (Funen County, 1999a). The investigations encompassed 237 water samples analysed for 99 different substances and 6 stream bed sediment samples analysed for 22 different substances. The pesticides analysed for are currently or previously used by farmers, public institutions and the general public. The background for the pesticide investigation by Funen County was that the County's routine studies of stream macroinvertebrates in the early 1990s revealed a disquieting increase in the number of watercourses that were acutely affected by toxic discharges. Crustaceans and aquatic insects had been killed in large numbers.
The investigation revealed 33 pesticides in watercourses and 21 pesticides in drainage water, comprising 27 herbicides, 2 fungicides and 4 insecticides. Of the 33 different pesticides, 26 are currently approved for use in Denmark. The most frequently detected mother substances were isoproturon and glyphosat. Both substances are approved and are the most used pesticides in Denmark. On the basis of the investigation, Funen County concluded that it is highly probable that a major part of the pesticides in the watercourses are input in drainage water, especially in the spraying season. Pesticide input to the watercourses via wind drift seems to be of little significance for the occurrence of pesticides in the water.
The analyses of stream bed sediment from Lillebćk stream and the river Odense in 1997 revealed the presence of 5 and 4, respectively, out of the 22 pesticides investigated, cf. Table 5.3. The substances detected comprise four insecticides and one fungicide. DDE is a degradation product of DDT, which is extremely toxic, and which was banned in Denmark back in 1984. Thirteen years after the ban entered into force, its degradation product is still detectable in both the river Odense and Lillebćk stream. The sediment investigated is the loose subsurface fraction that is transported downstream to lakes or coastal waters during periods of high stream flow. The sediment deposits on the stream bed during periods of low stream flow, typically in the summer, and resuspends in the water phase when stream flow increases in the autumn.
Table 5.3
Maximum concentrations of pesticides detected in watercourse sediment (Funen County,
1999a). DM: Dry matter.
| Pesticide | mg/g DM |
| a-cypermethrin | 0.003 |
| DDE | 0.020 |
| Esfenvalerat | 0.003 |
| Permethrin | 0.030 |
| Vinclozolin | 0.002 |
In the Funen County investigation, it was concluded that if the pesticide contamination had not occurred, the number of watercourses with a satisfactory environmental state would have been 10% greater.
Aarhus County also undertook a similar investigation in 1997, collecting 26 water samples for pesticide analysis from 3 watercourses and 4 springs in agricultural catchments (Aarhus County, 1999a). The substances most frequently detected in the investigation are typically substances that are commonly detected in other pesticide studies.
Watercourse maintenance
The method and frequency of weed clearance and the implements used are of great significance for the watercourse plant communities. In 67% of the watercourses encompassed by the monitoring programme, the weeds are cleared at least once yearly. The weed clearance pattern is the same for the large Danish watercourses.
Former weed clearance practices affect the plant communities for a long time. Thus it can take many years for the plant communities to re-establish once weed clearance is stopped.
Extensive biological monitoring programme
When comparing the fauna class data for 1998 with the data for the monitoring period 1993-97, it is necessary to take into account that the small, affected watercourses were previously underrepresented. On the basis of the recalculated data and county regional watercourse supervision data for the period 1993-96 it is estimated that the state of the watercourses during that period is in relatively good agreement with the state determined in 1998 using the Danish Stream Fauna Index, where fauna class 4 dominates (moderately affected fauna).
Based on data from the national monitoring stations it has previously been concluded that watercourse environmental state was generally better in Jutland and on Funen than in the remainder of the country. The county regional watercourse supervision data for the period 1993-96 leads to the same conclusion.
The BOD5 content of the watercourses in eastern Denmark was found to be slightly but significantly greater than in western Denmark. The difference in BOD5 cannot explain the marked difference in environmental quality between the two regions, however. It must further be concluded that stream bed conditions do not differ and hence cannot explain the difference in environmental state either.
Extended biological monitoring programme
The extended biological monitoring programme is undertaken a total of three times during the monitoring period 1998-2003 - in the years 1998, 2000 and 2003 – thereby enabling watercourse biological state to be followed for a 6-year period. The first two reports will focus on describing and characterizing the factors of significance for the various groups of watercourse organisms and the interactions between the animal and plant communities. The final report will focus on the overall trend in the biological communities.
Quality objective compliance
At the national level, the watercourse quality objectives were met at 39% of the monitoring stations in 1996 as compared with 43% in 1997 and 44% in 1998. The increase is not necessarily an expression of an improvement in state, but could be due to the fact that different stations were investigated in the three years (Danish EPA, 1999f).
5.3 Lakes
In Denmark, there are around 120,000 lakes greater than 0.01 hectare (100 m2), the majority of which are ponds and small lakes. Only 2,762 of the lakes are larger than 1 hectare (10,000 m2). The total lake area is approx. 58,000 hectares, which corresponds to around 1.4% of the Danish landmass.
NOVA-2003 encompasses a total of 31 lakes, of which 4 are brackish. The lakes span from completely pure clearwater lakes to lakes that are strongly polluted. The environmental state of these lakes is estimated on the basis of chemical, physical and biological measurements on the lake water and measurements of nutrient inputs and outputs.
The following description of the environmental state of Danish lakes and the overall trend is primarily based on the report "Lakes 1998" (Jensen et al., 1999). As the investigations in the 31 lakes are inadequate to provide a general and representative description of the current state and overall trend in the environmental quality of Danish lakes, the description is supplemented with information from county regional supervision of lakes (Danish EPA & National Forest and Nature Agency, in preparation).
5.3.1 The year gone by
The environmental state of the 31 monitoring programme lakes is investigated each year and the overall trend assessed. No results are available for one of the four brackish lakes in 1998, however, as sample collection was not initiated until 1999. Data from the other three brackish lakes are included for the first time. Time series for use in an assessment of the overall trend in environmental state are thus only available for the remaining 27 lakes.
Water balance
It has been possible to establish reasonably accurate water and nutrient balances that include exchange with the groundwater for 16 of the 31 lakes. 1998 was a wet year, cf. Figure 2.4, and water input to the lakes was greater than normal. The residence time in lakes was thus shorter than normal, though not as short as in the hitherto wettest year of the monitoring period, namely 1994.
Phosphorus and phosphorus balance
Phosphorus retention increases with increasing residence time in the lakes. In 1998, retention was greater than 12% in half of the lakes. The phosphorus balance was negative in a number of the lakes, however, i.e. phosphorus output exceeded phosphorus input due to phosphorus release from the lake sediment after external loading has been reduced.
Nitrogen and nitrogen balance
Nitrogen retention in the 16 lakes also increases with increasing residence time. In addition, nitrogen retention has increased in some of the monitoring programme lakes after the restoration of a clearwater state following changes in the fish stock. Nitrogen retention exceeded 29% in half of the lakes in 1998.
Secchi depth and chlorophyll A
In the majority of the lakes in which the Secchi depth or chlorophyll a concentration have changed significantly, the change has involved an increase in Secchi depth and a decrease in the chlorophyll a concentration. The annual mean Secchi depth has thus increased in 12 lakes and only decreased in one. Correspondingly, chlorophyll a concentration has decreased in 11 lakes and only increased in 2. Similar changes were also seen in the summer levels. Summer mean Secchi depth has increased in 11 lakes and the summer mean chlorophyll a concentration has decreased in 8 lakes.
Phytoplankton
Phytoplankton biomass has fallen significantly in 6 of the 27 freshwater lakes and increased in 2 lakes. The changes are mainly seen in the bluegreen algae and green algae, as well as in diatoms and dinoflagellates. The composition of the phytoplankton community has also changed in many lakes, among other things the percentage of bluegreen algae having increased in 3 lakes and fallen in 6.
Zooplankton
For the zooplankton community as a whole, no significant changes in biomass have occurred during the 10-year monitoring period. Changes have taken place in a few lakes, however, with total biomass having decreased in 4 lakes and increased in 5.
Submerged macrophytes
Relative to the preceding years, there were very few general changes in submerged macropyhyte distribution and composition, although there was a tendency towards increased distribution in the investigated lakes.
Fish fry surveys
Fish fry surveys in the monitoring programme lakes are a new element of the monitoring programme. The surveys have provided a good impression of the number and composition of the fish fry, just as their impact on the zooplankton can be described.
The most abundant species are roach and perch, but bream and ruffe are also frequently found in the surveys. The density of fish fry is very variable, both between lakes and within the individual lakes. Average density was highest for roach by the banks (3.7 per m3) and in the open water (1.3 per m3), with the corresponding figures for perch being 0.6 and 0.7 per m3, respectively.
Hazardous substances
In 1998, no data on hazardous substances was reported for the 8 selected lakes included in the monitoring programme.
A few individual Counties have investigated the occurrence of pesticides in fresh waters. Aarhus County has thus detected a number of herbicides and their residues in a single lake (Aarhus County, 1999a). The substance present in the greatest quantity was BAM, a degradation product of dichlobenil, which is used in Christmas tree plantations and for eliminating vegetation in courtyards, etc. Other substances detected include hexazinon, which has been prohibited since 1994, and isoproturon.
Of the pesticides detected in two ponds, those present in the greatest quantities were herbicides used on cereals - including isoproturon. AMPA was also detected in both ponds and glyphosat in one of the ponds. The substances most frequently detected in the ponds investigated are typically substances that are commonly detected in other pesticide investigations. A number of these substances are presently prohibited or their use is subject to restrictions.
Among other things, Aarhus County concluded that the long-term effects of the substances detected are generally unknown. The overall effect of the many substances at the ecosystem level has not been investigated either. Finally, the County concluded that as the possibility cannot be excluded that the pesticides will have environmental effects in the aquatic environment, attempts should be made to limit inputs to surface waters.
Quality objective compliance
In connection with the Counties' regional supervision work in 1998, the environmental state of 222 lakes was investigated. Of these, quality objectives have been stipulated for 217. The lake supervision programme encompasses biological and chemical conditions, including such factors as summer Secchi depth, which provides an impression of the environmental state of the lake.
The lake supervision work has primarily been directed at investigating compliance with lake quality objectives. For a given lake to comply with its quality objective, it must meet a set minimum requirement as to Secchi depth, etc. In the great majority of the lakes hitherto investigated, the Secchi depth is still unsatisfactory. At the national level it is estimated that only 32% of the investigated lakes comply with the quality objective set for them in each county's Regional Plan.
One of the priorities of regional lake supervision in several areas has been to investigate the effect of lake restoration projects, in particular investigations of the effect of biomanipulation on the fish stock. Positive effects in the form of clearer water than in the period prior to depletion of the fish stock have been reported in several places, and in a few cases submerged macrophyte communities have become established. The long-term effect of the restoration measures implemented will be investigated in the coming years.
The brackish lakes have not hitherto been studied to any great extent, and were not included in the monitoring programme until after the latest revision. The three brackish lakes investigated in 1998 are all shallow lakes. The nutrient levels are relatively high in all three lakes, the total-P concentration thus being over 0.1 mg P per litre and the total-N concentration being between 2 and 4 mg N per litre. The Secchi depth is therefore also low (under 1 m) and the chlorophyll concentration is correspondingly high.
5.3.2 Trend in lake environmental state
As mentioned above, this is the first time that the brackish lakes are included in the monitoring programme. As a consequence, the trends in lake quality are solely determined on the basis of the time series for the remaining 27 monitoring programme lakes.
Brackish lakes
As Danish lakes are generally small and have a low water volume, the residence time is highly affected by runoff conditions in the individual years. Almost 3/4 of the 30 monitoring programme lakes have a residence time of less than one year, i.e. all the water in these lakes is renewed once to several times yearly.
Interannual variation in residence time and water inputs for the 16 monitoring programme lakes for which detailed water balances have been established also change markedly from year to year depending on the precipitation conditions. Residence times were longest in 1996, but were also long in 1997. In the wet year 1994, the residence times were considerably shorter than in the other years. The residence times were also short in 1998, but not so distinctly as in 1994. Water inputs to the monitoring programme lakes were highest in 1994, high in 1998, and lowest in 1996 and 1997.
Phosphorus and phosphorus balance
Phosphorus input to the 16 lakes has decreased during the 10-year monitoring period. Following two dry years with low phosphorus input it is now back at the 1995 level. Total phosphorus input has decreased significantly in 6 of the 16 lakes, in particular in lakes where the level of phosphorus input used to be very high. The inflow concentration of total-P has decreased markedly during the period 1989-98, with the decrease being significant in 8 of the 16 lakes.
Correspondingly, the annual mean total-P concentration in the 27 freshwater lakes has almost halved from 0.204 mg P per litre in 1989 to 0.104 mg P per litre in 1998. The outflow phosphorus concentration has decreased in roughly the same number of lakes as for the inflow concentration, although not to the same extent as a result of internal phosphorus loading from the sediment in many of the lakes.
Nitrogen and nitrogen balance
Nitrogen input to the 16 lakes was higher in 1998 than in the two preceding dry years. The median input was lower in 1998, however, namely 385 mg N per m2 per day, which corresponds to the inputs recorded at the beginning of the 1990s. Nitrogen input to two of the lakes has reduced significantly over the period 1989-98. The inflow concentration has decreased significantly in four of the 16 lakes, the average concentration being higher than in the preceding dry years, though.
Both absolute and relative nitrogen retention in 1998 were equivalent to the mean values for 1989-97. The variation in the relatively low level of retention is largely determined by the residence time of the water in the lakes. All other things being equal, relative nitrogen retention is always less when residence time is short than when residence time is long because there is too little time for much nitrogen to be converted and released to the air.
Secchi depth and chlorophyll A
The changes in the average Secchi depth and chlorophyll a concentration in the monitoring programme lakes are relatively small compared with the changes in the concentration of nutrients and especially of total-P. The Secchi depth has generally been increasing over the period 1989-98, though, while the chlorophyll a concentration has decreased. The annual mean Secchi depth has varied from 1.7 to 2.0 m. If the lakes are subdivided into four equal groups according to Secchi depth it transpires that the Secchi depth of the most turbid quarter has increased from 0.6 m in 1989 to 1.0 m in 1998. The Secchi depth of the next group has increased from 1.5 to 1.9 m, while the chlorophyll a concentration in this group has fallen correspondingly from 108 to 38 microgrammes per litre.
The overall trend is thus that the most unclear lakes are becoming clearer at the annual level. At the summer level the trend is not so clear, and the Secchi depth for the most turbid quarter has only increased from 0.5 to 0.7 m over the period 1989-98.
Phytoplankton
As is apparent from the Secchi depth and the chlorophyll a concentrations, the majority of the monitoring programme lakes are characterized by a high phytoplankton biomass. In the most of the lakes, the phytoplankton community is dominated by species characteristic of nutrient-rich lakes. The majority of the biomass is thus accounted for by bluegreen algae and green algae. The summer mean total biomass has decreased from 18.7 mg per litre in 1989 to 8.1 mg per litre in 1998. The summer median has decreased from 11.7 mg per litre in 1989 to 3.6 mg per litre in 1998.
Zooplankton
Neither the total biomass nor the biomass of the various types of zooplankton has changed much in the lakes as a whole since 1989. There is thus little overall indication that the capacity of the zooplankton to graze down the phytoplankton has increased in the monitoring programme lakes despite the fall in input of total-P in many lakes.
As with the other variables, the general picture hides a number of differences in the individual lakes. The total zooplankton biomass has thus declined significantly in 4 lakes and increased in 5. A change in the total biomass can be an expression of a change in grazing pressure from carnivorous fish, but it can also be due to changes in the amount of food in the form of phytoplankton.
No clear trend is apparent in the average size of the zooplankton. However, significant changes in the average biomass have been found in a few lakes, although this is not reflected in the total grazing pressure in the individual lakes. Overall, though, there is a tendency towards a slight increase in the grazing pressure throughout the monitoring period.
Submerged macrophytes
The distribution of submerged macrophytes has been investigated once yearly since 1993 in 14 of the 27 freshwater lakes. The average vegetated area has remained largely unchanged throughout the period, although with a tendency towards an increase. The relative plant-filled water volume has generally been increasing slightly in the 14 lakes over the period 1993-98. The depth distribution has generally increased correspondingly in the 14 lakes, although not as markedly as the overall percentage cover and the relative plant-filled volume.
Quality objective compliance
There does not seem to have been any improvement in quality objective compliance since 1989. Thus the number of lakes meeting their quality objective has remained at about 30% throughout the period. In the majority of cases the failure to meet the quality objective is attributable to excessive nutrient loading. Point-source loading and diffuse phosphorus loading from agriculture and sparsely built-up areas are considered to be of decisive significance for lake environmental state.
Even when external nutrient loading of the lakes has been successfully reduced, there is often no immediately detectable effect on water quality. In many cases, this is due to built-in resilience, which prevents improvement from taking place despite the reduction in loading. This can either be due to chemical resilience as a result of a large pool of phosphorus accumulated in the lake sediment or to biological resilience because the fish stock remains unchanged after a reduction in loading.
In order to accelerate improvement, various lake restoration methods have been developed. The most widespread form of lake restoration in Denmark is depletion of planktivorous fish, especially roach and bream. Among other things, these fish graze down the number of zooplankton, especially the number of large and effective filter-feeding daphnia species. This method has been employed in more than 20 Danish lakes and the results so far have been collated by Sřndergaard et al. (1998).
The effect of fish removal has generally been good, although primarily in lakes in which a large part of the fish stock has been removed over a period of a few years. The fish stock should preferably be reduced to under 100 kg per hectare over 1-2 years. The long-term effect of the fish stock manipulations so far undertaken is not yet well-documented as the majority of the projects has been undertaken within the past 4-6 years.
5.4 Marine watersMonitoring of the Danish marine waters is divided between the county and state authorities such that the Counties monitor the coastal waters and the State monitors the open marine waters.
The following description of the environmental state of Danish marine waters and the overall trend is primarily based on the report "Marine waters. Environmental state in 1998" (Markager et al., 1999). The description is supplemented with information from county supervision of the environmental state of the coastal waters.
5.4.1 The year gone by
The main climatic factors affecting the environmental state of the sea are precipitation, wind and the amount of light. The precipitation affects the magnitude of nutrient loading from the land. The wind stirs up the water, counteracting oxygen deficiency at the seafloor, etc., while light is of importance for plant growth. The temperature in 1998 was higher than the normal for the period 1961–90 during the first quarter of the year, while the summer months were cooler than normal, cf. Chapter 2.
Hydrographic conditions
Relative to the normal, the surface water temperature was higher in the spring but lower in the summer months. Combined with the windy weather this resulted in less frequent incidents of temperature stratification of the water, especially in shallow areas.
On the other hand, springtime salinity was markedly higher than normal in the inner marine waters. In April, outflow of water from the Baltic Sea resulted in marked stratification of the water in the southern part of the Little Belt, where the bottom water was not renewed until in October, with resultant severe oxygen deficiency.
Nutrients
Nutrient concentrations in the estuarine fjords, in the coastal waters and in the inner marine waters were generally average in 1998, although they were above average in several fjords in October and November due to the fact that precipitation was twice as great as normal in October.
The exchange of nutrients between estuarine fjords and individual segments of marine waters has been calculated for four fjords - Roskilde Fjord, Odense Fjord, Limfjorden and Ringkřbing Fjord. The results show that nitrogen (total-N) export from the fjords in 1998 was of the same magnitude as in the preceding years.
The magnitude of phosphorus (total-P) exchange between fjord and sea largely depends on the individual fjord. Thus in Limfjorden, export of phosphorus to the North Sea took place for the first time in the 1990s. In Ringkřbing Fjord, the sluice practice was changed in 1996 so that seawater is only let into the fjord when it is windy, thereby hindering stratification of the fjord. As a result, incidents of oxygen deficiency are now exceptional and short lasting, and hence so too is the occurrence of conditions conducive to phosphorus release from the sediment. Phosphorus export from Ringkřbing Fjord has therefore been reduced markedly relative to previous years.
The calculations from Limfjorden and Ringkřbing Fjord further show that less phosphorus is released from the marine sediment than at the beginning of the 1990s.
Oxygen conditions
In 1998, oxygen deficiency in the marine waters was extensive, cf. Figure 5.7. Based on the nitrogen inputs it can be assumed that oxygen consumption at the seafloor in 1998 was around or above the average for the period 1989-97.
Figure 5.7
Stations where oxygen was measured in 1998 and where oxygen deficiency (<4
mg/l) or severe oxygen deficiency (<2 mg/l) was observed (adapted from Markager et al.,
1999).
The windy, cool weather in summer 1998 was beneficial to the open shallow waters. In the shallow estuarine fjords, the water was frequently stirred up so that the bristle worms and mussels that obtain their food by filtering the water were able to partially control the amount of phytoplankton in the water column (Markager et al., 1999). The animals are able to filter the total water volume of the fjords between approx. three times daily (e.g. Ringkřbing, Roskilde and Skive Fjords) and approx. 14 times daily (Odense Inner Fjord).
In the deep stratified areas of the southern Little Belt, Ĺbenrĺ Fjord and Flensborg Outer Fjord, a very long-lasting, severe oxygen deficiency developed. This was partly attributable to a relatively large phytoplankton spring bloom and a subsequent resultant high level of oxygen consumption at the seafloor in connection with decomposition of the sedimented dead algae, and partly attributable to the outflow of water from the Baltic Sea in April, which in these areas caused a marked pycnocline above a layer of standing bottom water. In the open marine waters, widespread oxygen deficiency developed in the southern Kattegat and the Sound, as well as in the Great Belt during the course of the late summer.
Phytoplankton
In 1998, the seawater was clearer than normal. Secchi depth was approx. 23% greater than average for the period 1977-88 and 7% greater than the average for the period 1989-97. The clarity of the water was thus roughly the same as in the low-precipitation years 1996 and 1997.
In 1998, the phytoplankton biomass was generally lower than the average for the period 1989-97, and was only higher than the average for the preceding 10-year period in the southern Kattegat, in Hevring Bay off Randers Fjord, and in Mariager Fjord. In the case of Ringkřbing Fjord, the changed sluice practice is now clearly apparent. The average biomass in 1998 was less than 10% of the biomass in 1995, and the bluegreen algae that previously dominated have now been replaced by other types. No algal blooms were recorded in 1998.
The severe incident of oxygen deficiency with the development of hydrogen sulphide which eradicated the fauna in Mariager Fjord in August 1997 clearly influenced conditions in the fjord in 1998. Many of the predator-prey relationships had not yet been restored and this enabled the unhindered growth of phytoplankton. Seven algal blooms thus occurred during the course of the year.
Apart from this, only few other algal blooms were recorded in 1998 and their effects were limited.
Toxic algae
In the beginning of May there was a major bloom of a toxic planktonic algae of the Chattonella family, which is otherwise best known from the marine waters around Japan. The bloom comprised up to 12 million cells per litre and involved large parts of the Skagerrak, the North Sea along the west coast of Jutland, the Kattegat and down to Aarhus Bay and Odense Fjord. The algae were toxic and caused fish mortality (garfish) in an area from Hanstholm to Skagen and in the western part of Limfjorden. In addition, salmon mortality occurred along the Norwegian Skagerrak coast.
In all, around 20 potential toxic species of phytoplankton were recorded in the marine waters and estuarine fjords in 1998. These did not cause any known effects. A few mussel fishing areas along the east coast of Jutland were briefly closed for mussel fishing because the number of toxic dinoflagellates exceeded the limit level of 500 cells per litre. At no point were algal toxins detected in the mussels, however.
Benthic vegetation
In 1998, the depth distribution for eelgrass increased in 27% of the waters, decreased in 17% and remained unchanged in 47% (or information is unavailable) (Table 5.4). The tendency towards increasing depth distribution is especially apparent in the outer sections of the estuarine fjords and along open coasts such as in the Little Belt, the sea south of Funen and the outer part of Kalundborg Fjord. The tendency towards a decreasing depth distribution has been recorded in a number of closed fjords, among others Mariager Fjord, Randers Fjord, Odense Fjord and in the western part of Limfjorden.
Table 5.4
Trend in eelgrass depth distribution and coverage and the coverage of
eutrophication-dependent algae in 1998 relative to the preceding years. Based on county
environmental data. The trend is described as either increasing (I), falling (F), status
quo (O), or unknown (-) (adapted from Markager et al., 1999).
| Marine area | Eelgrass |
Eutrophic algae |
|
| Depth distribution | Coverage |
Coverage |
|
| Odense Fjord | F |
I |
I |
| Sea south of Funen | I |
- |
O |
| Kertinge Cove | I |
I |
- |
| Ĺrhus Bay, Kalř Cove | O |
- |
- |
| Mariager Fjord | O |
F |
I |
| Randers Fjord | F |
F |
- |
| Roskilde Fjord | O |
F |
O |
| Ringkřbing Fjord | I |
F |
O |
| Nissum Fjord | I |
I |
- |
| Karrebćksminde Bay | O |
O |
- |
| Dybsř Fjord | O |
- |
I |
| Karrebćksminde Fjord | O |
- |
I |
| Prćstř Fjord | O |
- |
I |
| Isefjord | O |
- |
F |
| Little Belt (N) | I |
I |
O |
| Little Belt (S) | I |
- |
O |
| Limfjorden (W) | F |
F |
I |
| Grĺdyb tidal flats | - |
- |
I |
| Lister Deep | - |
- |
O |
| Aabenraa Fjord | O |
I |
I |
| Augustenborg Fjord | O |
F |
I |
| Flensborg Fjord | F |
F |
O |
| Kolding Fjord | I |
- |
O |
| Vejle Fjord | O |
- |
O |
| Horsens Fjord | F |
- |
O |
| Kalundborg fjord | I |
- |
I |
| Korsřr Cove | O |
- |
I |
| Nivĺ Bay | - |
- |
F |
| The Sound | O |
- |
F |
| Křge Bay | O |
- |
F |
| Falling tendency (%) | 17 |
23 |
13 |
| Increasing tendency (%) | 27 |
13 |
37 |
| Status quo (%) | 47 |
3 |
33 |
| Unknown (%) | 10 | 60 | 17 |
The distribution of drifting eutrophication-dependent macroalgae such as filamentous brown algae (Ectocarpus), silkweed (Cladophora) and sea lettuce (Ulva) has been systematically monitored since 1994. In 1998, increasing abundance of these algae was recorded in a number of enclosed fjords, including Karrebćksminde Bay and Dybsř, Prćstř, Ringkřbing, Nissum and Mariager Fjords. Decreasing abundance has only been observed in open waters such as Nivĺ Bay and Isefjord.
Benthic fauna
In contrast to previous years, the benthic fauna in quite a few of the Danish estuarine fjords displayed common features in the form of low biomass and number of individuals. This is in line with the improved environmental conditions detected, particularly along the west coast of Jutland and in the Sound.
The trend in the benthic fauna is thus as expected, with the occurrence of benthic fauna one year being related to nutrient inputs the preceding year (Ćrtebjerg et al., 1998). In 1997, nutrient inputs to the sea were low due to the low runoff from the land, thus accounting for the low benthic faunal abundance in 1998.
Marked deviation from the general trend was recorded in Mariager Fjord and Ringkřbing Fjord. In Mariager Fjord, considerable recolonization by benthic fauna was recorded in 1998 following the extensive benthic faunal mortality in August 1997. In Ringkřbing Fjord, changes in sluice practice have resulted in a marked increase in benthic faunal biomass. Sand mussels in particular have returned in great numbers.
Hazardous substances
Monitoring of hazardous substances in the marine environment, which was added to NOVA-2003 in 1998, is usually based on measurement of the concentration in plants or animals or sediment. The highest concentrations of hazardous substances are expected to occur in our estuarine fjords and the more inshore waters, where dilution of discharges is least. It is also here that one can expect the greatest effect of a reduction in the discharge of a given substance. The monitoring work thus mainly focuses on the fjords and coastal waters.
Hazardous substance groups
In evaluating the results, the hazardous substances are dealt with in the following main groups:
PCB (polychlorinated biphenyls): the sum of the concentration of 10 selected representatives of the PCBs, | |
HCH: the sum of a -HCH, b -HCH and g -HCH (lindane), | |
DDT: the sum of pp'-DDE, pp'-DDD and pp'-DDT, and | |
PAH (polyaromatic hydrocarbons): the sum of the concentration of PAHs and the other aromatic hydrocarbons. |
OSPAR has developed ecotoxicological assessment criteria for the hazardous substances encompassed by the marine part of NOVA-2003. These criteria give the concentration intervals below which effects on marine organisms are unlikely. In addition, OSPAR and others have established various background/reference levels for the occurrence of a number of hazardous substances in mussels. In general, though, the basis for evaluating the occurrence of hazardous substances in marine sediment and biota is very limited.
Assessment of heavy metals
In 1998, the measured concentrations of heavy metals in common mussels and fish were relatively low, which means that the environmental quality objectives were met in the majority of the areas investigated. In the areas where raised concentrations of mercury and/or some of the other heavy metals have been detected in mussels and fish the presence of the metals was probably due to contamination from local sources. In the Sound, raised concentration levels were detected for all the heavy metals investigated except nickel. Raised levels of both zinc and copper were detected in Roskilde Fjord and Odense Fjord, while raised levels of mercury were detected in Odense Fjord and the Wadden Sea.
In general, the concentrations of heavy metals in fish decrease as one moves from the Sound through the Great Belt to Hvide Sande. In 1998, mercury levels in fish were only investigated in the Sound. The results indicate that the levels are lower than the limit value for food (Frederiksborg County, 1999).
Assessment of organotin
The highest concentrations of tributyl tin (TBT) in mussels were detected in Odense Fjord, Aarhus Bay and in the Sound. The concentrations are also relatively high in the Great Belt compared with other marine waters. These marine waters are all characterized by a high level of ship traffic and other ship-related activities that can comprise a source of TBT. The distribution of TBT and its degradation products in mussels indicates that the mussels have recently been exposed to TBT. The other organotin compound - triphenyl tin - has only been found in detectable levels in a few samples from Horsens and Odense Fjords.
The TBT concentrations in mussels are high at all stations. The level ranges from approx. two to 120 times greater than OSPAR's evaluation criteria. Studies of the biological effects of TBT concentrations have thus shown that all the red whelk and a considerable fraction of the pygmy whelk and common whelk in the inner Danish marine waters exhibited hormonal disturbances with the development of male genitalia in females. Nearly all the female periwinkles collected in Copenhagen harbour and 40% of the female snails collected near the Lindř Shipyard in Odense Fjord exhibited intersex characteristics to an extent that has caused sterility.
Chlorinated organic compounds
The PCB concentration in all marine waters is at a level where the possibility of ecological effects cannot be excluded according to OSPAR's evaluation criteria. The only exception is Ringkřbing Fjord, where the level is low. Uncharacteristically high levels have been detected in a few samples from Horsens harbour and from Roskilde Fjord. This issue should be examined more closely over the next few years of monitoring.
At the present time, there is insufficient data to be able to evaluate whether the levels of DDT and HCH in mussels and fish pose a problem.
Evaluation of PAHs
In general, it can be concluded that the PAH concentration in Danish coastal waters is at the same level as in relatively unpolluted marine waters. High values have been detected in a few estuarine fjords, especially in areas with little water exchange and/or potent point-source discharges.
Quality objective criteria
Quality objectives for coastal marine waters are set by the County Councils in their Regional Plans. The quality objective set for most marine waters is the General Quality Objective, i.e. only slight human impact on the environment is permissible and the hygienic standard of the water body has to be good. The characteristics that the County Council decides to focus on when defining the quality objectives depends on the nature of the marine water in question.
In order to make assessment of the extent to which a given marine water complies with its quality objective as clear as possible, parameters are often chosen that are easy to measure and quantify. Knowledge of how these parameters vary in line with changes in environmental state is also necessary. The final decision will nevertheless often depend on a judgement of the overall situation, among other reasons because our knowledge of the mechanisms that determine the development of the selected parameters is incomplete.
In the majority of marine waters it is inputs of nutrients and organic matter that are of interest. The occurrence of oxygen deficiency is often used in such assessments, partly because oxygen deficiency reflects the extent of present or past nutrient and organic matter loading, partly because oxygen deficiency is of great significance for the whole ecosystem.
The depth distribution of the vegetation, which particularly reflects the transparency of the water, is also an indicator of the longer-term environmental state. The composition and abundance of the benthic fauna is also used as an evaluation criterion. In this case, it is the dependence of the fauna on good oxygen conditions and an ample food supply that determines the state. In marine waters that are affected by high levels of nutrient loading, filamentous algae or annual green algae (eutrophication-dependent macroalgae) are often favoured at the expense of other types of vegetation. Enhanced occurrence of such organisms can therefore often be employed as an indicator of an unacceptable state. Finally, enhanced phytoplankton abundance or production are well-known indicators of nutrient loading.
Quality objective compliance
As is apparent from the 1996 and 1998 reports on the state of the Danish aquatic environment (Danish EPA, 1997 and 1998) and the county technical reports, the environmental state of the majority of the coastal waters fails to comply with the quality objectives set for them, and efforts to deal with land-based nutrient loading are necessary if the desired quality objectives are to be met. Table 5.5 summarizes the county assessments of the current (1998) state of coastal waters relative to their quality objectives. The table only considers whole water bodies, and there can be local divergences that are not fully reflected in the table.
Table 5.5
State of the environment in 1998 relative to the quality objectives for the coastal waters. Based on county environmental data. Under "State", " –" indicates lack of compliance with the quality objective, "+" indicates compliance with the quality objective and "?" indicates that the quality objective is threatened.
The column "Parameters" lists the parameters used for assessing the environmental state as: NC – Nutrient concentrations; PAB – Planktonic algal blooms; TA – presence of toxic algae; OD – Oxygen deficiency; OP – Oil pollution; EM: Mass occurrence of eutrophication-dependent macroalgae; BMB – Benthic macroinvertebrate biomass; SD – Secchi depth; PE – Physical effect; BVC – Benthic vegetation coverage: M – Miscellaneous. The column "Causes" describes the types of sources that the county authorities consider to be of greatest significance and where further measures to reduce loading would be highly appropriate.
| Area | State |
Parameters | Causes |
| North Sea – coastal regions | - |
NC, PAB, TA, OP | Discharges from rivers and Danish streams |
| Wadden Sea | - |
NC, EM, BMB | Discharge of nitrogen in particular |
| Ringkřbing Fjord/ Nissum Fjord |
- |
NC, SD, M | Input of nutrients, especially nitrogen |
| Skagerrak – coastal regions | + |
NC | - |
| Limfjorden | - |
NC, PE | Nitrogen loading from agriculture Scraping with fishing equipment |
| Kattegat (W) | - |
EM, BMB | Nitrogen loading, especially from the open countryside |
| Randers Fjord | - |
NC, BVC | Nutrient loading |
| Mariager Fjord | - |
NC, BVC, BMB | Nutrient loading from land, limited water exchange with the Kattegat |
| Kattegat (S) – coastal regions | + |
- | |
| Isefjord | - |
OD, EM, M | Nitrogen loading |
| Roskilde Fjord | - |
Not given | Not given |
| Ĺrhus Bay | - |
OD, BVC, PAB | Nitrogen loading but also phosphorus loading from cultivated land. Nutrient input from the atmosphere, the Kattegat and the sediment. |
| Horsens Fjord | - |
BVC, BMB | Mussel trawling Nutrient loading |
| Sejrř Bay | -/? |
OD, EM, M | Nitrogen loading |
| Odense Fjord | - |
PAB, EM | Enhanced nutrient concentrations Hazardous substances |
| Vejle Fjord | ? |
- | Conditions seem good in 1998 |
| Kolding Fjord | - |
BMB | Nutrient loading |
| Augustenborg Fjord | - |
EM, BVC, M | Nutrient loading |
| Ĺbenrĺ Fjord | - |
OD, EM, BVC | Nutrient loading |
| Flensborg Fjord | - |
OD, BVC, M | Nutrient loading |
| Helnćs Bay | - |
EM | Nutrient loading |
| Little Belt (S) | - |
OD, BMB | Nutrient loading |
| Great Belt | - |
OD | Nutrient loading |
| Sea south of Funen | - |
PAB, EM | Nutrient loading |
| Holckenhavn Fjord | - |
BVC, EM, M | Nutrient loading and water exchange |
| Kertinge Cove | - |
EM | Nutrient loading |
| Kalundborg Fjord | - |
OD, EM, M | Nitrogen loading |
| Korsřr Cove | - |
OD, EM | Nitrogen loading |
| Karrebćksminde Bay | + |
SD, BVC, OD | - |
| Karrebćk Fjord – inner part | + |
Not given | - |
| Karrebćk Fjord – outer part | - |
EM | Nutrient loading |
| Dybsř Fjord | - |
EM, M | Nutrient loading |
| Belt Sea (S) (Storstrřm County) | + |
SD, OD | - |
| The Sound (N) | - |
EM, BVC, BMB, M | Nitrogen loading |
| The Sound (open regions) | + |
SD | - |
| Křge Bay | +/- |
OD, EM | Nitrogen loading |
| Baltic Sea – coastal regions | - |
NC, EM | Nutrient loading |
Hazardous substances in relation to quality objectives
It is difficult to assess to what extent the hazardous substances investigated have effects that hinder compliance with the General Quality Objectives. This is partly because the quality objectives are only loosely defined and partly because the technical/scientific basis for them needs to be developed. In view of the uncertainty associated with the monitoring of hazardous substances and the limited basis for assessment, an actual assessment of whether the quality objectives have been met must await the monitoring results for the coming years. A single exception is TBT, where effects can clearly be demonstrated in the sea.
Based on this year's results it seems that for most marine waters, the General Quality Objective can probably be met for heavy metals and PAHs, but not for TBT. With the other hazardous substances it is too early to be able to assess whether the quality objectives have been met.
5.4.2 Trend in the environmental state of the sea
Nutrients
Transport of nutrients from the estuarine fjords to the open marine waters has been partly investigated in four fjords, namely Ringkřbing Fjord, Limfjorden, Odense Fjord and Roskilde Fjord.
Based on calculations for 1985, 1992 and 1998, export of nutrients from Roskilde Fjord to Isefjorden has decreased by approx. 54% for nitrogen and approx. 75% for phosphorus. The decrease in nitrogen export is unrelated to the trend in nitrogen loading from the land. Due to the small number of years for which calculations are available the conclusions are not unambiguous, however.
Limfjorden generally exports more nutrients to the Kattegat than it receives from the North Sea. The calculations of transport conditions since 1990 show no indication of any trend in nitrogen export, but the export of phosphorus to the Kattegat has fallen since 1990. Exceptions to this are 1994 and 1997, when there was extensive oxygen deficiency and hence enhanced release of phosphorus from the fjord sediment.
The decrease in the concentration of phosphate and total-P in the open inner marine waters continued in 1998. However, the observed decreases are too great to be solely attributable to improved wastewater treatment as a result of implementation of the 1987 Action Plan on the Aquatic Environment. The fall might be caused by changes in water exchange between the North Sea/Skagerrak and the Baltic Sea. The issue has not yet been elucidated in detail.
An analysis of the time-weighted concentrations of nitrate+nitrite-N in the winter period reveals a tendency towards a slight fall over the period 1989-98 in 10 out of 12 stations in the Kattegat, but no significant change in the Belt Sea and the Sound.
Nutrient limitation
Evaluation of the number of days when growth is nutrient-limited (irrespective of whether nitrogen or phosphorus is the limiting factor) reveals that this primarily depends on the pollutional state of the area. Thus the most strongly polluted areas have the fewest days with nutrient-limited growth, while the least polluted areas have the most days with nutrient-limited growth. In the Belt Sea, the number of nutrient-limited days varies from approx. 100 to 180 days per year, while it is somewhat higher in the Kattegat at 220-250 days per year (Markager et al., 1999).
In Odense Fjord, the annual number of days with nutrient limitation was approx. 40 in the innermost part and 180 in the outermost part of the fjord. The number of days with nutrient limitation has increased markedly since 1990, this being attributable to the decrease in nutrient loading throughout the period.
In the Kattegat, there is no evidence of any change in the number of days that growth has been nutrient-limited. There has been a change in the balance of nutrient loading, however, as reflected by an increase in the number of days when both nutrients are limiting for growth. The reason for the change in the balance between nutrients is the general decrease in the phosphate concentration, cf. Figure 5.8. An assessment of which nutrient phytoplankton growth is limited by in the estuarine fjords revealed that growth is generally phosphate-limited in the spring and nitrate-limited from the early summer to the end of the year (Markager et al., 1999). Due to the marked reduction in phosphorus inputs from urban wastewater treatment plants, the number of days on which phosphate is the potential limiting nutrient has increased in recent years in most estuarine fjords, in the coastal waters and in the inner open marine waters. This is in accordance with experimental studies showing that nitrogen is the primary limiting nutrient in open parts of the inner Danish marine waters (Graneli et al., 1990).
Figure 5.8
Number of days with potential nitrate limitation, potential phosphate limitation
and potential limitation by both nitrate and phosphate at station 925 at Anholt in the
Kattegat for the period 1989-98 (adapted from Markager
et al., 1999).
Phytoplankton
The amount of phytoplankton expressed in terms of the amount of chlorophyll a was low in the inner open Danish marine waters in 1998, cf. Figure 5.9. On average it was 14% below the level for the period 1977-98 and 21% under the level for the period 1989-98. The picture in the estuarine fjords and in the coastal waters is virtually the same, but not quite so pronounced. A statistical analysis shows that there has been a statistically significant decrease over the period 1989-98, but that the trend is primarily attributable to the two dry years 1996 and 1997. On the other hand, the trend is significant if the period 1977-98 is analysed.
Figure 5.9
Temporal development in chlorophyll a index at marine stations defined as
stations where the water is more than 10 m deep and which are not located in estuarine
fjords (adapted from Markager et al., 1999).
Toxic algae
Toxic algae normally do not pose a problem until they occur in blooms. The number of known toxic planktonic algae has increased considerably in the past 20 years and new species keep ducking up that have not previously caused problems. The reasons for this are unknown.
A particular problem is posed by ship ballast water, which is presently considered to be a major route of dispersal for toxic algae. In many cases, the algae have been traced back to the eastern part of Asia. Many planktonic algae have a cystic resting stage in their life cycle and hence can survive for as long as several years in the dark, for example in the ballast tank of a ship. If the tank is emptied, the cysts can germinate providing growth conditions in the new location are favourable. The International Maritime Organization (IMO) has therefore drawn up a number of recommendations aimed at reducing this unintended dispersal (Kaas et al., 1999).
Benthic fauna
Crustacean abundance has more than halved since the beginning of the 1980s, while bristle worms, mussels and echinoderms were very abundant at the beginning of the 1990s, but have since fallen to the same level as in the 1980s. The most significant change is the decrease in the number of crustaceans. In the same period, there was an increase in the number of soft-bodied animals, which have been on the decline again since 1995. The reasons for these swings are unknown.
The inter-annual variation at four stations located in the Kattegat, the Great Belt, the Sound and the Arkona Sea, for which long time series are available, reveals a time delay of 1-2 years relative to the variation in nutrient inputs from the land. The relationships have not changed significantly through the monitoring period and the environmental state of the benthic fauna is therefore considered to be largely unchanged in the open marine waters over the period 1989-98.
Benthic vegetation
For the nation as a whole there has not been any significant change in the depth distribution of eelgrass during the period 1989-97. However, marked inter-annual variation has been recorded, cf. Figure 5.10. The depth distribution was unchanged during the first half of the 1990s. In 1996 and 1996, however, the average depth distribution increased by 0.5 to 1 m compared with that in 1995 as a result of enhanced Secchi depth and improved light conditions. In 1998, the depth distribution had returned to the same level as in 1995. Compared to the situation at the beginning of the Century, the depth distribution of eelgrass is now considerably lower.
Figure 5.10
Eelgrass maximum depth distribution (adapted from Markager et al., 1999).
The decisive determinant of the trend in the distribution of eelgrass and drifting eutrophication-dependant macroalgae during the period 1989-98 was the magnitude of nutrient inputs.
By influencing planktonic algal growth, nutrients also affect light conditions for the benthic vegetation. An analysis of the inter-annual variation in nutrient concentrations reveals that the high concentrations of total-N in the period 1993-95 coincide with low eelgrass coverage during the same period. In the two dry years 1996 and 1997, the concentration of total-N fell while the eelgrass depth distribution increased during the same period. In 1998, the concentration of total-N increased again, this being matched by a decrease in the depth distribution of eelgrass.
Oxygen deficiency
In general, no clear trend can be detected as to the occurrence or frequency of oxygen deficiency in the marine waters around Denmark. Serious incidents of oxygen deficiency occurred in the southern Kattegat in 1981, 1986, 1987 and 1988, cf. Figure 5.11. In the southern Belt Sea, oxygen deficiency was so severe in 1981 and 1985 that hydrogen sulphide formed at the sea floor.
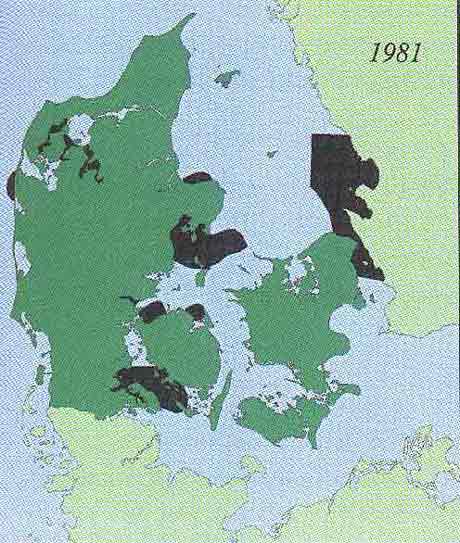
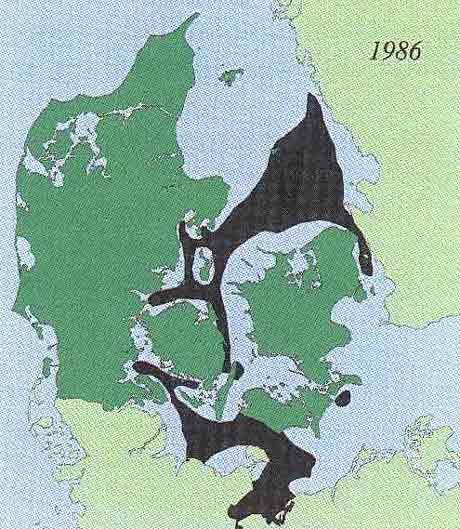
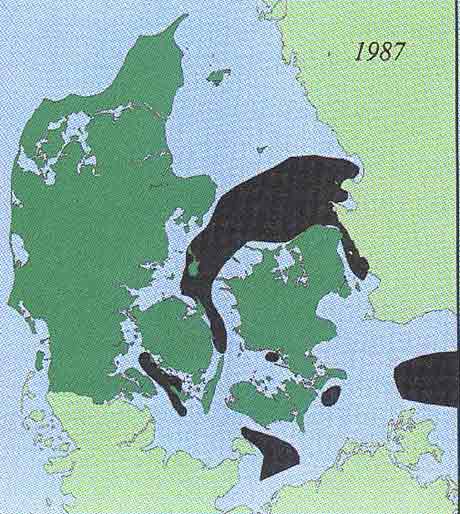
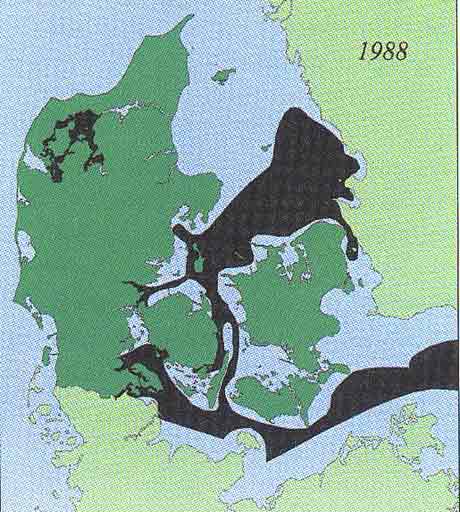
Figure 5.11
Extent of oxygen deficiency in 1981, 1986, 1987 and 1988.
Model calculations have shown that the oxygen concentration in the bottom water of the inner Danish marine waters is coupled to nitrogen loading from the land, and that a permanent reduction in loading would improve conditions considerably (Ćrtebjerg et al., 1998).
The long-term trend (since the 1970s or 1980s) in oxygen conditions has been investigated in the Belt Sea and adjoining fjords (Markager et al., 1999). Improved oxygen conditions were detected at seven out of nine stations in the spring, while deteriorated oxygen conditions were detected at seven out of eight stations in the autumn, cf. Table 5.6.
Table 5.6
Stations where a significant (5%) change has been detected in spring (April-June) or
autumn (July-October) minimum oxygen concentration (from Markager et al., 1999).
| Marine area | Season |
Period |
Trend |
| Odense Fjord | Spring |
1997-98 |
Ż |
| Odense Fjord | Spring |
1989-98 |
Ż |
| Little Belt (N) | Spring |
1977-98 |
|
| Ĺbenrĺ Fjord | Spring |
1988-98 |
|
| Augustenborg Fjord | Spring |
1988-98 |
|
| Flensborg Inner Fjord | Spring |
1987-98 |
|
| Flensborg Outer Fjord | Spring |
1987-98 |
|
| Sea south of Funen | Spring |
1989-98 |
|
| Svendborg Sound | Spring |
1989-98 |
|
| Odense Fjord | Autumn |
1977-98 |
Ż |
| Snćvringen | Autumn |
1976-98 |
Ż |
| Little Belt (S) | Autumn |
1975-98 |
Ż |
| Flensborg Outer Fjord | Autumn |
1987-98 |
|
| Sea south of Funen | Autumn |
1977-98 |
Ż |
| Langeland Sound | Autumn |
1979-98 |
Ż |
| The Sound | Autumn |
1970-98 |
Ż |
| Křge Bay | Autumn |
1985-98 |
Ż |
Hazardous substances
Because of the limited knowledge concerning the occurrence of hazardous substances in 1998, it is not possible to assess the overall trend in their concentrations in the marine environment. The mercury content of flounder in the waters of the Sound has fallen by a factor of four over the period 1973-98 at Copenhagen and by a factor of three at Vedbćk (Frederiksborg County, 1999). The concentrations of all the heavy metals investigated are now at the same levels as when the Danish Foods Agency investigated the concentrations of heavy metals in Danish coastal fish in the period 1979-82 (Danish Foods Agency, 1994).
The general trend in the North Sea is towards decreasing heavy metals concentrations over the past 10 years. In the case of hazardous substances, the trend is less clear (OSPAR, in preparation).
Monitoring of effects around offshore rigs
Monitoring was undertaken in the vicinity of selected oil rigs in the Danish part of the North Sea during the period 1989-98 in accordance with applicable Danish guidelines. The main purpose of the investigations was to map changes in sediment and benthic faunal composition and identify the most important factors to which the observed changes can be ascribed.
The investigations revealed that discharges in connection with drilling and the operation of offshore oilrigs clearly affect bottom conditions around the rigs. The discharge of drilling muds is considered to be the main cause of the changes detected.
Thus discharges from drilling rigs in the Gorm, Kraka and Harald oil fields markedly affected the conditions at the seafloor in areas up to 250 m from the oilrigs. Less severe changes were detected at distances of up to 1,500 metres. The effects include enhanced levels of such substances as hydrocarbons, barium and heavy metals in the sediments and a reduction in the biomass and number of benthic faunal species present. The variation in benthic faunal biomass could be correlated with the sediment content of hydrocarbons and barium.
A reduction in discharges in connection with the cessation of drilling activity diminished the impact on the benthic fauna, while certain species, including the brittle star Amphiura filiformis, which is an abundant member of the benthic faunal communities in the central North Sea, have not re-established themselves up to 2-3 years after cessation of drilling.
Quality objective compliance
Despite a series of positive tendencies, the environmental state of the Danish marine waters does not fully comply with the quality objectives set for them. The effects of the efforts to reduce agricultural discharges are not yet reflected by an improvement in environmental quality, and national implementation of a series of international action plans is not yet fully complete. It can be expected that when these measures have been fully implemented, this will be reflected in the level of quality objective compliance.
[Front page] [Contents] [Previous] [Next] [Top] |