|
The Aquatic Environment in Denmark 1996-1997
2. Discharges from point sourcesPoint sources normally include all direct discharges. In the monitoring programme of the Aquatic Environment Plan the term covers:
| Outfalls from sewage treatment plants | |
| Individual industrial discharges | |
| Storm water overflows – i.e. discharges from sewers during storms | |
| Outfalls from freshwater and salt-water based fish farms and | |
| Outfalls from houses and farmyards in rural or sparsely populated areas |
Basis of the surveys
The surveys of discharges from the various point sources are based partly on measurements, partly on theoretical calculations. For sewage treatment plants and large, individual industrial discharges, the surveys are based on measurements of substances and water flow. Theoretical calculations are used for storm water overflows and discharges from sparsely populated areas. Finally, discharges from fish farms - both freshwater and salt-water based - are based on information on the production facilities and feed consumption.
Total discharges
In the picture of the total point source discharges sewage treatment plants dominate as regards nitrogen and phosphorus where they account for 55%. Discharges of organic matter come especially from the industry which is responsible for about 35% of this discharge (see Figure 2.1).
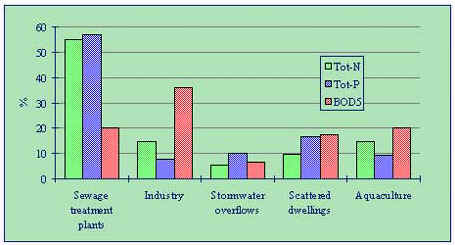
Figure 2.1
Percentage distribution of total discharges of nitrogen (Tot-N), phosphorus (Tot-P) and organic matter (BOD5) from point sources in 1996.
Discharges to freshwaters
Industrial discharges to freshwaters are largely insignificant. In terms of organic matter, sparsely populated areas and fish farms are most significant. About half the nitrogen comes from sewage treatment plants, followed by fish farms and sparsely populated areas. Sewage treatment plants are also the main source of phosphorus, sparsely populated areas providing the next largest amount (see Figure 2.2).
Figure 2.2
Percentage distribution of nitrogen (Tot-N), phosphorus (Tot-P) and organic matter (BOD5)
from freshwater point sources in 1996
Discharges direct to the sea
Point source discharges direct to marine areas are totally dominated by sewage treatment plants as far as nitrogen and phosphorus are concerned, while industrial discharges are responsible for most of the organic matter. The 29 marine fish farms provide more than 10% of the discharges of organic matter (see Figure 2.3).
Figure 2.3
Percentage distribution of nitrogen (Tot-N), phosphorus (Tot-P) and organic matter (BOD5)
from point sources direct to the sea in 1996
2.1 Sewage treatment plants
All municipal and private sewage treatment plants with a capacity of more than 30 person equivalents (PE) are covered by the monitoring programme of the Aquatic Environment Plan (30 PEs correspond to about 10 households). 1 PE from households comprises 4.4 kg of total nitrogen, 1.0 kg of total phosphorus and 21.5 kg of organic matter expressed as BOD5, which means biochemical oxygen demand over 5 days.
Table 2.1
Distribution of sewage treatment plants >30 PE by county
| Number | |
| Bornholm | 18 |
| Frederiksborg | 106 |
| Funen | 125 |
| Copenhagen | 13 |
| North Jutland | 123 |
| Ribe | 77 |
| Ringk�bing | 116 |
| Roskilde | 62 |
| Storstr�m | 241 |
| South Jutland | 166 |
| Vejle | 94 |
| West Zealand | 160 |
| Viborg | 101 |
| Aarhus | 232 |
| Total | 1,634 |
The counties each year report a series of key figures for all sewage treatment plants to the Danish EPA. These figures form the basis of calculations of the discharges of nitrogen, phosphorus and organic matter from the plants.
The Aquatic Environment Plan includes a provision that all large municipal sewage treatment plants should be expanded in accordance with the requirements of the Plan by January 1, 1993. This means that all plants with a capacity of more than 15,000 PEs should remove nitrogen down to a level of 8 mg/l, phosphorus to 1.5 mg/l and BOD5 to 15 mg/l. All plants between 5,000 and 15,000 PEs are also required to reduce phosphorus to 1.5 mg/l.
The total number of sewage treatment plants covered by these requirements is just under 300. Of these, about 175 are only covered by the phosphorus requirements while the remainder of the plants have to meet phosphorus, nitrogen, and BOD5 requirements.
A summary by county of the distribution of sewage treatment plants is shown in Table 2.1.
2.1.1 Waste water volumes and sewage treatment plant sizes
Most of the population of Denmark is connected to sewers and thereby also to a sewage treatment plant. Industrial as well as domestic waste water is also passed to such plants, in addition to a certain volume of rain-water in combined sewerage areas. Infiltration and exfiltration also occur as a result of leaking sewers. Seen as a whole, there is thus a net inflow of ground water which is fed to the sewage treatment plants.
Waste water volumes
In 1996, the total amount of pollution fed to sewage treatment plants was about 8.3 million PEs.
Based on the number of houses not connected to sewers (see section 2.4) and the total number of inhabitants in Denmark, it is concluded that approx. 85% of the population is connected to the sewer network.
Industrial share
The remainder, about half of the total load on sewage treatment plants, comes from industry.
Distribution of plants by size
Sewage treatment is carried out in many large and small plants. There are only about 25 plants bigger than 100,000 PEs, but these treat more than 45% of the total quantity of sewage.
2.1.2 Treatment provisions and degrees of treatment
With the exception of a very small amount (< 1%) discharged without treatment, waste water is subjected to varying degrees of treatment.
Types of plants
Mechanical treatment takes place by settling of particulates, which are removed as sludge. Larger objects are removed by screens and sand and fat by traps.
Biological treatment takes place by means of micro-organisms, and chemical treatment, particularly directed at removal of phosphorus, takes place by precipitation with lime, iron or aluminium salts.
Nitrogen removal is a further biological process whereby the nitrogen compounds in the sewage are converted to free nitrogen (N2).
The different treatment methods can be combined to a varying extent, although a mechanical treatment stage will always be included.
Distribution of plant types
72% of the total waste water volume was subjected to mechanical-biological purification and removal of nitrogen and phosphorus in 1996. The remainder was treated biologically or biologically-chemically with the exception of 3% which was only mechanically treated.
Degrees of purification
Mechanical purification removes about 30% of the organic matter and 10-20% of the phosphorus and nitrogen content. The addition of biological purification reduces organic matter by more than 90% and nitrogen and phosphorus by 30-40%.
Treatment processes specifically designed to remove nitrogen and phosphorus can typically remove more than 80% of nitrogen and more than 90% of phosphorus.
2.1.3 Nutrient discharges
Table 2.2 shows that the total discharges of nutrients and organic matter amounted to about 6,400 tonnes of nitrogen, 900 tonnes of phosphorus and 5,000 tonnes of organic matter measured as BOD5.
Table 2.2
Discharges from sewage treatment plants 1996
| County | Water |
Tot-N |
Tot-P | COD |
BOD5 |
mill. m� |
tonnes |
||||
| Bornholm | 7 | 84 | 19 | 17 | 2 |
| Frederiksborg | 35 | 292 | 39 | 1512 | 194 |
| Funen | 56 | 327 | 35 | 1692 | 222 |
| Copenhagen | 121 | 2,055 | 369 | 9093 | 1648 |
| North Jutland | 57 | 489 | 51 | 3245 | 347 |
| Ribe | 29 | 281 | 40 | 1075 | 121 |
| Ringk�bing | 36 | 326 | 27 | 1378 | 189 |
| Roskilde | 22 | 145 | 29 | 1059 | 127 |
| Storstr�m | 30 | 336 | 61 | 1871 | 390 |
| South Jutland | 29 | 369 | 52 | 1628 | 377 |
| Vejle | 49 | 401 | 38 | 2324 | 222 |
| West Zealand | 29 | 305 | 45 | 2043 | 342 |
| Viborg | 31 | 353 | 37 | 1747 | 393 |
| Aarhus | 71 | 623 | 63 | 2468 | 323 |
| Whole country | 603 | 6,386 | 904 | 31,453 | 4,979 |
Exemptions
When the Plan was adopted, the intention was that all sewage treatment plants were to be extended by January 1, 1993. It was subsequently acknowledged that it might be difficult to achieve this objective in certain situations and for this reason it was made possible for the Danish EPA, on recommendation by the counties, to make exemptions from this deadline.
2.1.4 Status and development
Development from 1989 to 1996
Discharges from sewage treatment plants of nitrogen, phosphorus and organic matter have been reduced since 1989, when national figures were first compiled. Discharges of nitrogen have been reduced from about 18,000 tonnes to 6,400 tonnes, of phosphorus from 4,470 tonnes to 900 tonnes and, finally, BOD5 from 36,400 to 5,000 tonnes.
These figures represent nitrogen and phosphorus reductions of 68% and 85%, respectively, from the discharge levels when the Action Plan for the Aquatic Environment was adopted.
Targets met
The objectives set for reduction of discharges of nitrogen and phosphorus when the Action Plan for the Aquatic Environment was adopted were met by the end of 1996.
2.2 Individual industrial discharges
The monitoring programme of the Aquatic Environment Plan for individual industrial discharges embraces all industrial enterprises with discharges exceeding 30 PEs. In 1996, the monitoring programme contained 100 discharge points.
Nutrient discharge figures are submitted annually by the counties to the Danish EPA, and they are used to compile the total industrial discharge figures (see Table 2.3).
Note that industrial point sources from where waste water is sprayed on forestry or agricultural areas have not been taken into account.
2.2.1 Discharge of nutrients
Discharges of phosphorus and nitrogen direct from industries remain low as compared with other discharges. Especially the fish processing industry is responsible for the discharges of nitrogen and phosphorus. Thus, this industry is responsible for 39% of the nitrogen discharges and 53% of the phosphorus discharges
Table 2.3
Individual industrial discharges in 1996.
| County | Water |
Tot-N |
Tot-P |
COD |
BOD5 |
tonnes |
|||||
| Bornholm | 3 | 11 | 2 | 99 | 189 |
| Frederiksborg | 1 | 4 | 0 | 3 | 3 |
| Funen | 5 | 184 | 2 | 29 | 399 |
| Copenhagen | 3 | 116 | 0 | 74 | 77 |
| North Jutland | 18 | 373 | 45 | 2,074 | 3,388 |
| Ribe | 6 | 205 | 3 | 365 | 403 |
| Ringk�bing | 12 | 93 | 14 | 310 | 744 |
| Roskilde | 9 | 298 | 19 | 1,079 | 13,374 |
| Storstr�m | 10 | 104 | 7 | 3,315 | 5,708 |
| South Jutland | 7 | 27 | 5 | 53 | 177 |
| Vejle | 1 | 0 | 0 | 5 | 5 |
| West Zealand | 10 | 151 | 6 | 1,083 | 1,990 |
| Viborg | 7 | 103 | 11 | 346 | 545 |
| Aarhus | 8 | 62 | 5 | 127 | 1,324 |
| Whole country | 100 | 1,731 | 119 | 8,962 | 28,326 |
2.2.2 Status and development
Compared with 1989, the nitrogen discharges have been reduced by about 65%. Phosphorus discharges have been reduced by 90% and organic matter by about 80%. The objectives set in the Plan have thus been met.
2.3 Storm water outfalls
A large part of the rain falling on roofs, roads, and other paved areas ends up in the sewer system. Depending on the technical design of the sewer system involved, it is then passed either directly to the environment or to a sewage treatment plant, taking along part of any polluted matter met on the surface on its way. To reduce pollution from storm water outfalls, the sewer system may be provided with basins. Such basins will, depending on the technical design of the system, make it possible to store storm water, thus preventing overloading and allowing pollutants to settle. Finally, attempts may be made to remove from the sewer system as much rain-water as possible and instead let it percolate. This will have beneficial effects on ground water formation.
2.3.1 Sewer systems
The total sewered area of Denmark is 238,500 hectares and the total surfaced area is 71,700 hectares.
Combined sewerage
About half of the surfaced area is drained by combined sewerage, i.e. both surface and foul water is passed through the same pipes. Such systems may be overloaded by heavy rainfall, and through built-in "safety valves" in the form of overflow structures a mixture of untreated waste water and rain-water is discharged to the environment. In 1996, there were 5,260 overflow structures.
Separate sewerage systems
The other half of the surfaced area is separately sewered, i.e. rain-water and foul sewage are passed through separate piping systems and, consequently, waste water and rain-water are not mixed as in the jointly sewered areas. On the other hand, rain-water is not passed to sewage treatment plants in these areas. Nevertheless, separate sewerage is generally considered the best option for the environment. There were 8,911 separate outfalls in 1986.
2.3.2 Basis of calculations
Storm water overflow discharges are calculated in accordance with the instructions of the Danish EPA. Account is taken of the contributing area, rainfall intensity and duration and, in jointly seweraged catchments, the volume of water passed to the sewage treatment plant. To allow for annual rainfall variations, calculations are based on a "normal year". In this manner it is possible to see an effect, if any, of improvements of the sewerage systems. In 6 selected counties an intensive flow metering programme has been carried out in a number of surface water outfalls and overflow structures. The results of these meterings confirm the calculations for the jointly sewered areas.
2.3.3 Nutrient discharges
Discharges of water and nutrients from separate water outfalls and overflow structures are shown in Table 2.4.
Table 2.4
Discharge of water volumes, organic matter, and nutrients from separate outfalls and
overflow structures in a normal year (Danish EPA, 1997b)
| County | Tot-N |
Tot-P |
BOD5 |
tonnes |
|||
| Bornholm County | 4 | 1 | 9 |
| Frederiksborg County | 52 | 13 | 138 |
| Funen County | 77 | 20 | 192 |
| Copenhagen County | 62 | 15 | 175 |
| Copenhagen District | 70 | 19 | 170 |
| North Jutland County | 112 | 27 | 281 |
| Ribe County | 40 | 10 | 100 |
| Ringk�bing County | 53 | 13 | 148 |
| Roskilde County | 24 | 6 | 58 |
| Storstr�m County | 71 | 19 | 146 |
| South Jutland County | 55 | 15 | 148 |
| Vejle County | 55 | 14 | 146 |
| West Zealand County | 38 | 10 | 104 |
| Viborg County | 46 | 12 | 122 |
| Aarhus County | 86 | 22 | 233 |
| Whole country | 845 | 216 | 2174 |
2.3.4 Status and development
In 1996, the discharges of water, nitrogen, phosphorus, and organic matter were about 25% less than in a normal year. The reason for the drop was the low precipitation in 1996.
2.4 Sparsely populated areas
Sparsely populated areas include isolated houses or clusters of houses, villages, summer-house and allotment areas and other houses with waste water discharges comparable to domestic waste water. In other words, it typically refers to dwellings in the countryside.
The summation of the loading from sparsely populated areas is based on the counties’ reports on waste water loading by houses outside sewered areas. It is not based on meterings, but on the number of houses with a waste water loading of up to and including 30 PEs.
2.4.1 Nutrient discharges
Number of houses
The basis of the assessment is the number of houses in unsewered areas, which in 1996 amounted to 353,000. 118,700 of these were in summer-house and allotment areas and 234,800 in sparsely populated areas and villages.
The latter houses are the main contributors to the impact on the aquatic environment.
Purification methods
The purification methods registered (known or estimated) are distributed as follows: 52% of houses in sparsely populated areas had soakaways, 3% had cesspools and the remaining 45% had a purification method followed by discharge to surface water.
Uncertainty of figures
The data submitted are subject to a varying degree of uncertainty. About � of the returns are based on known number of houses and purification methods or known number of houses and a qualified estimate as regards purification methods. The remaining � are based on estimates only
Quantities discharged to surface water
The 1996 calculations show that 4,376 tonnes of organic matter (BOD5), 1,444 tonnes of nitrogen and 262 tonnes of phosphorus were discharged from sparsely populated areas to surface water. These discharges are shown by county in table 2.5.
Table 2.5
Discharges to surface water from sparsely populated areas in 1996. The totals are based on unrounded figures
| County | Tot-N |
Tot-P |
BOD5 |
tonnes |
|||
| Bornholm County | 19 | 4 | 73 |
| Frederiksborg County | 10 | 2 | 38 |
| Funen County | 180 | 41 | 687 |
| Copenhagen County | 4 | 1 | 16 |
| Copenhagen municip. | <1 | <1 | <1 |
| North Jutland County | 107 | 24 | 407 |
| Ribe County | 61 | 14 | 230 |
| Ringk�bing County | 79 | 18 | 305 |
| Roskilde County | 25 | 6 | 95 |
| Storstr�m County | 134 | 31 | 514 |
| South Jutland County | 111 | 25 | 422 |
| Vejle County | 101 | 23 | 386 |
| West Zealand County | 137 | 32 | 532 |
| Viborg County | 78 | 18 | 298 |
| Aarhus County | 97 | 23 | 373 |
| Whole country | 1,144 | 262 | 4,376 |
Discharges to the soil
As mentioned, a large proportion of waste water from unsewered housing is disposed of by percolation into the soil. The total quantities disposed of in this manner in 1996 was 1,658 tonnes of nitrogen, 377 tonnes of phosphorus, and 6,328 tonnes of organic matter (BOD5).
2.4.2 Status and development
No change has been established since 1995 as the figures for the two years are identical. Within individual counties, however, figures have altered as generally the assessment method has been improved.
2.5 Freshwater fish farming
There were a total of 456 fish farms in Denmark in 1996, all but one located in Jutland. In 1996, they consumed 31,500 tonnes of feed to produce 32,472 tonnes of fish, i.e. more than 1 kg of fish meat per kg of feed.
Nutrient discharges are regulated by the Statutory Order on freshwater fish farming (Ministry of the Environment and Energy, 1994). Requirements are laid down for, among other things, maximum feed consumption, feed quality, purification measures, and maximum permissible feed coefficient.
The impact by individual fish farms on the aquatic environment depends on many factors including scale of production, feed quality, and degree of utilisation as well as on the purification measures provided.
2.5.1 Nutrient discharges
Surveys of discharges of nutrients from freshwater fish farms have since 1989 been made using standardised methods based on feed consumption and production.
Total discharges in 1996 are estimated as 1,213 tonnes of nitrogen, 94 tonnes of phosphorus and 3,123 tonnes of organic matter expressed as BOD5. Table 2.6 shows these figures by county.
Table 2.6
Calculated nitrogen (Tot-N), phosphorus (Tot-P) and organic matter (BOD5) from freshwater fish farming in 1996
| County | Tot-N |
Tot-P |
BOD5 |
tonnes |
|||
| North Jutland | 162 | 11 | 397 |
| Ribe | 302 | 23 | 818 |
| Ringk�bing | 357 | 27 | 961 |
| South Jutland | 28 | 3 | 66 |
| Vejle | 162 | 13 | 422 |
| Viborg | 116 | 10 | 262 |
| Aarhus | 86 | 7 | 197 |
| Whole country | 1,213 | 94 | 3,123 |
2.5.2 Status and development
Total feed consumption in fish farms has been falling between 1989 and 1996, while production has been more or less constant. Thus, in 1989, 1 kg of fish was produced spending on average 1.25 kg of feed, whereas in 1996 less than 1 kg was needed.
Since the Statutory Order on fish farming came into force in 1989, discharges were reduced up to 1993, when they stabilised, leading to the conclusion that its effect has now been fully realised. As compared with 1995 feed consumption per kilo of fish produced has fallen by about 10%, which is the main reason why discharges of organic matter, nitrogen and phosphorus have fallen by about 12%.
2.6 Mariculture
Salt-water based fish farming in Denmark is concentrated on rearing of rainbow trout in marine or terrestrial salt-water fish farms. Marine fish farming is defined as "rearing system comprising netting cages, wire boxes or similar equipment placed in marine waters, and whose operation necessitates the use of feed". Terrestrial salt-water fish farming – also known as pumped supply installations – is defined as "rearing system on land using a salt-water intake, including cooling water from power stations and suchlike, and whose operation necessitates the use of feed".
2.6.1 Nutrient discharges
Feed consumption, size of production and losses of nitrogen and phosphorus to the marine environment are calculated on the basis of returns from the companies to the counties and the Environmental Protection Agency.
The specific discharge (discharge per tonne of fish produced) was for marine fish farms 44.1 kg of nitrogen, 4.7 kg of phosphorus and 256 kg of organic matter. For terrestrial salt-water fish farms the figures were 47.3 kg of nitrogen and 4.7 kg of phosphorus.
The calculated losses of nitrogen, phosphorus, and organic matter are shown in Table 2.7.
Table 2.7
Calculated losses of nitrogen (Tot-N), phosphorus (Tot-P) and organic matter (BOD5) from salt-water-based fish farms1 in 1996.
| County | Number |
Tot-N | Tot-P |
BOD5� |
tonnes |
||||
| Bornholm | 2 | 1 | ~0 | 1 |
| Funen | 1 | 6 | 1 | 33 |
| Ringk�bing | 8 | 34 | 3 | 37 |
| Storst�m | 7 | 72 | 8 | 402 |
| South Jutland | 6 | 52 | 6 | 83 |
| Vejle | 10 | 55 | 6 | 360 |
| West Zealand | 6 | 96 | 10 | 355 |
| Viborg | 2 | 3 | 1 | |
| Aarhus | 1 | 12 | 1 | 62 |
| Whole country | 43 | 332 | 35 | 1,332 |
1: Discharges from salt-water fish farms have only been calculated for terrestrial
ones. Those with purification systems have not been included.
2: Discharges of organic matter (BOD5) have only been calculated for salt-water fish
farms.
2.6.2 Status and development
The total losses of nutrients to the marine environment from salt-water fish farming in 1996 was about 332 tonnes of nitrogen, 35 tonnes of phosphorus and 1,332 tonnes of organic matter.
Compared with 1995, the nitrogen losses have dropped from 351 tonnes to 332 tonnes, and the phosphorus contribution has also dropped from 37 tonnes to 35 tonnes.
At the start of the Aquatic Environment Plan in 1989, 322 tonnes of nitrogen and 44 tonnes of phosphorus were lost to the marine waters. As far as nitrogen is concerned, the loss level is stable around 350 tonnes per year. The phosphorus loss has fallen since 1989 and is now stable at about 35 tonnes per year.
2.7 Offshore activities
Danish hydrocarbon production
The Danish sector of the North Sea produced a total of 7.25 billion normal m� of gas and 10.3 million tonnes of oil in 1996.
The output from a total of 11 fields comprised in 1996 just 5% of the total North Sea production. A total of 18 new horizontal or highly curved wells for production or water injection were completed in 1996 in connection with expansion of the Danish fields.
Emissions to water and air
Activities connected with prospecting, extraction, production, processing, and transportation of hydrocarbons lead to discharge of a number of ancillary substances and materials, partly to the sea and partly to the air. The operators report annually to the Danish EPA their estimates of the quantities involved in such activities.
2.7.1 Emissions to the atmosphere
Emissions to the atmosphere
The offshore industry’s emission of substances such as CO2, SO2, CH4, NOX, polyaromatic hydrocarbons (PAH) and volatile organic compounds (VOCs) to the atmosphere occurs in connection with flaring of surplus gas and oil from e.g. test operations and hydrocarbon production, and from using diesel oil and gas in connection with energy production on the platforms and drilling rigs.
Table 2.8
1996 emissions to the atmosphere from fixed installations
| Substance | Tonnes emitted |
| CO2 | 1.35 x10⁶ |
| CH4 | 1.88 x10³ |
| SO2 | 0.08 x10³ |
| NOX | 6.77 x10³ |
| VOC | 0.74 x10³ |
Table 2.8 shows the total emissions to the air from fixed installations in the Danish North Sea sector in 1996 for the above substances, with the exception of PAH compounds, for which no figures exist.
2.7.2 Emissions to the sea
The sources of discharges of oil to the sea from offshore activities are mainly production water, drilling, and spills.
2.7.3 Oil
Production water
Along with the production water (reservoir water) which is produced together with the hydrocarbons, a variable volume of oil is discharged every year. Water, gas, and oil are separated on the platforms in the water treatment plant with a view to achieving the minimum of oil content possible, with an absolute top limit of 40 mg/l before the production water is discharged to the sea.
Oil-based drilling mud
In situations where oil-based drilling mud (OBM) is used in drilling activities, oil attached to boring chips may be discharged to the sea. OBMs have not, however, been used in the Danish North Sea sector since 1991, thus reducing oil discharges significantly. Irrespective of type of mud used, a certain amount of oil from the reservoir is likely to be discharged along with the boring chips.
Spills
Finally, varying amounts of oil are discharged as spills. In 1996 the amount was in the order of 8.5 tonnes of oil.
Oil discharged with production water
Due to the growth in hydrocarbon production and the general ageing of the Danish oil and gas fields, the amount of production water has grown steadily over recent years. This tendency is expected to continue in future as production is planned to increase. The amount of oil discharged with production water may therefore also be likely to increase in the coming years. This means that the reductions in the total discharge achieved by avoiding the use of OBMs may be much reduced unless special steps are taken.
Figure 2.4 shows the trend in amounts of oil discharged from offshore activities between 1989 and 1996 split between source types. Oil from reservoirs discharged with boring chips is not included as up to now this has not been reported to the Danish EPA.
Figure 2.4
Oil discharged to sea between 1989 and 1996 from production water, drillings, and spills.
2.7.4 Contaminants
The offshore industry uses a broad spectrum of substances and materials (including a large number of chemicals) as ancillary materials for activities such as drillings, stimulations, maintenance of wells, separation of oil, gas, and water, and by handling and landing of hydrocarbons from the fields.
Substances and materials discharged to the sea
In 1996, a total of 76,031 tonnes of substances and materials were used in the Danish sector, of which 36,224 tonnes (47.6%) were estimated to be discharged directly to the sea. The remainder were disposed of by other means, i.e. by bringing it ashore or admixing chemicals to the oil which is removed via pipeline or vessels. In addition, a certain amount of the chemicals used remains in the reservoirs in connection with operations carried out. They may later be refluxed together with production water and discharged with it. The amount of refluxed chemicals discharged with production water is at present unknown
Heavy metals
Drilling mud containing impurities in the form of heavy metals and discharging of production water containing metals are the main sources of discharge of heavy metals to the sea from offshore activities. Metals discharged with production water originate partly from the reservoir and partly from impurities in the chemicals used.
Table 2.9
Heavy metals discharged to the sea from drilling in 1996
| Heavy metal | Discharge (kg) |
| Mercury | 25 |
| Cadmium | 22 |
| Zinc | 636 |
| Lead | 1,606 |
| Chromium | 126 |
| Nickel | 49 |
| Copper | 110 |
In 1996, the total discharges of mercury (Hg), cadmium (Cd), zinc (Zn), lead (Pb), chromium (Cr), nickel (Ni), and copper (Cu) from drillings are set out in Table 2.9. There are no figures available for heavy metals discharged with production water in the Danish North Sea sector.
2.7.5 Environmental regulation
Environmental regulation
Environmental regulation in the offshore industry will in the coming years occur by the issuing of general approvals/permits which will promote the use of cleaner technology, for example by requiring the development and/or testing of environmentally better equipment and chemicals. Regulation of the application and discharge of chemicals offshore is primarily based on the Oslo-Paris Commission Decision 96/3. This decision requires all North Sea countries, for a test period of three years, to "pre-screen" and "rank" all offshore chemicals for environmental hazards with the overruling aim of reducing to the maximum extent discharges of environmentally harmful substances to the sea from offshore activities.
[Front page] [Contents] [Previous] [Next] [Top] |