|
The Aquatic Environment in Denmark 1996-1997
3. Total discharges to freshwater and the sea in 1996
This chapter presents the most important key data for discharges to freshwater and the sea in 1996. Figure 3.1 shows the marine waters and their associated catchments for which discharges are calculated. The detailed figures cover only discharges of nitrogen, phosphorus, and organic matter.
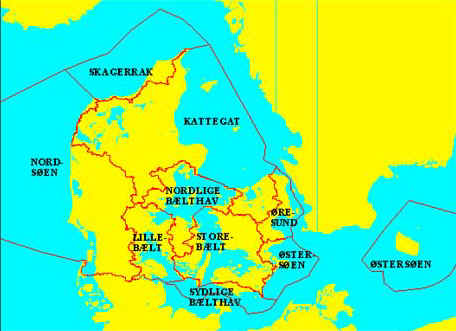
Figure 3.1
Map of first order sea areas and their associated catchments for which discharges are
calculated.
Discharges to the sea are reported to HELCOM (Kattegat, the Belt Seas, the Sound, and the Baltic) and OSPARCOM (the North Sea, Skagerrak and Kattegat).
3.1 Discharges to the freshwater areas
Point sources
The total discharges from point sources to freshwater areas are shown in Table 3.1, split up into the marine areas to which they drain. The relative significance of the individual point sources is discussed in chapter 6.
Table 3.1
Point source discharges of nitrogen (Tot-N), phosphorus (Tot-P), and organic matter (BOD5)
to the freshwaters in 1996
| Nitrogen | Sewage treatment plants |
Industry |
Storm water overflows |
Sparsely populated areas |
Fish farming |
Total |
| 1. North Sea | 643 | 32 | 76 | 194 | 716 | 1,661 |
| 2. Skagerrak | 118 | 0 | 9 | 16 | 7 | 150 |
| 3. Kattegat | 958 | 56 | 126 | 311 | 394 | 1,845 |
| 4. N. Belt Sea | 321 | 5 | 54 | 133 | 5 | 518 |
| 5. Little Belt | 234 | 1 | 43 | 156 | 90 | 524 |
| 6. Great Belt | 326 | 10 | 59 | 239 | 0 | 634 |
| 7. The Sound | 97 | 0 | 68 | 28 | 0 | 193 |
| 8. S. Belt Sea | 19 | 0 | 3 | 20 | 0 | 42 |
| 9. The Baltic | 47 | 0 | 5 | 43 | 0 | 95 |
| Whole country | 2,763 | 104 | 443 | 1,140 | 1,212 | 5,662 |
| Phosphorus | ||||||
| 1. Noth Sea | 78 | 2 | 19 | 44 | 55 | 198 |
| 2. Skagerrak | 9 | 0 | 2 | 4 | 1 | 16 |
| 3. Kattegat | 109 | 1 | 32 | 72 | 30 | 244 |
| 4. N. Belt Sea | 29 | 0 | 14 | 31 | 0 | 74 |
| 5. Little Belt | 24 | 0 | 11 | 35 | 7 | 77 |
| 6. Great Belt | 49 | 0 | 15 | 55 | 0 | 119 |
| 7. The Sound | 13 | 0 | 17 | 6 | 0 | 36 |
| 8. S. Belt Sea | 4 | 0 | 1 | 5 | 0 | 10 |
| 9. The Baltic | 9 | 0 | 1 | 10 | 0 | 20 |
| Whole country | 324 | 3 | 112 | 262 | 93 | 794 |
| BOD5 | ||||||
| 1. North Sea | 383 | 12 | 201 | 737 | 1,914 | 3,247 |
| 2. Skagerrak | 183 | 0 | 24 | 63 | 25 | 295 |
| 3. Kattegat | 552 | 36 | 337 | 1,195 | 950 | 3,070 |
| 4. N. Belt Sea | 160 | 0 | 134 | 514 | 9 | 817 |
| 5. Little Belt | 124 | 5 | 116 | 593 | 223 | 1,061 |
| 6. Great Belt | 276 | 5 | 152 | 913 | 0 | 1,346 |
| 7. The Sound | 61 | 0 | 155 | 108 | 0 | 324 |
| 8. S. Belt Sea | 24 | 0 | 7 | 77 | 0 | 108 |
| 9. The Baltic | 71 | 0 | 14 | 164 | 0 | 249 |
| Whole country | 1,834 | 58 | 1,140 | 4,364 | 3,121 | 10,517 |
Distribution by source
The relative significance of loading of watercourses by the different types of sources is shown on Figure 3.3. Open land is most important for nitrogen while phosphorus stems mainly from the various point sources.
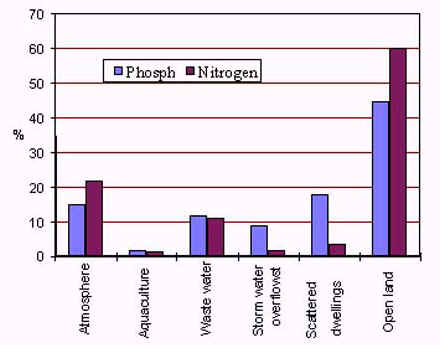
Figure 3.2
Percentage significance of loading of lakes by various sources (after Windolf, J. et al.,
1997)
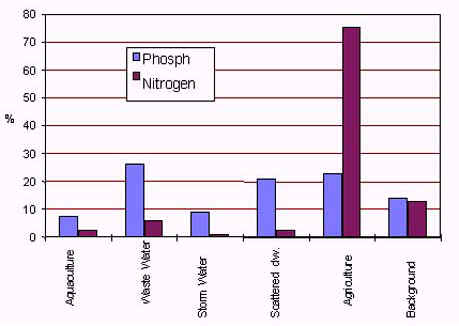
Figure 3.3
Percentage significance of loading of watercourses by various sources (after Windolf, J.
et al., 1997).
3.2 Marine discharges
Nutrients are discharged to Danish marine areas by direct waste water outfalls, via watercourses, and by atmospheric deposition. Large quantities of nutrients are also received from marine currents.
3.2.1 Direct discharges
Nutrient inputs to the individual Danish sea areas from direct discharge from sewage treatment plant outfalls, industrial discharges, storm water overflows, sparsely populated areas, and fish farms are shown in Table 3.2.
| Nitrogen | Treatment works |
Industry |
Storm water overflows |
Sparsely populated areas |
Fish farming |
Total |
| 1. North Sea | 93 | 206 | 7 | 0 | 35 | 341 |
| 2. Skagerrak | 11 | 97 | 1 | 0 | 2 | 111 |
| 3. Kattegat | 517 | 501 | 58 | 2 | 0 | 1,078 |
| 4. N. Belt Sea | 161 | 166 | 15 | 1 | 70 | 413 |
| 5. Little Belt | 324 | 38 | 13 | 0 | 76 | 451 |
| 6. Great Belt | 255 | 234 | 25 | 0 | 147 | 661 |
| 7. The Sound | 2,154 | 370 | 59 | 0 | 0 | 2,583 |
| 8. S. Belt Sea | 16 | 0 | 2 | 0 | 0 | 18 |
| 9. The Baltic | 93 | 13 | 5 | 0 | 1 | 112 |
| Whole country | 3,624 | 1,625 | 185 | 3 | 331 | 5,768 |
| Phosphorus | ||||||
| 1. North Sea | 13 | 10 | 2 | 0 | 3 | 28 |
| 2. Skagerrak | 3 | 11 | 0 | 0 | 1 | 15 |
| 3. Kattegat | 48 | 55 | 14 | 0 | 0 | 117 |
| 4. N. Belt Sea | 21 | 2 | 4 | 0 | 8 | 35 |
| 5. Little Belt | 46 | 6 | 3 | 0 | 8 | 63 |
| 6. Great Belt | 37 | 12 | 6 | 0 | 15 | 70 |
| 7. The Sound | 389 | 19 | 16 | 0 | 0 | 424 |
| 8. S. Belt Sea | 2 | 0 | 1 | 0 | 0 | 3 |
| 9. The Baltic | 21 | 2 | 1 | 0 | 0 | 24 |
| Whole country | 580 | 117 | 47 | 0 | 35 | 779 |
| BOD5 | ||||||
| 1. North Sea | 76 | 393 | 17 | 0 | 37 | 523 |
| 2. Skagerrak | 7 | 616 | 3 | 0 | 0 | 626 |
| 3. Kattegat | 400 | 2,188 | 49 | 7 | 0 | 2,744 |
| 4. N. Belt Sea | 103 | 29 | 44 | 5 | 441 | 622 |
| 5. Little Belt | 356 | 37 | 37 | 0 | 380 | 810 |
| 6. Great Belt | 315 | 4,229 | 62 | 0 | 622 | 5,228 |
| 7. The Sound | 1,753 | 1,139 | 141 | 1 | 0 | 3,034 |
| 8. S. Belt Sea | 13 | 0 | 5 | 0 | 0 | 18 |
| 9. The Baltic | 122 | 258 | 12 | 0 | 1 | 393 |
| Whole country | 3,145 | 8,889 | 470 | 13 | 1,481 | 13,998 |
3.2.2 Discharges via watercourses
Inputs of nutrients to the individual Danish sea areas from watercourses in 1996 are shown in Table 3.3.
Table 3.3
Input of nutrients from watercourses in 1996
| Sea body | Tot-N |
Tot-P |
BOD5 |
tonnes |
|||
| 1. North Sea | 11,866 | 273 | 3,533 |
| 2. Skagerrak | 1,590 | 54 | 873 |
| 3. Kattegat | 17,888 | 483 | 7,502 |
| 4. N. Belt Sea | 2,665 | 83 | 978 |
| 5. Little Belt | 3,625 | 117 | 1,194 |
| 6. Great Belt | 2,543 | 127 | 926 |
| 7. The Sopund | 582 | 36 | 323 |
| 8. S. Belt Sea | 271 | 11 | 98 |
| 9. The Baltic | 1,512 | 44 | 375 |
| Whole country | 42,542 | 1,228 | 15,802 |
Distribution by source
By deducting the known point source discharges to freshwater from the total discharges to the sea via watercourses, an impression can be gained of the magnitude of run-off from open land. Calculated in this way, discharges from open land amount to approx. 77,700 tonnes of nitrogen, 1,250 tonnes of phosphorus, and 17,900 tonnes of organic matter (BOD5). As during the passage through watercourses and lakes there is a certain retention and removal of inputs, these figures represent the minimum contribution.
3.2.3 Atmospheric deposition and emissions to the atmosphere
The aquatic environment does not only receive nutrients from discharges and losses from cultivated areas. A not insignificant input of nitrogen to the sea comes from the atmosphere, originating from both Danish and foreign sources. The magnitude of this deposition is based on measurements and model studies. The degree of uncertainty is assessed as about 40% in open sea areas and about 60% in fjords, coves, and bights. The uncertainty about phosphorus deposition is higher.
Nitrogen emissions
Nitrogen emissions to the atmosphere from Danish sources comprise oxides of nitrogen (NOX) and ammonia (NH3). The sources of NOX are power stations, industry and traffic, while ammonia comes from agriculture. These emissions of oxides of nitrogen tend to fall, due to flue gas cleansing at power stations and in industry, and catalytic converters in motor cars. About 80,000 tonnes of nitrogen in the form of NOX is emitted annually to the atmosphere from Danish sources. Ammonia emissions amount to approx. 105,000 tonnes of nitrogen and they have largely remained unchanged between 1989 and 1995.
Atmospheric nitrogen deposition
The total deposition of nutrients from the atmosphere to Danish waters is shown in Table 3.4.
Table 3.4
Total deposition of nutrients by sea area. Nitrogen quantities from (Ellermann et al.,
1997
Tot-N |
|
Tot-P |
|
| Sea area | tonnes |
||
| 1. North Sea | 48,400 | ||
| 2. Skagerrak | 9,300 | ||
| 3. Kattegat | 15,000 | ||
| 4. N. Belt Sea | 4,100 | ||
| 5. Little Belt | 2,800 | 2801 | |
| 6. Great Belt | 4,800 | ||
| 7. The Sound | 1,300 | ||
| 8. S. Belt Sea | 2,500 | ||
| 9. The Baltic | 13,500 |
|
|
| Total | 101,700 |
1: inner Danish waters (areas 3-8).
Distribution by source
For Danish waters as a whole, by far the greatest part of nitrogen deposition comes from foreign sources. Thus, only 16 % comes from Danish sources (Ellermann et al., 1997). In coastal areas, a higher proportion, up to 50%, may be of Danish origin.
70-80% is presumed to come from agriculture and the remainder from burning of fossil fuels (Ellermann et al., 1997), i.e. 76,000 tonnes come from farming, and 26,000 tonnes from industry, power stations, and traffic.
The deposition of phosphorus to inner Danish waters is estimated at about 8 kg./km�, equivalent to approx. 280 tonnes/year. This estimate is an upper limit of deposition. Based on this, the total phosphorus deposition to Danish sea areas can at most be 1,000 tonnes/year. A large part of the phosphorus presumably originates from biological sources.
3.2.4 Grand total of substances to first order waters
The total amounts of nutrients and organic matter input to Danish sea areas in 1995 are shown in Table 3.5.
Table 3.5
Total inputs of nutrients and organic matter to the sea from direct outfalls, watercourses
and the atmosphere in 1995, all figures in tonnes
| Nitrogen | Atmosphere |
Watercourses |
Direct point sources |
Total |
| 1. North Sa | 48,400 | 11,866 | 341 | 60,607 |
| 2. Skagerrak | 9,300 | 1,590 | 111 | 11,001 |
| 3. Kattegat | 15,000 | 17,888 | 1,078 | 33,966 |
| 4. N. Belt Sea | 4,100 | 2,665 | 413 | 7,178 |
| 5. Little Belt | 2,800 | 3,625 | 451 | 6,876 |
| 6. Great Belt | 4,800 | 2,543 | 661 | 8,004 |
| 7. The Sound | 1,300 | 582 | 2,583 | 4,465 |
| 8. S. Bekt Sea | 2,500 | 271 | 18 | 2,789 |
| 9. The Baltic | 13,500 | 1,512 | 112 | 15,124 |
| Whole country | 101,700 | 42,542 | 5,768 | 150,010 |
| Phosphorus | ||||
| 1. North Sea | 273 | 28 | 301 | |
| 2. Skagerrak | 54 | 15 | 69 | |
| 3. Kattegat | 483 | 117 | 600 | |
| 4. N. Belt | 83 | 35 | 118 | |
| 5. Little Belt | 2801 | 117 | 63 | 180 |
| 6. Great Belt | 127 | 70 | 197 | |
| 7. The Sound | 36 | 424 | 460 | |
| 8. S. Belt Sea | 11 | 3 | 14 | |
| 9. The Baltic | 44 | 24 | 68 | |
| Whole country | 1,228 | 779 | 2,007 | |
| BOD5 | ||||
| 1. North Sea | n/a | 3,533 | 523 | 4,056 |
| 2. Skagerrak | n/a | 873 | 626 | 1,499 |
| 3. Kattegat | n/a | 7,502 | 2,744 | 10,246 |
| 4. N. Belt Sea | n/a | 978 | 622 | 1,600 |
| 5. Little Belt | n/a | 1,194 | 810 | 2,004 |
| 6. Great Belt | n/a | 926 | 5,228 | 6,154 |
| 7. The Sound | n/a | 323 | 3,034 | 3,357 |
| 8. S. Belt Sea | n/a | 98 | 18 | 116 |
| 9. The Baltic | n/a | 375 | 393 | 768 |
| Whole country | n/a | 15,802 | 13,998 | 29,800 |
n/a: not available
1: inner Danish waters (areas 3-8). Atmospheric phosphorus deposition not included in the
total figure.
In 1996, 70% of the total land-based inputs came from cultivation losses from agriculture, 19 % from waste water discharged directly to watercourses and coastal areas, while the natural background inputs contributed about 11%. The significance of waste water outfalls was thus relatively high in 1996, because of the low run-off and therefore nitrogen run-off into watercourses too.
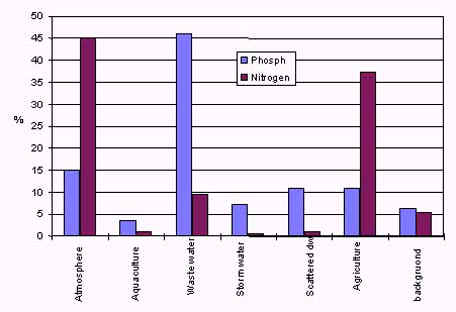
Figure 3.4
Percentage significance of loading on inner Danish waters from different sources.
Atmospheric deposition and agricultural inputs are the most significant sources of nitrogen. Phosphorus inputs arise especially from waste water.
Distribution by sectors
It is possible to make a rough estimate showing how inputs are distributed on various community sectors. Table 3.6 provides a survey of this.
Table 3.6
Percentage distribution by sectors of total inputs to Danish waters of nitrogen and
phosphorus
Nature, agriculture, forestry |
Industry, traffic, sewage |
|
% |
||
| Nitrogen | 75 |
25 |
| Phosphorus | 53 | 47 |
[Front page] [Contents] [Previous] [Next] [Top] |