[Front page] [Contents]
[Previous] [Next]
The Aquatic Environment in Denmark 1996-1997
4.
Watercourses and springsSprings, brooks and watercourses form a natural system for transporting surface water from land and draining ground water. They are also an important element of the Danish landscape, with varied and extensive plant and animal life.
This section has been prepared with the aim of giving a picture of the current environmental condition of the Danish watercourses in relation to their man-made and natural features. Documentation is provided via the results of the monitoring programme and the regional supervision programme.
4.1 Watercourses and springs in Denmark
The idealised watercourse
The very beginning of a watercourse is known as the spring, where ground water is drawn to the surface and runs on in the headwater. Springs often contain animal life (fauna) specially adapted to the constant temperatures which characterise springs.
From the spring and immediately downstream, the water input rises due to surface water run-off and the watercourse becomes a brook. Great gradients, stone beds and shallow depths are some of the characteristics of the appearance of a watercourse. The gravel in a brook is often covered by a thin layer of invertebrates and plants which help to clean the water running over it. Gravel is therefore important in a watercourse, forming a built-in purification system. Brooks function as spawning and nursery areas for salmonoids, and many species of invertebrates inhabit their gravel beds.
Further down the watercourse system, more and more water is added from the catchment area, making the watercourse bigger and slower running than in the brook. Now it is called a watercourse, which is home to large trout. Further down, the idealised watercourse becomes a river, which has slow currents and greater depth. Rivers are typically unsuited as habitat for trout and are dominated instead by cyprinoids such as bream and roach. There are also particular species of invertebrates associated with the lower reaches of a watercourse system.
63,500 km watercourses in Denmark
There are approx. 63,500 km of watercourses in Denmark (Windolf et al., 1997). Most are small watercourses less than 2.5m wide (Table 4.1)
Table 4.1
Km of watercourses by width in Denmark (Windolf et al., 1997)
| Width of watercourses (m) | Watercourses (km) |
| Less than 2.5 | 48,000 |
| 2.5-8 | 14,000 |
| Over 8 | 1,500 |
| Total | 63,500 |
Classification of watercourses
Watercourses are classed under the Watercourse Act as private, local authority or county watercourses, respectively.
The classification of the individual watercourses determines who is the watercourse authority. The district council is the authority for private and local authority watercourses and the county council for county watercourses. The watercourse authorities lay down guidelines for administration of watercourses including the maintenance of each public watercourse. Private watercourses are maintained by the riparian owners.
Most small watercourses are private
In principle, the small watercourses are private, the slightly larger ones local authority watercourses and the biggest in Denmark are county watercourses. Thus the length of private watercourses is presumed to be about twice that of public watercourses, because most are small.
4.1.1 Watercourse quality
Today most watercourses are far from the idealised state as described. Watercourses have been utilised for many centuries, in farming and in other ways, improved drainage being a prerequisite for being able to cultivate the fields. When the meadows and lowlands began to be cultivated, it became necessary to straighten, to install piping and to deepen watercourses and to subject them to heavy-handed clearance in order to speed up the drainage. They also came to be used to remove unpurified waste water from industries and towns.
The prerequisite of a good environment in the watercourses were thus eliminated, there being no clean water or enough of it, nor any physical variation with diverse habitats for plants and animals.
Clean water
The cleanliness of water in watercourses depends primarily on: organic or oxygen-consuming matter, nutrients, contaminants, ochre etc.
Organic matter arrives in watercourses e.g. from municipal sewage treatment plants, sparsely populated areas, fish farms, and industries. The problem of organic matter in watercourses is that oxygen is consumed in its decomposition, so organic matter can be harmful to the watercourse quality.
Nutrients such as nitrogen and phosphorus mainly leach to watercourses from cultivated areas and various waste water outfalls. Nitrogen and phosphorus do not influence the environmental conditions in watercourses to any significant extent, but may have negative effects in high concentrations in the lakes and the sea receiving discharges from them.
Pesticides and heavy metals are examples of contaminants which can enter the aquatic environment. Pesticides originate mainly from agriculture, while the sources of heavy metals have not yet been fully elucidated.
Adequate flows
Many watercourses have too low flows, some are even drying out in summer, thereby degrading the environmental conditions. This occurs naturally in some watercourses, but in others it is a result of human activity such as water catchment for drinking or industrial use.
Good physical conditions
By physical conditions is meant what can be seen in the watercourse, i.e. its shape.
Watercourses should have a varied form with bends, deep and shallow sections, and beds changing between stone, gravel, and mud.
They should be free of obstructions which hinder the free movement of water fauna up and down the watercourse.
Straightening and heavy-handed maintenance have ruined the physical conditions in many watercourses and turned them into straight, uniform canals.
4.1.2 Legislation
The three aspects of watercourses, water quality, physical conditions, and flow are protected by several acts. The most important of these are outlined below.
The Environmental Protection Act
This ensures clean water for the watercourses by prohibiting the discharge of polluting substances to watercourses, lakes or the sea. The authorities may, however consent to the discharge of waste water.
The Watercourse Act
The "new" 1982 Watercourse Act protects the physical conditions of watercourses. The protection is based on the introductory paragraph stipulating that when utilising watercourses the various environmental as well as commercial interests involved are to be considered.
For example, a watercourse must not be regulated, i.e. its line, levels or dimensions altered without the consent of the relevant watercourse authority.
Regulations
Regulations have to be prepared for all public watercourses to form the legal basis of their administration. They lay down rules on the shape and maintenance of the watercourses, clearance of areas along them, operation of weirs, fencing, and discharge of drainage waste and waste water outfalls etc.
The Nature Protection Act
The Nature Protection Act also protects the physical conditions by prohibiting alterations to protected watercourses or parts of them that have been classified as protected watercourses. Ordinary maintenance is excepted.
The Water Supply Act
The Water Supplies Act ensures that surface or ground water catchment may not occur without the consent of the authorities. Environmental and nature protection, including preservation of the quality of the surroundings, is to be a focal point in this connection.
Moreover, draining-off of ground water or lowering of the water table for building and construction work and extraction of clay, gravel, lignite, chalk etc. may not take place without consent.
The Ochre Act
The Ochre Act protects the water in the watercourses by requiring that agricultural ditching and drainage within the mapped areas of ochre potential be approved in advance by the County Council.
Other acts and regulations
Watercourses are also covered by other legislation such as the EU Bird Sanctuary and Ramsar sites regulations, which aim at protecting types of habitat and wetlands etc., and the Planning Act which requires regional plans to include objectives for the quality and utilisation of watercourses.
4.1.3 Objectives
The County Councils’ regional plans are required by the Planning Act to include guidelines for the quality and utilisation of watercourses in relation to an overall assessment of their development. That is, objectives are set for the quality and use of each watercourse, based on biological conditions, existing outfalls and the desired future usage, which then form the basis of the counties’ administration of the individual watercourses. The "Guidelines for recipient quality planning" No. 1, 1983, published by the Danish EPA describes the objective setting system to be followed by the counties. Table 4.2 shows the types of objectives used.
Table 4.2
Outline of watercourse objectives (Danish EPA, 1983)
| Objective | Description | |
| A | Special scientific interest | Watercourses where special natural features are to be protected |
| B1 | Salmonoid spawning and nursery areas | Watercourses which are to be suitable as spawning and nursery areas for trout and other salmonoids |
| B2 | Salmonoid waters | Watercourses which are to be suitable as growth area and habitat for trout and other salmonoids |
| B3 | Cyprinoid waters | Watercourses which are to be suitable as growth area and habitat for eels, perch, pike and other cyprinoids |
| C | Watercourses used only to convey water | |
| D | Watercourses affected by waste water | |
| E | Watercourses affected by ground water catchment | |
| F | Watercourses affected by ochre |
Quality requirements to the setting of objectives
In the setting of each objective, the counties lay down quality objectives to be met. Some water quality objectives are laid down in accordance with the requirements of the EU Fishing Water Directive of 1978 and appear from the above-mentioned guidelines of the Danish EPA. It is also a requirement that waste water outfalls, water catchment, water flow, alterations of the physical conditions of the watercourse, maintenance, etc. are acceptable only as long as they do not hinder the meeting of the objectives set.
In principle, this means that A-targeted watercourses shall be free from the effects of any human activity. B-targeted watercourses may only be mildly affected, whereas C, D, E and F indicate a certain degrees of human influence on these watercourses.
Assessment of compliance with objectives
To assess the extent of compliance of a watercourse with its target, a parameter is selected which is easy to quantify and which can be used as an indicator of the environmental conditions of the watercourse. The counties’ regional supervision uses various methods for biological assessment, based in principle on the same fauna classification (fauna class) I-IV. Fauna class I denotes an unpolluted and IV a heavily polluted watercourse.
In A-targeted watercourses, fauna class requirements are set for each watercourse depending on the state to be maintained. Generally, the fauna classification shall be II or better in fishing-targeted waters (B1, B2 and B3). Fauna class II-III can only be accepted in a few cases of canals or river-like watercourses without falls. The fauna class must not be poorer than II-III in waters affected by water catchment or waste water discharge and used to convey water.
4.2 Water balance and freshwater run-off
The water cycle is the most important factor for transporting nutrients etc. from land to the sea. Precipitation containing nutrients etc. ends up in watercourses, lakes, and ground water. Annual fluctuations in precipitation are therefore reflected in variations in the biological, physical, and chemical conditions in the aquatic environment.
Man-made effects on the hydrological cycle
Man-made effects on the hydrological cycle take the form of water catchment, drainage, watercourse straightening, etc. The most significant factor is water catchment of drinking water and for commercial use. In Jutland, 5% of the total watercourse flow volume is recovered compared with 11% in the islands (Windolf et al., 1997). Flows in watercourses are affected by water catchment and the geology of their catchment areas and can therefore vary greatly. Some are especially strongly influenced by low flows as a result of water catchment around large towns. Kristensen and Rasmussen (1997) thus reveal that the median minimum flows in watercourses draining to K�ge Bight have been reduced by 50-90% as a result of water recovery.
Drainage, watercourse straightening and surfaced areas cause water to enter watercourses quicker, leading to large fluctuations in flows in the watercourses with increased watercourse erosion.
Low precipitation in 1996
As stated in Chapter 1, 1996 was the driest year in the period monitored. As a yardstick for the low precipitation, the hydrological year of 1995/96 was the driest in Funen in this century with precipitation 48% below normal (Wiberg-Larsen et al., 1997).
The driest and wettest years in the monitoring period
The precipitation distribution in the period 1989-1996 has in general not differed from the norm (Windolf et al., 1997). There was on average 25 mm less than normal during that time, with an annual average of 712 mm. All the same, there were large variations, with two very dry years in 1989 and 1996 and the wettest year ever in 1994.
However, variations within the years did not differ significantly from normal conditions, with most precipitation in the third and fourth quarters.
Low run-off in 1996
There was also record low run-off in 1996 (Table 4.3). Many watercourses dried out or were directly threatened by drying out in the summer of 1996. 25% of the whole watercourse length in Funen dried out (Wiberg-Larsen et al., 1997).
The average run-off in the monitoring period 1989-1996 was lower than normal and also featured extreme conditions with very high run-off in 1994 and very little in 1996.
Water balance in 1996
The difference between precipitation and run-off is called the water balance, which is an overall measure of evaporation and percolation into the ground. In 1996, it was 100 mm, which is one third of the normal level and the lowest in the whole monitoring period. Ground water reserves thus shrank in 1996.
Evaporation
Variations in evaporation affect flows in watercourses. Put simply, low evaporation results in more water for the watercourses. Human activity such as drainage and lowering the water-table combined with a 3-4% reduction in hours of sunshine mean that evaporation in Denmark has fallen by 6% since the 1920s.
Table 4.3
Average annual values of precipitation, freshwater run-off and potential water balance in
1989-96. Average values for 1989-96 and normal values for 1961-90 are also given
(rewritten from Windolf et al., 1997).
| Period | Water balance | Precipitation | Run-off |
|
| (mm) | (mm) | (mm) | 106m3 | |
| 1989 | 142 | 581 | 252 | 10,800 |
| -90 | 433 | 812 | 327 | 14,000 |
| -91 | 239 | 654 | 296 | 12,700 |
| ‘92 | 244 | 706 | 294 | 12,600 |
| ‘93 | 354 | 758 | 325 | 14,000 |
| ‘94 | 487 | 880 | 455 | 19,600 |
| ‘95 | 212 | 652 | 363 | 15,600 |
| ‘96 | 100 | 505 | 190 | 8,200 |
| 1989 - 96 | 276 | 693 | 313 | 13,400 |
1961 - 90 |
300 | 712 | 327 | 14,000 |
4.3 Water quality in watercourses and springs
Nitrogen and phosphorus are the most important nutrients for plant growth in the
aquatic environment. Elevated concentrations of nitrogen and phosphorus in watercourses
may have negative influences on the remote environment of lakes, coastal areas and the
sea, while having less effect on the watercourses because the staying time is so short
that watercourse plants have not got time to consume them before the outflow. This is also
the case in watercourses in catchment areas in the open land, where concentrations of
nutrients are low. However, it has been established that high concentrations of phosphorus
may contribute to increased growth of filamentous algae in watercourses.
Nutrient run-off is monitored in the monitoring programme by water quality measurements in
approx. 260 watercourses and 58 springs to elucidate the occurrence, transportation, and
sources of loading.
Nutrient sources
Nutrients are input to watercourses from a number of natural and man-made sources, which may generally be divided into the main headings of point and diffuse sources as defined below:
Point sources:
| Municipal sewage treatment plants | |
| Individual industrial discharges | |
| Storm water overflows | |
| Fish farms | |
| Waste water from sparsely populated areas |
Diffuse sources:
| Natural background loads | |
| Waste water from sparsely populated areas (also considered a point source) | |
| Effects of human activity in cultivated areas | |
| Others, precipitation, particle deposition, etc. |
4.3.1 Phosphorus
The significance of the individual sources for the total phosphorus transported by watercourses varies greatly.
Significance of point sources for phosphorus in watercourses
There are geographical variations in the significance of point sources for total phosphorus transported by watercourses depending on both natural and man-made circumstances. They are highly significant in densely populated areas compared with the rest of the country because of major waste water outfalls. In wet years, such as 1994, their contribution to total phosphorus transport was less in relation to diffuse sources due to subsequently large phosphorus-bearing run-offs from the open countryside.
Diffuse losses are the major source of phosphorus
Diffuse losses are today generally the major source of phosphorus inputs to watercourses, although these vary very much depending on both natural and man-made circumstances. Inputs of phosphorus from agriculture in both wet and normal years contribute over half the total of diffuse losses. In comparison, waste water from sparsely populated areas make up 25% of the phosphorus contribution (Windolf et al., 1997). Agricultural inputs are thus significant. If the loss of total phosphorus from cultivated catchment areas in clayey and sandy soils is considered separately, the input, in terms of flow-weighted concentrations and catchment area losses, was highest in watercourses in clayey soil in 1996. This can be ascribed to surface water run-off and drainage water. The loss of phosphorus can be related to the agricultural usage of the land, in that the loads rise significantly with increasing proportions of cultivated land in the watercourse catchment areas.
Bank erosion liberates particle-bound phosphorus to the watercourse in significant quantities. One study shows that erosion over two years contributed 30% and 14%, respectively, of the total phosphorus transported by a watercourse. For this reason, it is important to enforce the two metre border as an uncultivated area and apply environmentally friendly maintenance to the watercourse to ensure bank stability (Rebsdorf et al., 1994).
Phosphorus load in 1996
The phosphorus concentrations in Danish watercourses are still high, typically more than 0.1 mg/l. In July 1996 catchment area losses measured both as concentration in water and as catchment area loss of phosphorus were lowest in watercourses with natural catchment areas, 3-4 times higher in cultivated areas and 6-8 times higher in catchment areas including waste water sources (Figure 4.1). Phosphorus loads in watercourses which mainly drain surfaced areas were similar to those found in watercourse with catchment areas loaded by waste water.
Besides, the concentrations of total phosphorus were significantly higher in Zealand than in watercourses in Funen and Jutland, which was ascribed to higher point source loads with lower dilution in Zealand. The point sources were the major source of phosphorus in 1996 in Zealand. In Funen and Jutland, diffuse sources were predominant.
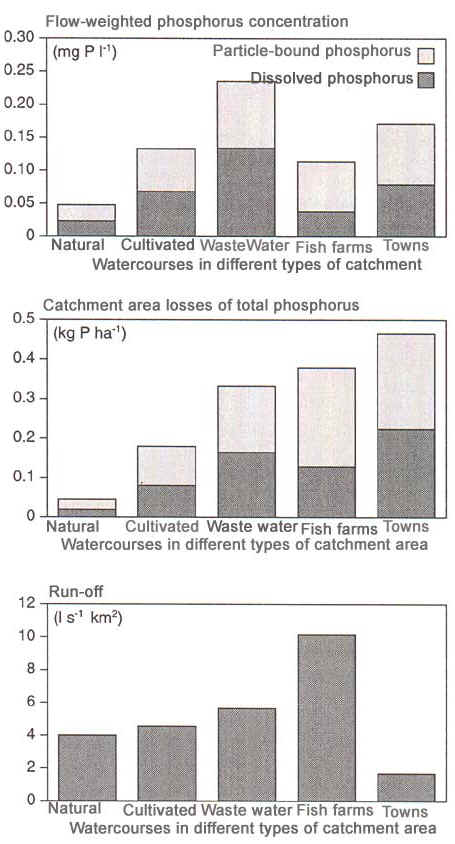
Figure 4.1
Average flow-weighted concentration of catchment area losses of total and dissolved
phosphorus and run-off to watercourses in five different types of catchment areas in 1996
(Windolf et al., 1997)
Reduced phosphorus concentration in watercourses
A general fall in the total phosphorus concentration in watercourses has been confirmed both 10 years before and 8 years after the introduction of the monitoring programme of the Aquatic Environment Plan in 1989. Data from 36 watercourses collected via the counties’ regional supervision show a mean fall in the concentration of total phosphorus of 16% in the period 1978-88, which is, however, only statistically certain in half of the watercourses.
From the coming into force of the Aquatic Environment Plan in 1987 till today a fall in phosphorus concentration of 31% has been established in catchment areas affected by waste water and of 10% in cultivated catchment areas, where phosphorus inputs from cultivated land typically constitute more than half of the total diffuse phosphorus loss. The development of phosphorus losses to watercourses from diffuse and point sources are shown in Figures 4.2 and 4.3, respectively.
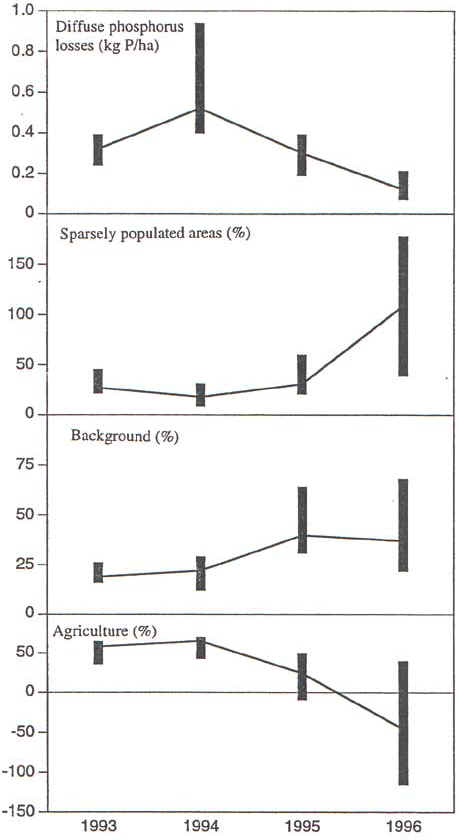
Figure 4.2
Development of annual diffuse phosphorus loss and significance of inputs from
agricultural, sparsely populated and uncultivated areas. The figure shows median values
– the fully drawn line – and the 25% and 75% quartiles (Windolf et al., 1997).

Figure 4.3
Development of phosphorus input from point sources to watercourses loaded by waste
water. The figure shows the median value as a fully drawn line with 90% and 10%
percentiles (Windolf et al., 1997).
A small total increase in the phosphorus concentration of 7% has, however, been noted in watercourses in natural catchment areas between 1989 and 1996, which may be attributed to natural occurrences and/or man-made disturbances in the catchment areas such as tree-felling, traffic along watercourses, etc.
The general fall is only statistically certain in some of the watercourses examined, so the figures should be treated with some caution. Monitoring over the next few years should give a more precise picture of this positive development.
Fall greatest in Zealand
There are geographical differences in the development of total phosphorus concentrations in watercourses. Up to 1988, the greatest falls were mainly in small and large watercourses in Jutland and Funen. This development did not take hold in Zealand until in 1989-96, the fall being 50% and 19% higher than in Funen and Jutland, respectively (Windolf et al., 1997). The fall was also three times greater in clayey areas than in sandy ones.
Reasons for reduced phosphorus before and after the Aquatic Environment Plan
Reduced phosphorus inputs to many watercourses during 1978-88 were due mainly to improved waste water purification in municipal sewage treatment plants. Considering small and large watercourses separately, it turns out that the fall in large watercourses is due in fact to improved waste water purification in the sewage treatment plants of the towns and reduced industrial and fish farm inputs. Improved purification requirements for organic matter, diversion of waste water from smaller communities to larger sewage treatment plants and reduced household phosphorus outfalls are the main reason for phosphorus reductions in smaller watercourses over the same period.
The reasons for the results of the Aquatic Environment Plan in respect of phosphorus reduction in watercourses may be found in conditions such as improved storage of liquid manure, firm stable manure and silage (watercourses in agricultural areas), reduced use of phosphate-containing washing and cleaning products (sparsely populated areas) and improved waste water treatment (point source areas).
The reduction in phosphorus loading of watercourses from agricultural areas has not been as marked as in watercourses in the other types of catchment areas subject to human activity, presumably as a result of continuing country-wide phosphorus surpluses in cultivated areas. An effort is therefore required to reduce phosphorus-containing discharges from cultivated areas.
Phosphorus concentrations still too high
In spite of the reductions noted over about 20 years, the phosphorus concentrations in watercourses are still over 100 mg/l in most Danish watercourses, which is regarded as a high level of phosphorus in watercourses.
4.3.2 Nitrogen
There is great variation in the significance of different sources of total nitrogen transported by watercourses.
Cultivated areas are the major source on nitrogen input
The principal diffuse source of nitrogen inputs to watercourses is cultivated areas. This applies to both normal and wet years. Cultivated areas typically contribute over 80% of the diffuse nitrogen inputs to watercourses from catchment areas compared with about 6% from point sources in normal and wet years. Nitrogen is leached from the root zone in cultivated areas and transported via drains, upper and lower aquifers with more or less delay. More nitrogen is typically leached from clayey than from sandy soils, because the run-off is quicker and more direct from clayey soil. Inputs from diffuse sources therefore vary from year to year depending on the amount of water percolating through the soil, and thus the total amount of precipitation.
Point sources are less significant to nitrogen inputs
Input of nitrogen from point sources is less significant to the total loading of surface water by nitrogen than the loading from cultivated areas. In normal and wet years, where there is substantial nitrogen leaching from soil, the input from point sources is typically less than 6% of the nitrogen transported by small and large watercourses (Windolf et al., 1997). Even in watercourses affected by waste water outfalls, the waste water contribution comprises only a small percentage of the Tot-Nitrogen concentration. In a dry year such as 1996, however, their relative significance increases due to the lower inputs from diffuse sources as a result of lower percolation through the soil. There are also geographical differences: in densely populated areas such as Zealand, point sources are more significant than in the rest of the country.
Nitrogen run-off from nitrogen leaching
The mean annual concentration or the catchment area loss of total nitrogen in 1996 was significantly higher in watercourses draining catchment areas affected by agriculture, waste water or fish farms than those serving natural catchment areas (Figure 4.4).
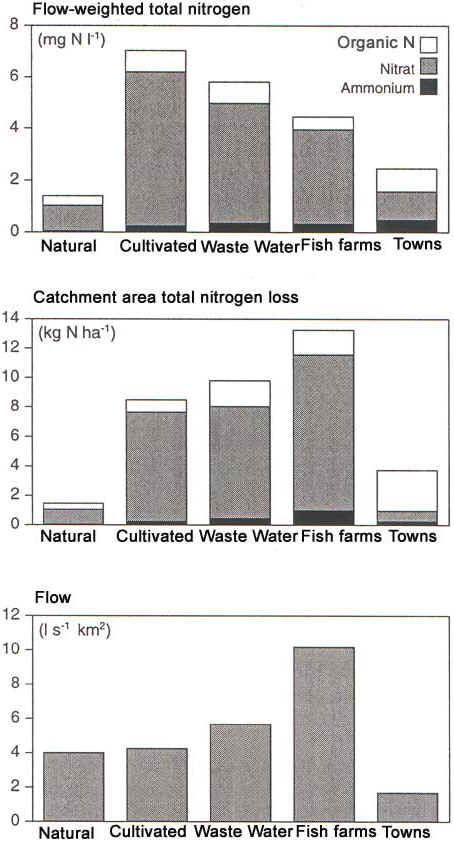
Figure 4.4
1996 average of flow-weighted concentration and catchment area loss of total nitrogen
split up in ammonium, nitrate and organic nitrogen and water run-off in five different
types of catchment areas (Windolf et al., 1997).
The total nitrogen expressed as flow-weighted concentration was slightly higher in agricultural catchment areas than in watercourses in the other three human-affected types of catchment area in 1996. This applies to the whole monitoring period. On the other hand, the loss of nitrogen measured as kg/ha of catchment area was lower in the cultivated catchment areas than in watercourses affected by waste water or fish farms. The latter was only registered in 1996 due to the extremely low precipitation and correspondingly low leaching from cultivated areas.
The highest total nitrogen concentrations were measured in 1996 in East Jutland and the islands and in a belt south of Limfjorden from the North Sea to Kattegat, where there are large livestock holdings today.
Nitrogen inputs from paved areas, for example in large towns, make up a very small part of the total input.
Small reduction in nitrogen loading of watercourses
There is a clear tendency for the flow-weighted total concentration of total nitrogen in watercourses to have fallen over the last four years as compared with the average before the Aquatic Environment Plan. Treating type of catchment area separately, the concentration of total nitrogen in watercourses fell from 1989 to 1996 by 3% in natural catchment areas, by 9% in cultivated areas, by 18% in catchment areas affected by waste water and by 7% in those affected by fish farming. It should be pointed out that overall there is not a statistically reliable fall in total nitrogen concentrations in the Danish watercourses due to large variations in the development of nitrogen concentrations in the various watercourses studied. The development of nitrogen loading from diffuse and point sources is shown in Figures 4.5 and 4.6, respectively.
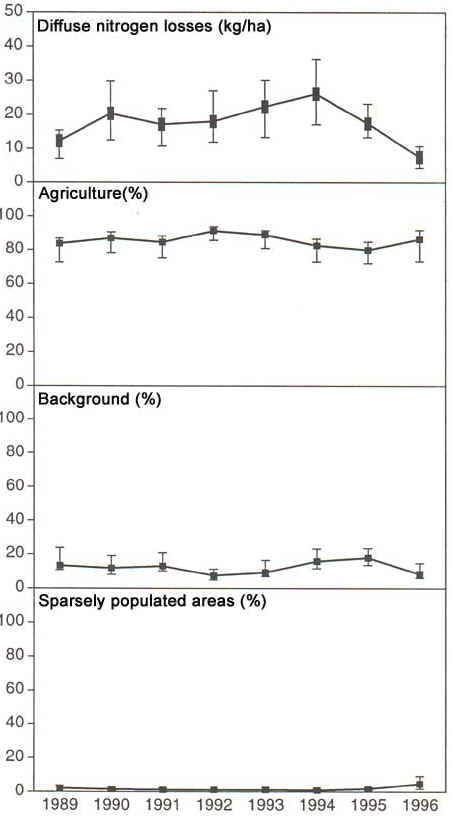
Figure 4.5
Development of annual diffuse nitrogen loss and significance of inputs from agricultural,
sparsely populated and uncultivated areas. The figure shows the median values as a full
line together with 25% and 75% quartiles (Windolf et al., 1997).

Figure 4.6
Development of annual point source nitrogen inputs to watercourses affected by waste
water. The figure shows the median values as a full line together with 10% and 90%
percentiles (Windolf et al., 1997)
The reduction in nitrogen concentration in watercourses in agricultural areas can be explained by a fall in leaching of nitrogen or by particular climatic conditions in the past couple of years.
A wet year in 1994 and a very dry one in 1996 can be one of the main reasons. For example, during the very dry 1996 with very little nutrient leaching there has presumably been a large accumulation of nitrogen in cultivated soil which will run off to watercourses in connection with any subsequent high precipitation, resulting in a flow-weighted corrected rise in nitrogen concentration. The rise in level of transportation of nitrogen in watercourses in cultivated catchment areas in 1996/97 already indicates that climatic conditions may be the reason for the fall during the preceding years. Analyses over the next few years will presumably elucidate this point better than has been possible to date.
The large reduction in total nitrogen concentrations in watercourses affected by waste water outfalls reflects investments made in improved waste water treatment.
A combination of modified agricultural practice in certain areas and re-establishing of water meadows, where large amounts of nitrogen may be converted, should be considered in future with a view to further nitrogen reductions.
4.3.3 Organic matter
Organic matter occurs naturally in watercourses, e.g. as dead plants and animals, but readily degradable organic matter also enters watercourses via waste water. When organic matter decays, oxygen is consumed, the quantity of the oxygen consumed being expressed as BOD5 (biological oxygen demand over 5 days). When waste water containing organic matter enters a watercourse, oxygen consumption increases, which may have negative effects on animal life in the watercourse. The invertebrates that can only live in clean, oxygen-rich water disappear, and are replaced by the few species which are able to survive under polluted conditions.
Reduced inputs of oxygen-consuming substances
Waste water from sewage treatment plants was the most significant point source of organic matter in freshwater in 1996 and comprised 49% of the total point source inputs (Table 4.4). Point sources only provided about 20-25% of the volumes discharged in the mid-80s (Windolf et al., 1997).
Table 4.4
Inputs of organic matter (BOD5) to freshwater from waste water by source
| Source | BOD5 (tonnes) |
% of total |
| Sewage Treatment plants | 2,763 | 49 |
| Industry | 104 | 2 |
| Storm water run-off | 443 | 8 |
| Sparsely populated areas | 1,140 | 20 |
| Fish farming | 1,212 | 21 |
In this context the BOD5 content in major watercourses has dropped significantly (Figure 4.7) to a level where benefits from further reductions as a result of additional waste water purification are minimal. For example, in major watercourses in Funen BOD5 has been reduced by 94% since 1987 (Wiberg-Larsen et al., 1997). The expansion, including centralisation, of waste water purification plants is the explanation of the reduced discharges of oxygen-consuming substances found in outfalls, especially to major watercourses.
Small watercourses affected by sparsely populated areas
Small watercourses, on the other hand, are still subject to problems caused by inputs
of oxygen-consuming substances from sparsely populated areas, as a result of which many
small watercourses are still in a too badly polluted condition. 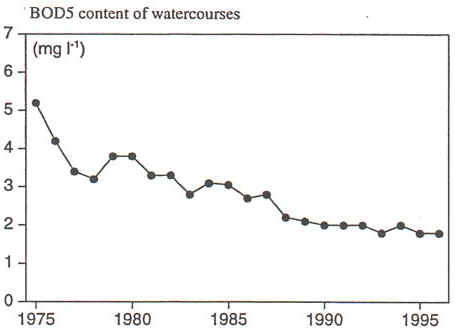
Figure 4.7
Development of BOD5 content in major Danish watercourses (Windolf et al., 1997)
4.3.4 Heavy metals and contaminants
Occurrence of heavy metals
A range of heavy metals and contaminants are used to such an extent that there is a potential risk that they will end up in the aquatic environment. Agricultural practices can also alter the leaching and acidification processes in soils, allowing pre-existing heavy metals to be more easily released. There has, however, been no systematic nation-wide study to date of the occurrence of heavy metals and contaminants in Danish watercourses.
A few studies have shown that there are local problems with increased heavy metal concentrations in Denmark.
Fish farming sludge
A study of the heavy metal content in sludge from 22 fish farms undertaken in 1992-1993
in Ringk�bing County showed cadmium and nickel levels in many samples to be too high for
spreading on farmland, whereas lead and mercury caused no problems (Ringk�bing County,
1993).
Further studies are needed to establish whether the heavy metals come from the fish
feed or the surrounding environment.
Ochre purification systems
Another study of mud and sediment samples drawn in and near 31 ochre purification systems in water courses showed the cadmium threshold values to be exceeded at 10 sites.
The study showed that concentrations can be affected by catchment area, soil conditions and possibly lime admixture to the system (Jensen & Nielsen, 1996).
Waterweeds
Heavy metals are also found in weeds in watercourses in quantities exceeding the permissible threshold values for spreading on farmland. Viborg County, which annually collects about 2,000 m� of weed sap from watercourse maintenance, analysed the juice for heavy metals in 1996 and found that the weeds could not be used on farmland due to excessive mercury content.
Cadmium in weeds and mercury in the weed sap are presumably concentrated during storage for subsequent spreading on farmland.
Current studies
The Ministry of Food, Agriculture and Fisheries and the Danish EPA have instituted studies to find the sources of and reasons for these high heavy metal levels in and around watercourses.
Waste water loading
It has been established that waste water outfalls to freshwater areas from sewage treatment plants, industrial plants and sparsely populated areas contain varying amounts of heavy metals and contaminants. The retention and/or conversion of most substances by sewage treatment plants is generally very high and the inputs are small in relation to the potential amounts (Danish EPA, 1994).
There is no overall measuring programme for the input of heavy metals and contaminants in industrial waste water, but it was estimated in 1994 that a significant reduction of the total input has occurred since the mid-80s, including the input to freshwater areas (Danish EPA, 1994).
Similarly, there is no overall programme for sparsely populated areas. In 1994, the Danish EPA, however, produced a small survey indicating input of heavy metals (Danish EPA, 1994). Purification of waste water from sparsely populated areas, in conjunction with product regulations, is expected to reduce the loading significantly.
Loading by surface water run-off from paved areas
It has turned out that surface water run-off from paved areas such as roads may contain significant amounts of heavy metals and contaminants. Lead, zinc and copper and PAH-compounds were found in one study in concentrations comparable with those in untreated sewage. Concentrations of lead, chromium, copper and zinc exceeded quality limits for freshwater areas (Kj�lholt et al., 1997). The study also showed that particulate matter in the run-off contained much higher concentrations than the run-off itself. For this reason, it cannot be ruled out that run-off from roads may have detrimental effects on the aquatic environment, especially long-term effects on benthic organisms caused when contaminated particulate matter settles in a restricted area.
Pesticides
Pesticides differ from other contaminants in that they are intentionally toxic to flora and fauna and are deliberately spread in the environment. Irresponsible use leading to pollution of watercourses and lakes can therefore be expected to be very harmful to the aquatic environment. Several counties have in recent years found pesticides and their break-down products in selected watercourses, and a co-ordinated study was launched in the autumn of 1996 with the aim of achieving an overview of the extent of the problem.
In 1994-96 the Funen County studied six watercourses in mixed catchment areas, farmland and forest areas. The watercourses were tested for 99 different pesticides, of which 30 were detected in one or more watercourses (Wiberg-Larsen et al., 1997). In 1995, four springs were also tested for 88 pesticides, of which two and traces of a third pesticide were found in two of the springs (Wiberg-Larsen et al., 1997).
Ringk�bing County studied twelve watercourses in farmland, towns and natural areas in 1996. The watercourses were tested for 28 different pesticides, of which 22 were detected in one or more watercourses. Remnants of pesticides were found in all 12 watercourses (Ringk�bing County, 1997a).
The Copenhagen County found pesticides in 12 out of 28 watercourse locations studied. The watercourses were tested for 24 pesticides, of which four were detected in one or more watercourses (Nielsen, 1997a).
Sources of pesticide loading
Ringk�bing County detected pesticides after extended drought, when the flows consisted almost entirely of seeping-out of ground water. As wind drift was not a likely explanation at the time, this may indicate that pesticides also find their way into watercourses via upper aquifers and/or drains.
Effects of pesticides in watercourses
No actual studies have been undertaken of the environmental effects of pesticides in the aquatic environment, but as they have been detected in concentrations known to be harmful to flora and fauna, they are likely to be environmentally damaging. Funen County has estimated that the invertebrate fauna in watercourses has been affected to such an extent that in 20% of the cases this is the main reason for failure to meet objectives in the county’s small watercourses (Wiberg-Larsen et al., 1997).
4.3.5 Ochre pollution Ochre pollution
Pyrite
Many low-lying soils contain the mineral pyrite (a compound of iron and sulphur), which is stable in water-saturated soil. When pyrite is oxidised, the iron is liberated as water-soluble ferrous iron. This leads to a risk of pollution of watercourses by iron-bearing water.
Dissolved iron
Dissolved iron (ferrous iron) is harmful to aquatic fauna in very low concentrations, i.e. from 0.2 mg/l, whereas ochre particles washed into the watercourse affect its physical condition by ochrous slime on stones, gravel, watercourse beds, and plants destroy the habitats of benthic algae and microfauna.
Ochre
Ochre can also form a layer over gravel spawning beds, where it kills fish eggs or causes malformations in those larvae that do hatch under ochrous conditions.
Oxidation
Oxidation of pyrite is highest in summer, when the water table is low. Iron concentrations in watercourses are highest in autumn and winter (November-April) when the run-off is greatest.
Extent of ochre pollution
Ochre pollution is highest in the area west of the Jutland ridge, where the soil contains large amounts of pyrites and is also very low in lime (CaCO3), etc.
There are some 300,000 ha of potentially ochrous soil in Jutland, about 10% of the total area (see Table 4.5) (Andersen, 1993b).
Table 4.5
Potentially ochrous areas in Jutland
| County | Potentially ochrous area (ha) |
| North Jutland | 79,000 |
| Viborg | 40,400 |
| Ringk�bing | 59,900 |
| Vejle | 9,478 |
| Ribe | 30,080 |
| South Jutland | 45,452 |
| Aarhus | 32,200 |
The area of watercourses inside or downstream of the mapped potentially ochrous areas was assessed in 1986 to comprise approx. 28% of the total Danish watercourse area. Ochre pollution is worst in Ribe, Ringk�bing, and the South Jutland counties.
Legislation
The Ochre Act aims at preventing and combating ochre nuisances connected with agricultural ditching and drain-laying activities. Among other things, it stipulates that drainage within the prescribed ochre potential areas may only take place with the approval of the county councils.
Administrative practice to date
When the Ochre Act was passed in 1985 it was anticipated that drainage activities would cover about 1,000 ha p.a., and that as a rule approval would be granted (about 65% of cases), with only exceptional refusals (10-15%). In practice, the Act has turned out to be less restrictive than expected, with 79% of applications approved and only 8% refused (Andersen (ed.), 1993b).
Revision of mapping
It was decided in connection with the passing of the Act to redefine the designated potentially ochrous areas at a later date, and in 1992-93 about 12,000 ha were proposed to be removed from and a further 9,500 ha added to the mapping. In reality, this adjustment would bring in several areas of agricultural interest (Andersen, 1996a). At the present time no significant administrative benefits are connected with adjusting of the mapping (Andersen, 1993b).
Financial consequences of the Act for agriculture
The financial consequences of the Act to the agricultural sector have been minimal, as the Danish EPA has paid all costs of setting up ochre purification plants and paid equity compensation corresponding to the loss of value of the land affected where drainage has been prohibited.
In the period 1985-96, this compensation has been paid at an average level of DKK 4,225/ha. If the average compensation is capitalised over a 15-year period, this corresponds to a marginal return of DKK 460/ha compared with the DKK 300/ha annual additional income resulting from drainage of problematical potentially ochrous land (Andersen & Christensen, 1996).
Subsidy to ochre projects
The Danish EPA has set aside DKK 4.3m each year since 1990 to combat ochre pollution
and the main part of its support of more than DKK 28m is dedicated to watercourse
improvements and studies (Figure 4.8) (Andersen, 1996b).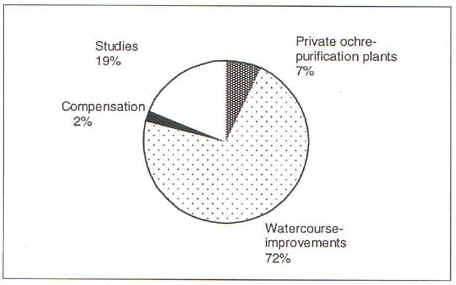
Figure 4.8
Percentage distribution of support under the Ochre Act January 1, 1990 to December 31,
1996.
Watercourse improvements
Since the passing of the Ochre Act, the Danish EPA has contributed to the financing of 35 projects and a study of the biological effects at 20 purification plants shows that downstream conditions have improved. The Hoager Brook plant, for example, removed 39 tonnes of iron from the Brook in 1994 and is now relieving the downstream water areas of this loading which, apart from impairing life in the watercourses, has also made them unsightly (Nielsen, 1997b). Most plants have a positive effect locally or some distance downstream, and it is important to see the plants as a purification measure for the whole water system, not just locally.
Private ochre purification systems
The costs of setting up and running private ochre purification systems are relatively high, for example a lime precipitation plant costs DKK 40,000/ha or more with annual operational costs of about DKK 18,000/ha (Andersen, 1993a), while the removal efficiency is generally low (Christensen, 1997). These costs should be compared with the expected additional income of about DKK 300/ha as a result of draining potentially ochrous land.
Perspectives
The Ochre Act has had the effect that in the designated areas ochre pollution has stabilised or fallen slightly, whereas many ochre-polluted watercourses have been found outside these areas. The reason for the limited effect is that the Act only regulates new agricultural drainage whereas many watercourses are subject to pollution from earlier drainage and regulation projects.
In those watercourses where pollution is a result of heavy-handed and/or illegal maintenance, it can be significantly reduced simply by compliance with maintenance regulations, as raising the water table will reduce ochre leaching.
The Danish EPA support scheme has improved the water quality in the watercourses already loaded by ochre. This development seems to continue as the counties and the local authorities in Jutland with westward-flowing watercourses are providing increased resources for ochre reduction.
When the Aquatic Environment Plan and the Waste Water Purification Act have had an effect in the open land, ochre pollution will be the only reason for many watercourses failing to meet their objectives.
4.3.6 Acidification
Sulphur dioxide and various nitrogen compounds are released when oil and gas are burnt. The different SOX and NOX compounds are oxidised in the atmosphere, forming sulphuric and nitric acids. These acidify the precipitation, leading to the risk that watercourses and lakes become acidified in certain locations. Between the onset of industrialisation and the present day, the pH, which is a measure of the acidity of water, has fallen from about 7 (neutral) to around 4.5 (acid) (Sand-Jensen & Lindegaard, 1996). The problem in Denmark is not of the same order as in Norway or Sweden, as the soil in many parts contains lime which can neutralise acid precipitation, acting as a buffer system.
In Central and West Jutland, which contains moraines of sand and gravel low in lime, acidification may arise in watercourses in certain places, leading to impoverished plant and animal life in them.
4.4 Physical conditions
Needs for increased agricultural output in earlier times meant that areas near watercourses, which formed extensive meadows and grasslands, were turned over to arable land with crop rotation. As these crops cannot stand flooding, the need for effective drainage rose sharply. To meet this need, it was necessary to straighten, to install piping and to deepen about 98% of Danish watercourses (Kern-Hansen, 1987) and to maintain them heavy-handedly, whether or not they met regulatory appearance requirements. Nothing was allowed to remain in the watercourses which might impede flows. On top of this, many watercourses came to be utilised over the years for fish farming, turbine and mill power which caused problems in terms of obstructions, water quality and water catchment. Combinations of these were disastrous to the watercourses. They became uniform canals transporting nutrients, sand and water as quickly as possible to the sea, with no shelter or habitats for normal aquatic plant and animal life, which often disappeared as a result.
During the 70s and 80s attitudes towards the exploitation of nature changed. Now human activity had to be adapted to suit nature. This changed attitude also led to the passing of the present Watercourse Act of 1982, which takes account of both drainage and the environment in watercourses. It required the authorities to recreate good natural conditions in watercourses, including more environmentally friendly maintenance schemes, restoration by removal of obstructions and replacement of gravel beds, etc. Progress on improving physical conditions is slow, but the environmental effects of the many steps taken are beginning to show.
4.4.1 Maintenance practice
The main aim of maintenance was previously to ensure effective drainage. Plant growth on banks and in the watercourses was cut back and the bed and sides were mechanically regraded, usually beyond permitted limits, leaving no room for nature. The present Watercourse Act has put a stop to such heavy-handed maintenance, requiring account to be taken also of environmental quality objectives. Watercourses are to be brought to a physical state meeting the objectives of the regional plans. This has made it possible to introduce more environmentally friendly operational practices.
Environmentally friendly maintenance
The principle of environmentally friendly maintenance is to limit weed cutting to a meandering channel, leaving alternate weed areas along the banks for the benefit of aquatic fauna. Bank and side-slope cutting is limited to the absolutely necessary minimum, and bed digging-up is only to be undertaken when needed. Counties and local authorities have developed and improved environmentally friendly methods since the passing of the Act and can now choose from a variety of schemes depending on the objectives and current or intended forms of the watercourses.
Development towards use of gentle maintenance methods by counties
Schemes have often been changed to be gentler as a result of the new regulations. This
has brought about the result that, where about 50% of county watercourses were
heavy-handedly maintained in 1985, about the same percentage are now managed in an
environmentally friendly manner and only 7% harshly (Figure 4.9). In many counties,
maintenance is adapted to the objectives set for each watercourse, i.e. it is carried out
more gently the higher the target (Baatrup-Pedersen, 1997).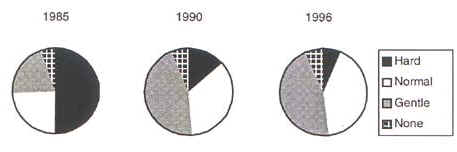
Figure 4.9
Distribution of application of various maintenance methods in county watercourses
from 1985 to 1996 (Baatrup-Pedersen, 1997).
Local authorities lagging behind
Unfortunately it has also turned out that a number of local authorities have not made as much progress, in spite of their being the land drainage authorities for about 75% of the high-target watercourses (Danish EPA, 1995d). In Funen, for example, gentle maintenance practices are used on less than 24% of the local authority watercourse lengths (Figure 4.10).
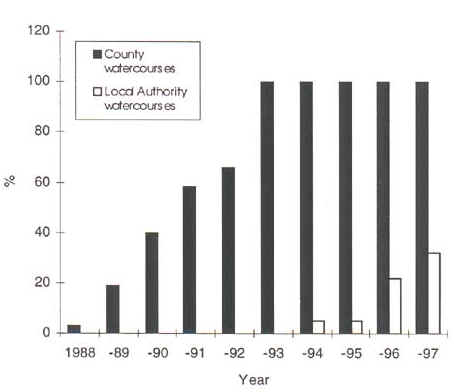
Figure 4.10
Extent of maintenance in accordance with the new regulations in county and local authority
watercourses in Funen (Wiberg-Larsen et al., 1997).
Watercourse regulations
In connection with the passing of the Watercourse Act it was decided that all watercourse regulations should be reviewed. One aim of this review was to ensure that they were brought into line with the plans for the individual watercourses. Counties and local authorities have received more than DKK 90m to revise these regulations.
Time schedule
The deadline for preparation of new watercourse regulations was initially set at January 1, 1993, but on request by the National Association of Local Authorities in Denmark it was extended to July 1, 1996.
As a result of a question from the Parliamentary Environmental and Planning Committee in the spring of 1997, it became clear that not all local authorities and counties have completed the revision of their regulations.
Environmentally friendly maintenance does not impair flow capacity
The many experiments with gentle weed-cutting in the form of flow channels and cutting as needed have shown that the required capacity can be maintained in summer even when weeds remain in the watercourse. Over the whole summer, the water surface is generally lower than previously, when weeds were cut once or twice a year (Cueto, 1997).
Experiments since 1982 in Surb�k in South Jutland County have shown that cutting weeds in a narrow channel, leaving them along the edges, does not significantly affect the drainage capacity and over recent years the maintenance has shrunk to the removal of sporadic clumps of weeds when requested by riparian owners. Over the whole experimental period, the summer water level has become more constant and stabilised at a lower level.
A study of the flow in 8 watercourses where, according to riparian owners, the capacity is insufficient compared with before, has shown that the flow capacity of 4 is the same or greater than under the previous scheme, 1 has a slightly lower flow capacity (though this was due to an adjustment to the actual conditions), and in the remaining 3 the flow capacity is in all probability as great or greater after the new regulations (Cueto, 1997).
The new maintenance methods can thus meet both capacity and environmental needs.
Development of new maintenance methods
The aim for the next few years must be to collect and expand knowledge about environmentally friendly maintenance so that the state of watercourses may continue to be improved with more varied conditions. Weed clearance must be suited to the parameters which specifically affect the capacity and environment of each watercourse in relation to the utilisation of the surrounding landscape. Efforts must also be made to apply sensitive schemes to a greater extent than at present in both local authority and private watercourses so that conditions here can also meet the requirements applying to small watercourses, which are often salmonoid spawning and nursery areas.
4.4.2 Watercourse reinstatements
The Watercourse Act of 1982 allowed the authorities to improve the physical conditions by various reinstatement measures. Conditions may for example be improved by laying stone and gravel to form spawning and nursery areas, restore bends in straightened watercourses, remove obstructions caused by fish farming, mills and generators, and reopen piped lengths etc.
Passage in watercourses
One of the major problems in watercourses is obstructions in the form of dams, dead lengths, piped lengths and irrigation systems, which destroy the continuity of the watercourses and hence their important functions as links between other areas. In 1993, there were 380 dams causing obstruction problems from fish farming alone, and a further 30 as a result of hydro-electric plants. In addition there are a large number of obstructions by irrigation plants and dams with ineffective fish stairs. In Vejle County alone, there are about 200 obstructions in high-target watercourses where no fauna passages have yet been created (Vejle County, 1997).
New classification system for registering of reinstatements
To achieve a nation-wide picture of restoration work, a system of classifying and registering the different reinstatement models in Denmark was developed in 1995. Restorations are split into three main types according to their location in the watercourse. Type 1 covers restoration of single lengths. Type 2 includes all measures which create passages between lengths to ensure the continuity of watercourses, and Type 3 those which improve conditions in valleys. Table 4.6 shows the principles of the three types with examples of methods for each type.
Table 4.6
Number of projects completed in counties by the three main restoration types
| Type 1 | Type 2 | Type 3 |
| Habitats | Passage | Valleys |
| Gravel banks | Rapids at obstructions | Raised water levels with rapids |
| Sand traps | Evening out small steps | Raised water levels with bend restoration |
| Stone | Fish ladders | Drains cut off at foot of brink |
| Reopening piped lengths | Bypasses at obstructions | Narrowing of channel |
| Bend restoration | Reopening piped lengths | |
| Hides for fish and invertebrates | ||
| 181 projects | 740 projects | 15 projects |
Current situation of reinstatement work
Most watercourse authorities have been engaged in reinstatement work to improve the physical conditions in watercourses for some time, but only in recent years has it really taken off. Nation-wide, the counties have completed a total of 936 restoration projects up to and including 1996. Most of these, i.e. 740 projects, have been aimed at creating passages for fish and invertebrates between lengths of watercourses (Table 4.6, Type 2).
Jutland leads in restoration work
Most watercourse restorations have taken place in Jutland (Figure 4.11). Zealand has lagged behind with only 11% of projects, in spite of having 22% of the watercourses, many with poor environmental conditions. More and more local authorities have also started, which is important because they are the authorities for a large number of high-targeted watercourses which include salmonoid spawning and nursery areas.

Figure 4.11
Distribution of the number of completed restoration projects in major watercourses up to
1996 (Windolf et al., 1997) and km of watercourses in the three regions (Danish EPA,
1995).
Restoration of whole valleys
In recent years, there has been a trend towards restoration measures addressing whole valleys (Table 4.7), i.e. where, for example, bends are reinstated and areas near the watercourses are restored to water meadows in contact with the watercourses. Up to and including 1996, 15 of these Type 3 projects have been recorded (Table 4.6). The Nature Reinstatement Project in Brede Watercourse, which included bend restoration, is a good example. A large part of the National Forest and Nature Agency’s nature protection resources are devoted to total solutions in valleys (National Forest and Nature Agency, 1997), among other things.
Table 4.7
Distribution and development of the Danish EPA support for restoration projects
1984-1995 (Moth & Andersen, 1996)
Number of projects |
Trend |
|
| Fish ladders | 39 | � |
| Spawning grounds | 17 | � |
| Rapids | 86 | � |
| Bypass rapids | 15 | � |
| Reopening of piped lengths | 6 | � |
| Bend restoration | 26 | � |
| Other | 43 | � |
� 37a of the Watercourse Act on dead lengths
Great environmental improvement is expected when flows are returned to 13.5 km of dead lengths resulting from fish farming, and when passages are restored to a whole 126 km of high-targeted watercourses upstream of them (Table 4.8). This will be the result of the Danish EPA’s provision of DKK 10m of support since the start of 1996 to 43 restorations at obstructions with so-called dead lengths (� 37a of the Watercourse Act). As 4,000 km of high-target watercourses upstream of fish farming obstructions still exist, there is yet a long way to go from the achievements of 1996-97 to the target of creating adequate passages at all obstructions.
Table 4.8
Dead lengths in km restored to flowing and free passage to upstream lengths by projects supported by the Danish EPA under �37a in 1996-97
| Year | Number of projects |
Dead lengths (km) |
Free passage |
| 1996 | 22 | 9.5 | 166 |
| 1997 | 21 | 4.0 | 260 |
| Total | 43 | 13.5 | 426 |
Resources for restoration
The Danish EPA has supported watercourse restorations since 1984, providing about DKK 33m up to 1996 to a total of 252 restoration projects around the country costing in all about DKK 88m.
4.4.3 Water flow
Many watercourses dried out in 1996
Many watercourses have problems with drying out or reduced flows as a result of utilisation of surface and ground water resources for drinking, irrigation etc., or where most of the flow stems from surface or near-surface run-off. Many dried out in 1996 due to low precipitation in the first half of the year. As many as 25% of the watercourse stations studied in Funen dried out, while the run-off was 59% of normal with disastrous results for the fauna in the watercourses. The very rare stone loach died out in Hellerup Watercourse in Funen as a result of drying out (Wiberg-Larsen et al., 1997).
Changes in water flow affect the ecology of watercourses as the sizes of accessible and useable habitats for fauna are affected (Lund, 1997), resulting in changed species compositions. A study in Roskilde County has shown, among other things, that reduced flow in Elverdam Watercourse reduced the number of habitats for older trout and thus the number of fish (Lund, 1997). The invertebrate fauna in dried-out watercourses has been reduced so much that it has not been possible to determine the fauna class.
As it is not sustainable for so many watercourses to dry out in summer, presumably as a result of water catchment and low precipitation, there is a need to take steps to ensure adequate all-year flows. Included in this must be positioning of boreholes at a suitable distance from watercourses and adjusting water catchment to suit conditions in them.
4.4.4 Interplay between watercourses and areas near watercourses
A watercourse should preferably be in balance with its surroundings, i.e. low-lying areas nearby, which in simple terms form an important part of its own purification system. In heavy flows, especially in winter, water floods in the adjacent meadows, transporting nutrients such as nitrogen and phosphorus, sediment and organic matter to them, where it is naturally deposited when the water retreats. Hereby, nutrients such as nitrogen and phosphorus, but also organic matter are retained and converted in areas near the watercourse instead of being washed out to sea.
High consumption of nitrogen in areas near watercourses
Deposited nitrogen can be converted in areas near watercourses, provided they are wet. There are many examples of this. Studies show that nitrogen removal varies from about 50-99% of the amounts deposited on areas near watercourses (Hoffmann, 1996).
Phosphorus retention in areas near watercourses
The retention and conversion of phosphorus in areas near watercourses is a complex process depending in part on soil conditions and the phosphorous compounds concerned, making it hard to give a clear picture (Rebsdorf et al., 1994). Broadly put, dry mineral soils such as fields and commons bind phosphorus better than saturated areas such as water meadows, and therefore the retention of phosphorus by these areas is probably substantially less than the retention of nitrogen.
Areas near watercourses serve an important natural function as a kind of buffer for flows in the watercourses. Meadows retain surplus flows in winter, which can run off later when there is again spare capacity in the watercourses. Large variations in flow are avoided and erosion of beds and banks reduced.
Areas near watercourses have settled
Areas near watercourses have been drained and dewatered for several centuries, resulting in settling of the soils near the watercourses containing high levels of organic matter. Settlement means that organic matter has been oxidised and mineralised, reducing the volume of the soil and causing the surface to sink. The soil then becomes waterlogged and loses its value for cultivation. A study in Viborg County has shown that in many places settlement has reduced the depth of dewatering to the same levels as immediately before the latest regulation and drainage (Christensen et al., 1997). In the areas studied, as much as 54% had been subject to settlement, and in about 46% of these areas settlement has been of the order of 30-150 mm. Areas of high settlement adjoined all the watercourses studied.
The study shows that the benefits of the last watercourse regulations are about to be lost in large parts of the areas affected.
The heavy investments in dewatering and drainage appear to be written off over a period of 30-60 years, meaning that farmers must take account of the fact that the improved drainage conditions resulting from the great regulating and draining projects of the first half of this century have been wholly or partly lost. As this trend continues, conditions will deteriorate further and it is doubtful whether it will make private or socio-economic commercial sense to make new great investments in watercourse regulating or re-drainage projects of such large areas (Cueto, 1997). It is thus not so much a question of restoring water meadows as of when they will re-establish themselves.
The future of valleys
A future solution for areas near watercourses could be that agricultural practice returns to being more extensive, i.e. that they become what they were originally, viz. meadows with permanent grass. Such a solution would save public money and bring many environmental and landscape benefits.
4.4.5 Borders along watercourses
Uncultivated borders along watercourses are of great importance to the environmental conditions of watercourses, particularly the physical conditions. Such a strip with natural vegetation stabilises the banks, protecting them from collapse, etc. This minimises the number of environmentally damaging clear-ups needed as well as reducing the input of phosphorus, soil and sand. Sand can, for example, settle on stone and gravel spawning beds, reducing the ability of fish to reproduce. Phosphorus input as a result of bank erosion may be significant. Thus it has been established that bank erosion in a watercourse in two consecutive years caused 30% and 14%, respectively, of the total quantity of phosphorus transported by the watercourse (Rebsdorf et al., 1994).
A vegetated border will also reduce the transfer of phosphorus, soil and sand to the watercourse by surface run-off from adjacent soil. A study in Vejle County showed that a 2 m border retained 98% of suspended soil, over 95% of the Tot-Phosphorus and over 93% of the total nitrogen in surface water flows to the border (Nielsen, 1995).
Compliance with the 2 m border
The requirement for a 2 m border came into force on July 1, 1992, and as the Danish EPA is aware that such borders are not maintained along many watercourses, this was one of the themes of the 1996 Supervision Report.
Local authority feedback
A review of feedback from the local authorities reveals that the data quality is sub-standard. One local authority has, for example, stated that only 110 km of watercourse are covered by the border requirement, even though it earlier stated that the district contained 148 km of high-targeted watercourses as at January 1, 1993 (Danish EPA, 1995).
The Danish EPA will therefore require a number of local authorities to account for this difference. When this has been resolved, it will be possible to make an overall assessment of the length of watercourses covered by the border requirement.
Enforcement of the 2 m border
The Danish EPA is aware of 59 cases of failure to comply between 1993 and 1996. The riparian owner accepted a fine in 30 cases, and in 23 the courts have imposed fines, given two warnings and acquitted three landowners.
4.5 Environmental conditions in watercourses – status and development
The environmental conditions in watercourses are determined by a number of natural and man-made factors. Topography, subsoil and size of watercourses are examples of natural factors. Alterations, waste water and toxic inputs of man-made ones.
In recent years efforts have been made to minimise man-made effects, e.g. by improving physical conditions and expanding waste water treatment. Flora and fauna often react rapidly when their living conditions are improved. Trends in biological state can thus indirectly provide a picture of the effect of the many improvements made.
4.5.1 Invertebrates
The composition of invertebrates, i.e. insects, snails, worms, etc. in a given length of watercourse reflects its current environmental condition, including whether it is loaded with organic matter, as these creatures have species-specific requirements in respect of a number of physical and chemical conditions. The number and diversity are generally greater in clean water and least in polluted watercourses. Their composition is a good environmental indicator.
Methods of assessment
A method called the Danish Fauna Index is used for biological assessment of watercourses, which classifies them according to fauna classes (degrees of pollution) I to IV. Fauna class I indicates an unpolluted watercourse and IV a heavily polluted one.
In the regional supervision of watercourse environmental quality, the counties use methods similar to this to determine the composition of invertebrates. This regional monitoring provides the major part of the information available (Windolf et al., 1997).
Environmental state of watercourses in 1996
Watercourse stations with acceptable environmental states, i.e. fauna classes I, I-II and II together comprised 39% of the assessments in the 1996 monitoring programme (Figure 4.12). Polluted watercourses classed II-III made up 50%. 11% were class III or worse in 1996.
By comparison, acceptable fauna classes, i.e. I, I-II, and II, were registered in 34% of the watercourse assessments in the regional supervision in 1996 (Figure 4.12). In the regional supervision fauna class II-III was also the most frequent one and was found in 39% of the watercourse stations. 9% of the stations were heavily polluted, i.e. fauna class IV. It was not possible to make a fauna classification at as many as 18% of the stations in 1996, since the invertebrate fauna was miserable due to drying out, ochre, pesticides etc. The non-assessable stations are not included in the calculation of percentage distribution of fauna classes.
Reasons for differences between national and regional supervision
The use of different assessment methods, frequency and sampling strategy as well as the fact that monitoring stations are generally placed in larger watercourses are presumably the reasons for the differences in data between national and regional monitoring results. Work is in progress to standardise environmental supervision of watercourses in order to reduce variations in data due to choice of methodology in future.
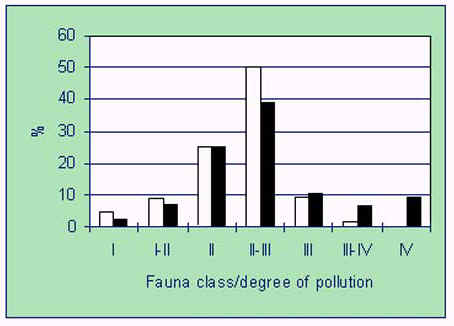
Figure 4.12
Distribution of fauna classes in 1996 from national (white) and regional (black)
supervision (Windolf et al., 1997; the Danish EPA, 1997a).
Most watercourses in Jutland and Funen are in a good condition
Clean watercourses of fauna class II or better were found at 44% of stations west of the Great Belt studied in the 1996 regional supervision (Table 4.9). On Zealand and Lolland-Falster only 10% of the stations reached fauna class II or better. The wholly unaffected fauna class I stations are also more common in Jutland and Funen than in Zealand and Lolland-Falster.
Table 4.9
Distribution of fauna classes by county from the regional supervision (Danish EPA, 1997a).
| County | Fauna class | Not determined |
|||||
| I | ] | II | II-III | III-IV | IV | ||
| Copenh. mun. | 0 | 0 | 1 | 4 | 3 | 0 | |
| Copenhagen | 0 | 0 | 13 | 22 | 5 | 1 | |
| Frederiksborg | 1 | 15 | 226 | 23 | 13 | 63 | |
| Roskilde | 1 | 2 | 70 | 21 | 8 | 5 | |
| West Zealand | 0 | 82 | 129 | 12 | 11 | 111 | |
| Storstr�m | 6 | 38 | 247 | 114 | 379 | 71 | |
| Bornholm | 0 | 15 | 23 | 0 | 0 | 1 | |
| Funen | 27 | 179 | 201 | 12 | 27 | 302 | |
| South Jutland | ** | 156 | 203 | **31 | 143 | ||
| Ribe* | - | - | - | - | - | - | |
| Vejle | 42 | 166 | 170 | 9 | 13 | 92 | |
| Ringk�bing | 8 | 168 | 228 | 8 | 6 | 70 | |
| �rhus | 52 | 1 | 414 | 495 | 116 | 75 | 140 |
| Viborg | 1 | 95 | 105 | 9 | 8 | 4 | |
| North Jutland | 2 | 160 | 232 | 23 | 11 | 61 | |
| Whole country | 140 | 4 | 1,490 | 2,343 | 404 | 559 | 1,064 |
| * | Only pollution determinations made near sewage treatment plants, and fish farms figures are not included | |
| ** | Data for fauna classes I and I-II and III-IV and IV are added up |
Composition of microfauna best in natural catchment areas
Watercourses in natural catchment areas have, as might be expected, a better fauna condition that cultivated or point-source-affected ones (Frederiksborg County, 1997; Jensen et al., 1997b; and others). In Frederiksborg County most watercourses in natural catchment areas were in class I-II and in agricultural or waste water-dominated areas in class II-III.
Improvements in the environmental state of watercourses from 1989-1992 to 1993-1996
All counties report clear improvements in fauna classes in many watercourses covered by national supervision (Frandsen et al., 1992; Wiberg-Larsen et al., 1997; South Jutland County, Jensen et al., 1997b; and others) in spite of no improvements in their environmental conditions being established by the monitoring programme over the last four years (Windolf et al., 1997). Comparison of county supervision data from 1989-92 and 1993-96, using only stations where data is available from both periods, shows that there has been a nation-wide improvement in fauna classes (Windolf et al., 1997).
Improved conditions in larger watercourses
Conditions have improved most notably in the larger watercourses over 2 m in recent years. For example, the number of stations in Funen with a satisfactory classification (II or better) rose in 1989-96 (Wiberg-Larsen et al., 1997). The proportion of lengths with satisfactory quality in Funen doubled from 30% to about 60%, while those completely unacceptable fell from 20% to about 3%. Similar tendencies occur in many counties (Windolf et al., 1997).
Conditions in smaller watercourses still unacceptable
The state of smaller watercourses continues to be unacceptable in many parts of Denmark. The proportion of satisfactory lengths in Funen has thus only grown from about 15 % to 20% between 1984 and 1995. The most significant reasons are insufficient waste water treatment and waste water from sparsely populated area. An act on treatment of waste water from sparsely populated areas was passed in 1997, which is expected to lead to an improvement in quality of especially the smaller watercourses.
"Good" species advance in growth and extent
The above improvements can also be seen at the species level of clean water species. Ringk�bing County has established a positive trend in the occurrence of the clean-water stonefly Isoptena serricornis (Ringk�bing County, 1997b). In the forthcoming red list of threatened plants and animals in Denmark, this fly is designated as vulnerable and as a species for which Denmark is internationally responsible. It was recorded at 13 locations in Ringk�bing County in 1988-92 but at 26 in 1993-96. This county contains most of the world’s known finds of this species during the relevant periods.
A similar rise in growth and extent of many clean-water species has been noted, for example the mayfly Heptagenia sulphurea in Funen, the stonefly Perlodes microcepala and its genus Leutra in Ribe and Aarhus Counties (Wiberg-Larsen et al., 1997; Ejbye-Ernst & Jepsen, 1997; Wiggers et al., 1997). These registrations contribute to the general picture of improving environmental conditions in Danish watercourses in recent years.
Reasons for improved fauna classes
Improved municipal waste water treatment whereby loading with organic matter (BOD5) is reduced, accompanied by improved physical conditions as a result of environmentally friendly maintenance schemes are considered the main reasons for the improvements recorded.
4.5.2 Filamentous algae Filamentous algae
Large growths of filamentous algae can have negative effects on the watercourse environment as they have a high oxygen demand for night-time respiration and decomposition after death. They are also of limited value as food source for the animals of the watercourse. Due to their negative impact, it is reasonable to seek to understand the influence of various parameters for their occurrence and growth. This is the reason why their occurrence in relation to chemical and other parameters was studied at about 100 watercourse stations in the 1993-96 monitoring programme.
Most filamentous algae in waste water-affected watercourses
Filamentous algae were not found at 24% of the stations in 1996. Filamentous algae covered 80-100% of the bed area at 25% of the stations, this being the most frequently found degree of coverage in 1996. More than 20% coverage was found in 6% of watercourses in natural catchment areas, 15% in agricultural catchment areas and 22% in catchment areas affected by waste water in 1996 (Windolf et al., 1997).
Unchanged extent of filamentous algae
There was no immediate change in the extent of filamentous algae coverage in the watercourses studied between 1993 and 1996 (Windolf et al., 1997).
Significance of parameters for filamentous algae coverage
The growth of filamentous algae depends on the relationship between several physical and chemical conditions, including phosphorus, flow and bed conditions, and light.
Large occurrences of filamentous algae in watercourses can also contribute to failure to meet watercourse quality objectives.
4.5.3 Fish
Fish – a good environmental indicator
Fish give a good picture of environmental conditions in a watercourse. A fish such as trout requires special surroundings for it to be able to live there. Trout needs – among other things - clean water, enough water, ample food and varied physical conditions. Thus, if there are natural populations of trout in a watercourse, the conditions are generally good enough for other fauna to live there as well, meaning that trout are generally a sign of a good, varied environment.
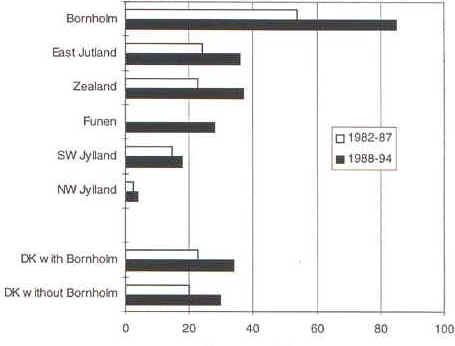
Progress in trout populations
In 1996 the Danish EPA instituted a study to establish the development of trout populations nation-wide during 1982-87 and 1988-94. The study was undertaken in more than 1000 targeted lengths of watercourse designated A, B1 and B2, of which most were studied in both periods. The study showed unambiguously that significant progress had been made in nearly all parts of the country in terms of numbers of trout fry in the watercourses (Figure 4.13) (Nielsen, 1997c). No general falling-off was found anywhere in the country.
Mean number of fry pr 100m2
Figure 4.13
Development in trout fry populations in 666 watercourse lengths studied in both 1982-87
and 1988-94. Standard data is missing from Funen for 1982-87 (Nielsen, 1997c).
Nation-wide the trout fry average per 100 m� of watercourse was about 34 in 1988-94. In 40% of the stations, fry from natural spawning was found in 1982-87 and by 1988-94 the share had risen to 60%. The biggest populations were found in Bornholm, Zealand and East Jutland. It should be pointed out that fry captured during the study was naturally produced as stocking had ceased in advance of the study.
There were great differences in the occurrence of trout fry in the water areas. For example, there were four times as much fry in the watercourse systems of Guden�en as in Skjern Watercourse even though they rise only a few hundred metres apart (Nielsen, 1997c).
Rare fish
Several counties are working hard to re-establish populations of red-listed fish species in watercourses, i.e. those which are rare or threatened with extinction in Denmark. Ribe and South Jutland counties have in part by rearing, stocking and watercourse restoration repopulated the larger watercourses near the Jutland Wadding Sea with houting (Ejbye-Ernst, 1993). The restocking has been stopped and natural populations are now found, although varying in size in certain places. A number of counties in Jutland and the Ministry of Food, Agriculture and Fisheries have co-operated to produce an action plan to recreate the Danish salmon populations (Ejbye-Ernst, 1993).
Reasons for increased fish populations
Changes of practice to more environmentally friendly maintenance schemes and the creation of free passage in many places contribute to increasing trout populations in watercourses. This is supported by a study in Funen which showed that many more trout arrive when watercourses are gently maintained by weed-cutting in flow channels only (Wiberg-Larsen et al., 1994).
Many counties also report that the improvement of the environmental state of the watercourses is reflected by the fact that trout have become frequent in the watercourses (Ejbye-Ernst, 1993).
Still some way to go
Studies of fish, in particular trout, also show that if environment conditions are improved, rapid increases in fish populations will follow. But Nielsen (1997c) also showed that unfortunately there is still some way to go before there are satisfactory trout populations in our watercourses. In 1988-94 there were still no trout at 40% of the locations where they ought to be found, so work to create the right environmental conditions still has to continue.
4.5.4 Setting watercourse objectives
The county councils set objectives for the quality and utilisation of watercourses in their regional plans.
In the last two nation-wide surveys of targets in 1993 and 1997, B1 (salmonoid spawning and nursery grounds) and B3 were the most frequently set targets (Table 4.10). The many B-level targets show the high priority given to the watercourse environment by the county councils – they want good watercourses back.
Table 4.10
Distribution of watercourse targets (in km) set by counties in 1993 (Danish EPA, 1995; Windolf et al., 1997)
| Watercourses | Target |
|||||||||
| A | B1 | B2 | B3 | C | D | E | F | Other | Total (km) | |
| % of total in 1993* | 5 | 25 | 19 | 29 | 14 | 2 | 1 | 5 | 19,000 | |
| % of total in 1996 | 5 | 28 | 14 | 23 | 20 | 1 | 1 | 3 | 5(BO) | 24,000 |
| * Bornholm County and the Copenhagen Municipality did not provide data in 1993. |
In 1996, the counties supervised the environmental quality in all 7,045 watercourse stations, but it was only possible to assess whether the objectives had been met on the basis of the composition of invertebrates in 5,981 stations due to drying out, poisoning, etc. This assessment showed that only 39% met their objectives in 1996, which does not differ significantly from previous years (Figure 4.15).
Despite this, marked improvements in the environmental quality at the individual stations have been recorded in recent years when using the fauna class as a measure rather than target compliance. The counties thus report clear improvements in fauna class in many watercourses.
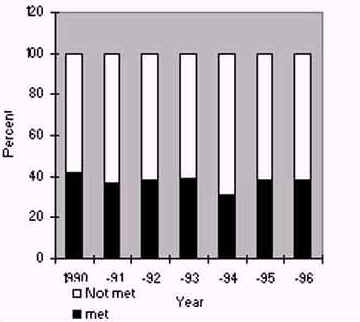
Figure 4.14
Development in watercourse target compliance assessed by the regional supervision in
1990-96
Improvements of the environmental quality of watercourses not reflected by target compliance
There are probably several reasons why the improvements of the environmental quality of watercourses do not reflect in higher levels of target compliance. Firstly, the conditions in many watercourses in earlier years were poorer than fauna class III, meaning that there was a long way to go before meeting objectives, which means fauna class II or higher for A or B targeted watercourses. This has meant that instead there has been a rise in the number of stations where there is only half a fauna class difference between current and target conditions (Frederiksborg County, 1997; Jensen et al., 1997b), meaning in principle that there is not "far" to go before these watercourses meet their objectives.
Secondly, there are reports that fauna classification is being assessed "tougher" today than previously because of a gradual change in methods (South Jutland County, 1997). The result is that watercourses today assessed as II-III would in principle have been considered class II before, which is actually the difference between meeting or not meeting the objective. Work is in progress to standardise procedures including the introduction of a new microfauna index called the Danish Watercourse Fauna Index so that variations due to choice of method will in future be reduced.
In addition, many B3-targeted watercourses have little gradient and thus poor flow, meaning that it is hard or nearly impossible to achieve the fauna class II required to meet their objectives. In such cases, the counties ought to set more realistic objectives.
Finally, there are indications that some targets have been raised in the revision of regional plans when a county council has taken measures to improve conditions in the long term. From a review of 11 drafts of the 1997 regional plan revisions it appears that six of them stated whether targets had gone up or down: about 60 % of these were revised upwards, with higher compliance requirements. This implies the risk that, in the short term, objectives will cease to be met even though conditions and therefore water quality have not altered.
Reasons for not meeting objectives
Waste water discharges and poor physical conditions are the main reasons for not meeting objectives (Table 4.11).
Table 4.11
Distribution of reasons for failure to meet targets in Danish watercourses in 1993-1996.
| Main reason for failure to meet targets | Watercourses |
% |
|
| Sewered areas | 15 |
| Sparsely populated areas | 27 |
| Fish farming | 4 |
| Illegal discharges | 4 |
| Regulation/maintenance | 23 |
| Natural circumstances (little gradients) | 3 |
| Ochre | 11 |
| Toxicity | 2 |
| Drying out | 9 |
| Flow-in from lakes | 2 |
| Total | 100 |
The reasons are different in large and small watercourses. In those less than 2 m wide, the most significant reason is waste water discharges from sparsely populated areas, compared with poor physical conditions as a result of regulations and heavy-handed maintenance in the large ones. Table 4.12 compares target compliance in small and large watercourses.
Table 4.12
Meeting of targets nation-wide in small and large watercourses in 1996.
| Watercourse width (m) | Targets met (%) |
| 0 – 2 | 37 |
| over 2 | 47 |
Possibilities of improving watercourse quality
The shortfall in meeting targets is unsatisfactory from both environmental and administrative points of view, making further improvement efforts necessary. The modification of the Act on waste water purification in the open countryside is a good example of this, and it creates the basis of solving the problem of discharging waste water in the open countryside to help meeting objectives especially in minor watercourses in coming years.
Many counties indicate that physical conditions need to be improved if both small and large watercourses are to meet their objectives in the future. A great many watercourses which today are in fauna class II-III may be improved to meet their class II or higher targets by this means (South Jutland County, 1997; Jensen et al., 1997b). Jensen et al. (1997b) state that poor physical variety was the reason for failure to meet targets in 31% of a total of 1,095 watercourse stations studied in 1992-96.
Significant investments should therefore be made over the coming years in measures to improve physical conditions so that the form of the watercourses can match the improving water quality by now. A case in point is to change-over to more environmentally friendly maintenance practices, actual watercourse restorations, re-establishment of water meadows by altered agricultural practices, etc. There is also a need to prioritise what water areas are to be scrutinised, which would entail that the effects of the measures taken by the counties in freshwater areas are rendered more visible in that more watercourses due to the measures will meet the objectives set.
[Front page] [Contents] [Previous] [Next] [Top] |