|
The Aquatic Environment in Denmark 1996-1997
5
. Lakes120,000 lakes in Denmark
In Denmark there are approx. 120,000 lakes and waterholes above 100 square km. 3% or 3187 lakes are above 1 ha, and which only 468 are above 5 ha. Denmark has six large lakes above 10 square km. We also have a large unknown number of small dams and waterholes below 100 square meter.
Some of the lakes were created in subglacial stream trenches formed by ice and melt water during the Glacial Age. Others were formed when lime deposits in the underground collapsed, or when coastal areas were intersected by naturally occurring offshore bars etc. Some lakes are man-made, for instance millponds. Morphologically, Danish lakes differ very much in terms if waterflow, size, depth, soil in catchment areas, cultural pressure etc.
Large Danish lakes
Typically a large Danish lake above 5 ha is characterized by low water and short lake water retention time. The catchment area covers an average of 97 square km (see table 5.1)
Table 5.1
Size, depth, catchment area and retention time for Danish lakes above 5 ha (468 lakes) (Danish EPA, 1990)
| Mean | Median | Max | Min. | |
| Lake area (square km) | 1,1 | 0.22 | 42 | 0.05 |
| Mean depth (m) | 2.9 | 2.0 | 16.3 | 0.2 |
| Maximum depth (m) | 6.1 | 3.7 | 37.4 | 0.2 |
| Catchment area (square km) | 97 | 11 | 1500 | 0.16 |
| Retention time (year) | 1.6 | 0.3 | 27 | <0.01 |
Small lakes and waterholes
Our knowledge on the aquatic environment in waterholes below 1 ha is limited. Many waterholes are located in cultivated areas and were previously used to dump waste. The state of the environment is therefore no doubt very bad. Since 1882 the lakes have been protected under the Conservation of Nature Act: the state of lakes above 100 square m shall not be changed without prior permission from the regional authorities.
Many small lakes have been filled up – 76% of the lakes and waterholes in Arreskov Lake catchment area have disappeared since 1890 (Hansen et al., 1997). In recent years many small holes have been restored in connection with nature restoration projects, i.a. to create habitats for rare amphibians. Thus, generally the number of lakes in Denmark is increasing.
Poor environmental state
Danish lakes are typically in a poor state, because of former discharges of wastewater and present input of nutrients from diffuse and point sources.
Polluted lakes have large nutrient concentrations on the bottom, suffer from extensive algal growth, many non-predatory fish, few predatory fish, scarce bottom vegetation, and oxygen depletion.
Legislation and action plans regulating lakes
In the 1970’s awareness of the value of clean lakes increased, and with the entry into force of the Environmental Protection Act in 1974 focus was directed towards the protection of the aquatic environment in lakes. The Act provides for an administrative planning system, where objectives are set up for the desired state of individual lakes.
Wastewater plans
Under the Environmental Protection Act local authorities were obliged to prepare wastewater plans, specifying i.a. the location of discharges, volume of discharges and purification measures. Wastewater discharges to lakes should not prevent achievement of the objectives set for the lakes. Where discharges made it impossible to meet the objectives, purification measures should be improved, or discharges be removed to less vulnerable water areas. In practice this means that wastewater discharges to Danish lakes is limited.
Moreover, in 1986 the Danish Folketing decided that all illegal discharges from municipal purification plants, industry and agriculture should be stopped before 1987, to prevent the negative impact on the environment in the lakes.
Aquatic environment plans
These measures were followed up by the Action Plan for the Aquatic Environment in 1987, under which diffuse phosphorus and nitrogen leaching was to be reduced considerably by stricter requirements for manure storage and for purification of wastewater from urban areas and industry.
SLA areas etc.
Identification of sensitive agricultural areas (SLA) eligible for financial support to environmentally friendly agricultural measures has also reduced farming operations, i.a. fertilizer consumption, pesticide application along the lakes, and has reduced input of nutrient to marshes and small lakes (K�benhavns Amt, 1997).
Danish lakes are also regulated under a number of other Acts: Conservation of Nature Act, Water Supply Act, Water Course Act. Identification of bird habitats and Ramsar areas has also affected the use and state of Danish lakes.
Reduced nutrient load
The legislative and planning measures have substantially reduced nutrient loads in lakes, especially of phosphorus. Unfortunately, the positive effect on the aquatic environment in Danish lakes has been less marked, since nutrients discharged previously by agriculture and scattered dwellings are latently available to algal production on the bottom, and discharges are still too large for many lakes.
Where nutrient discharges are acceptable, nutrient loads in polluted lakes are expected to fall when accumulated phosphorus has leached from the lake or has been bound to the bottom, and is thus no longer available to algae.
In the last five to ten years, lake restoration projects have aimed at generating an acceptable environment, with clear water and ample bottom vegetation. This is done by fishing up roach and bream, and by putting out predatory fish, removing sediment, and planting bottom vegetation.
5.1.1 Target setting
The Planning Act
The quality and usage of Danish lakes is determined by the regional plans under the Planning Act. The county councils set objectives for lakes in the regional plans, which then form the basis of the counties’ management of the lakes. Objectives are chiefly set for the large lakes.
An objective is set for the quality and usage of individual lakes based on their biological background condition, existing outfalls and desired future usage.
Guidelines
The Danish EPA’s Guidelines for recipient quality planning No. 1, 1983, contain a range of lake targets. In principle, the target setting system is subdivided into three types: strict, basic, and modified objectives (Table 5.2).
Table 5.2
Summary of lake quality objectives
| Target | Description | |
| Targets with strict requirements | A1, sites of special scientific interest A2, bathing waters A3, untreated water for water supplies |
Lakes where particular natural conditions need to be preserved Lakes required to be used for bathing, etc. Lakes which provide untreated water suitable for drinking |
| Basic targets | B, natural, balanced flora and fauna | Lakes whose natural, versatile flora and fauna are unaffected or only slightly affected by waste water input or other human influence |
| Modified targets | C1, lake affected by waste water, water catchment or
other physical interventions C2, lake affected by agriculture |
Lakes permitted to be affected by waste water outfalls or other
influence Lakes where it would not be possible to meet basic targets by purifying or cutting-off waste water inputs into the catchment area because of nutrient inputs from cultivated areas into the catchment area. |
Strict targets
Lakes containing particular flora and fauna in need of special protection are designated sites of special scientific interest, which is a strict target. These lakes are wholly or nearly unaffected by human activity and are naturally to be protected from man-made effects that could alter their environmental condition. Similarly, strict targets also apply to lakes designated as bathing waters and drinking water reservoirs.
Basic targets
Lakes, whose natural flora and fauna is to be preserved, are targeted B, i.e. basic targets. In these, the ecology may only be mildly affected by human activity.
Modified targets
These are set for lakes whose ecological state make it acceptable for them to be affected by lawful discharges.
Quality requirements for target setting
For each objective set by counties in their regional plans, some physical and chemical quality requirements are to be met in the lake for its objective to be considered met. For example, it may be required that waste water outfalls, water catchment areas, etc. are acceptable only if they do not prevent meeting the objective.
Assessment of compliance
In order to assess whether a target has been met, a parameter is often chosen which is easy to quantify and can be used as an environmental indicator for the lake. Counties often use the Secchi depth as an indicator of whether a target has been met or not. Thus, for most targeted lakes the regional plans stipulate requirements to the effect that the Secchi depth must exceed a certain depth. Typically, many algae are present in a polluted lake, leading to poor visibility, and few algae in unpolluted lakes therefore mean high visibility.
A lake must also have a multifaceted, balanced flora and fauna in order to meet its target. Benthic vegetation must be possible and there is to be a natural balance of predatory and non-predatory fish.
Regional lake supervision
The scope and character of supervision of lakes depends on the targets to be checked against. The supervision therefore varies between counties, from an extensive programme in which mainly Secchi depths are measured, to an intensive programme with many different biological investigations.
Lakes in the Danish EPA’s monitoring programme
In the monitoring programme of the Danish EPA the environmental conditions of 37 lakes are investigated via an intensive programme consisting of many different biological tests, including nutrients, algae, and Secchi depth. The 37 lakes monitored are considered reasonably representative of the Danish lakes.
5.2 Water balance and weather
Section 4.2, "Water balance and freshwater run-off", contains a general description of the water cycle, precipitation, and run-off, water balance, and developments of these.
Influence of weather on environmental conditions in lakes
The weather has a very significant effect on conditions in lakes. Air temperature, amount of precipitation, sun irradiation, run-off and wind are all factors affecting conditions in a lake.
The amount of precipitation affects the volume of run-off via aquifers to the lakes and thus the nutrient transport to the lakes since nutrients are primarily supplied by freshwater run-off. In dry years such as 1996, nutrient inputs to lakes were very low compared with normal or wet years.
Sunshine and therefore also indirectly the air temperature influences the warming up of the lake water since the rate of all biological processes is influenced by temperature. Blooming and decomposition of algae, decomposition of other fauna and flora, reproduction of fish and invertebrates are all examples of processes affected by sun irradiation and temperature.
The wind affects the agitation of the water body in a lake. The lake size and depth and the wind velocity affect the agitation caused by the wind. In large, deep lakes, the wind will tend to only agitate the upper part, leading to stratification of the water body dependent on temperature and wind. Such stratification has great implications for the physical and chemical processes in a lake. By contrast, a shallow lake may experience complete wind-induced agitation.
Weather variations thus create large year-on-year variations in the physical, chemical, and biological processes in lakes and therefore their overall environmental conditions.
5.3 Water quality in lakes
37 lakes are included in the monitoring programme, but it has only been possible to draw up nitrogen and phosphorus balances for 22 of them.
Danish lakes are generally very rich in nutrients with high concentrations of nitrogen and phosphorus in their water.
5.3.1 Nitrogen
Nitrogen in 1996
The annual mean concentration of total nitrogen in water entering the monitored lakes was 7.6 mg/l in 1996, which broadly corresponds to the mean level in 1992-96. In 1996, the total input of nitrogen was very low due to the low precipitation and resultant low run-off to the lakes. (Jensen et al., 1997a).
The annual mean concentration of total nitrogen in lake water in 1996 was 2.2 mg/l.
Development in nitrogen input
The total input of nitrogen to the monitored lakes varied, totally seen, from 11 to 2,204 tonnes/year in 1992-96 (Table 5.3). The great variation is due to variations in run-off and the nitrogen content of the water input.
Table 5.3
Nitrogen input to 22 monitored lakes 1992-96 (Jensen et al., 1997)
| Mean | Median | Min. | Max. | |
| Total nitrogen (tonnes N) | 255 | 65 | 11 | 2,204 |
| Total nitrogen (mg/m2/day) | 473 | 421 | 32 | 1,682 |
| Flow-weighted input concentration (mg/l) | 7.5 | 8.3 | 1.5 | 11.8 |
The total nitrogen input was largely unaltered in the monitoring period between 1989 and 96 (Figure 5.1) and follows variations in run-off to the lakes.
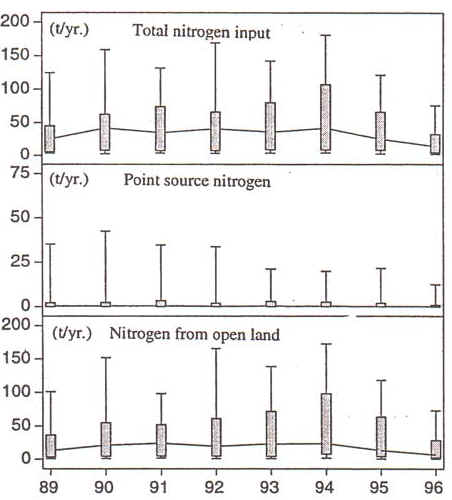
Figure 5.1
Nitrogen input to lakes (tonnes/year). Total input, input from point sources and inputs
from open land. 25 and 75% quartiles are shown by a broad column, the 10 and 90%
percentiles by thin horizontal lines (Jensen et al., 1997a).
The majority, i.e. 73.6% of the nitrogen input to the monitored lakes in 1992-96 comes from open land, especially farmland. Point source inputs from sewage treatment plants, fish farms, and storm water overflows provide only 8% of the total nitrogen load and were therefore far less significant compared with the contribution from cultivated areas. Atmospheric deposition is an important factor for the nitrogen balance of the lakes, contributing 17% of the total nitrogen loading of the lakes. Input of nitrogen from the atmosphere to the lakes is man-made and results from burning fossil fuels as well as evaporation of ammonia from agriculture.
Nitrogen input due to human activity thus make up a very high proportion of the total input to lakes.
Nitrogen balance in lakes
Most of the nitrogen retained in lakes is converted from nitrate to free nitrogen and escapes from the lake. Typically, 30 to 40% of the nitrogen is retained and converted, most of the remainder being removed from the lake via outflows, which is why nitrogen is not accumulated in lakes. Retention time in the lake, however, plays a role for the conversion of nitrogen, less being converted if the retention time is short.
In 1996, the nitrogen retention was relatively high because of the low water flow.
Development of nitrogen content of lakes
Total nitrogen concentrations in the lake water of the monitored lakes, both as annual and summer averages, were on the whole unchanged in 1989-96, nor could any changes in input concentrations be recorded.
5.3.2 Phosphorus
Phosphorus in 1996
The annual mean total phosphorus concentration in input waters to the monitored lakes in 1996 was 0.21 mg/l, which is slightly higher than the average in 1992-96 (Table 5.4). The low run-off in 1996 meant that total phosphorus input to the monitored lakes via surface run-off was small (Jensen et al., 1997a).
The mean annual concentration in lake water was 0.16 mg/l in 1996.
Development of phosphorus input to lakes
There are also great variations in the total phosphorus loading of lakes, which varied from 0.1 to 34.2 tonnes/year during 1992-96. The phosphorus concentration of input waters varied between 0.08 and 0.57 mg/l.
Table 5.4
Phosphorus input to 22 monitored lakes 1992-96 (Jensen et al., 1997a)
| Mean | Median | Min. | Max. | |
| Total phosphorus (t) | 5.0 | 1.2 | 0.1 | 34.2 |
| Total phosphorus (mg/m�/day) | 9.5 | 7.6 | 0.7 | 24.8 |
| Flow-weighted mean input concentration (mg/l) | 0.16 | 0.13 | 0.08 | 0.57 |
Falling phosphorus inputs to the most heavily loaded lakes
Phosphorus inputs to the monitored lakes expressed as median were largely unchanged between 1989 and 1996 (Figure 5.2), but there has been a fall in phosphorus inputs to the most heavily loaded lakes from 8-10 tonnes of total phosphorus a year up to 1991 to 2-4 tonnes thereafter. The main reason for the drop in phosphorus input is reduced point loading plus a fall in diffuse inputs.
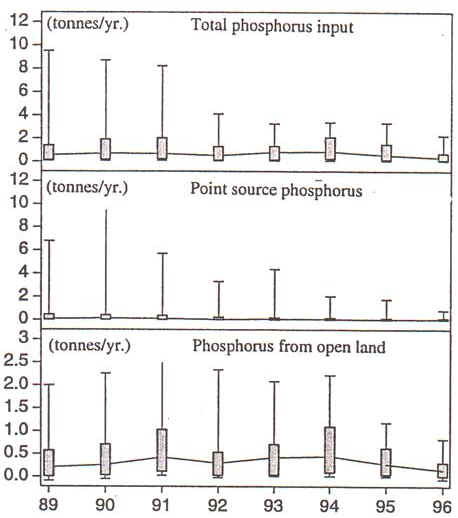
Figure 5.2
Phosphorus inputs to monitored lakes (tonnes p.a.). Total input, input from point sources
and inputs from open land (Jensen et al., 1997a).
Open land is the main source of phosphorus loading of monitored lakes
Open land, cultivated areas particularly, is the main source of phosphorus inputs to the monitored lakes, comprising 57% of the total volume in 1992-96. Point sources contributed 33%, of which 14% came from discharges in sparsely populated areas. Waste water discharges from towns and industry only accounted for 10% of the total input of phosphorus to lakes.
The input from towns and industry was previously more significant to the total input of phosphorus to lakes than it is today. There has been a marked decrease in the phosphorous loading of lakes from point sources since the 1970s.
Phosphorus previously stored in sediments is significant
There is great variation in the retention of phosphorus in the monitored lakes as this depends in part on the water retention times. In some lakes more phosphorus is output than input, i.e. the retention is negative, while the opposite is true in others. The retention thus varied in 1992-96 between –50% and +90%, with an average of 4.8% of the phosphorus input to the lakes (Jensen et al., 1997a). When some nutrition-rich lakes discharge more phosphorus than is input, this is because phosphorus previously stored in the lake sediment is still being liberated. Thus, the lakes are not at equilibrium with the current loading.
The reduction in external phosphorus loading as a result of centralised and improved purification of sewage from towns and purification of industrial waste water thus has not resulted in improved environmental conditions in lakes because of phosphorus stored in the sediment.
Phosphorus retained in lakes is not converted and does not disappear, as is the case with nitrogen, but is stored in the sediment instead.
The phosphorus content of water in the monitored lakes is showing an overall falling tendency. The annual mean value of total phosphorus has thus fallen from 0.202 mg/l in 1989 to 0.157 mg/l in 1996, corresponding to a reduction of 22% in 1996 (Figure 5.3). The greatest drop in the phosphorus content of lakes has mainly taken place in 1987-1991. The reduction has again been greatest in the most nutrient-rich lakes corresponding to the fall in phosphorus input to them. The summer average has not fallen, however.
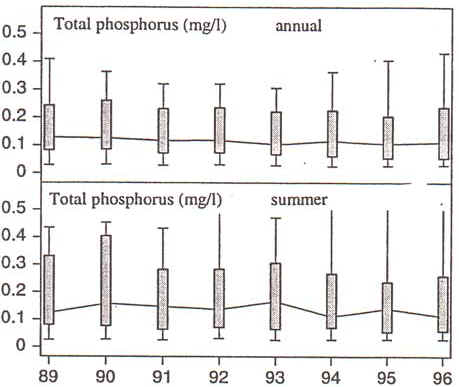
Figure 5.3
Total phosphorus in lake water (mg/l), annual and summer averages (Jensen et al., 1997a)
5.3.3 Heavy metals and contaminants
Occurrence
There are no systematic studies available on the occurrence and effects of heavy metals and contaminants in Danish lakes. The lake water concentrations are generally considered to be low, but will - dependent on the retention time - reflect the presence of the substances in the various inputs to and run-offs from the lake (watercourses, waste water outfalls, storm water run-off, percolation of ground water, etc.). Due to the low flow rate in the lakes, suspended particles will often form sediment leading to an accumulation of particle-bound heavy metals and contaminants at the bottom of the lake.
The possibility that accumulated heavy metals and contaminants in the sediment may have detrimental long-term effects especially on organisms living at the bottom cannot be ruled out.
Heavy metal content in sediment
There are several examples of heavy metals found in lake sediment. In connection with the restoration of Brabrand lake in Aarhus county, in which the sediment was dug out, it was estimated that a removal of sediment to a depth of 500 mm over an area of 1 km� would result in the removal of 144 kg of cadmium, 5,000 kg of copper, 159 kg of mercury, 2,700 kg of nickel, 6,300 kg of lead, and 36,300 kg of zinc (Brix & Schierup, 1987).
The same quantities of heavy metals in lake sediment would not necessarily be expected in other lakes as the content of heavy metals in sediment vary from lake to lake and depend on several factors.
A high content of humus in the sediment and much leaching of metals from catchments or input of soil particles may result in a content of heavy metals in the sediment that is higher than normal.
Sediments with a high content of organic matter will have a rather high content of heavy metals and, similarly, a low content of heavy metals if the content of organic matter is low.
Sources
Sources of heavy metals in lake sediments are partly natural background loads, and partly man-made sources.
Natural background loads of heavy metals in lakes are generally low due to the mineral composition of the Danish geology plus low natural atmospheric input.
The man-made sources of heavy metals in lakes are predominant, i.e. especially waste water outfalls and atmospheric input.
Waste water disposal, etc
Heavy metal inputs from waste water disposal either directly to lakes or via watercourses etc., and increased levels of heavy metals can be detected in many lakes as a result of discharges over many years.
Atmospheric sources
Heavy metal input from the atmosphere has risen compared with the natural background input as a result of the widespread use of fossil fuels, lead additives in petrol, and the industrialisation in general.
Falling loads
Discharges of heavy metals with waste water have diminished noticeably over recent years as a result of improved sewage treatment brought about by the Aquatic Environment Plan. The atmospheric deposition on water surfaces has also been reduced in step with, among other tings, the phasing out of lead additives and improved industrial pollution-prevention measures. These discharges are expected in future to be further reduced, due partly to ever better purification measures and partly to the introduction of cleaner industrial technology.
5.3.4 Acidification
There are a number of acidified or acidification-threatened lakes in West-, North- and Central Jutland as a result of low lime content of the soil. Collection of data from about 100 lakes in the above regions threatened by acidification in 1991 showed that many of them had low pH values, i.e. less than pH 5 (Rebsdorf, 1991).
All the same, acidification as a result of acid rain is not a problem to the same extent as in Norway and Sweden, although changes in acidity of some lakes has been noted in recent years.
An older study of the development of acidification in Central and North Jutland lakes showed that their acidity had fallen by 0.6 pH units from the 1950s to 1979 (Rebsdorf, 1981 from Rebsdorf & Nygaard, 1991), presumably as a result of acid rain.
Data from 43 lakes in Central and West Jutland in 1991 showed that 18 of them had become more acid, 3 more basic and 22 showed no clear development since before the 1970s (Rebsdorf & Nygaard, 1991).
5.4 Biological conditions
Different plant and animal populations predominate in different parts of the water body and at the bottom of the lake. The composition, occurrence and linking of the various groups of flora and fauna in various areas of the lake can give a picture of the overall environmental condition of the lake because the biological populations in lakes vary considerably depending on nutrient inputs and levels in the lake water.
5.4.1 Flora and fauna
Phytoplankton
Microscopic plants called plankton or algae are found in the free bodies of lake water. They are called plankton or algae and consist of a number of different groups, e.g. green algae, diatoms and blue-green algae, all of which produce organic matter by photosynthesis. They are thus part of the primary production of a lake and the basic food for zooplankton. The various groups differ in form and biology. The number of algae in a lake can vary from thousands to billions of organisms per litre of water (Sand-Jensen & Lindegaard, 1996), and they are very important to the environmental state of the lake. The number of species in a lake averages 100 over the year.
Nutrient balance
The amount and composition of algae is affected by the nutrient balance in a lake. The amount of phytoplankton generally rises with the phosphorus concentration, but only some species of algae respond to the nitrogen levels.
The depth, biomass and amount of zooplankton also affect the amount and composition of phytoplankton.
Seasonal variation in production of algae
The amount of phytoplankton is controlled by the intensity of light and the temperature and therefore varies over the year. In spring, rising light input and water temperature accompanied by available nutrient often give rise to large blooms of particular algal groups (often diatoms) in the upper water strata. This provides food for zooplankton, whose biomass increases in May and June by grazing on the algae.
Similarly, lack of nutrients in a nutrient-poor lake may contribute to falling algae biomass in early summer, leading to clear water in the lake. A great many of the algae produced during the summer decompose later in the season, thereby again releasing nutrients to the water. As long as the light intensity is still high in autumn, this release may cause an autumn bloom of algal groups such as green and blue-green algae in many lakes. In autumn, when the light intensity reduces further, algal production follows suit and is typically minimal through the winter.
Zooplankton
Zooplankton similarly consists of a range of single or multi-celled organisms such as daphnia, water fleas (copepods) and protozoa. Their food is typically phytoplankton, bacteria or other organic matter. Their numbers are controlled by availability of food, but also by hunting by fish such as roach and bream or other animals.
The amount and composition of zooplankton has great impact on the biological process and therefore on the environmental condition of the lake. The size of individual subjects and the zooplankton biomass are affected by variations in the amount of nutrients in the lake. Studies of 60 lakes showed that the biomass of, among others, daphnia drops significantly with rising phosphorus concentration, while the reverse is the case for copepods (Jensen et al., 1997a).
Seasonal variation in the spread of zooplankton
The total biomass and composition of zooplankton changes with the seasons, controlled by availability of food and thereby the nutrient levels as well as by hunting by fish. In nutrient-poor lakes, where the number of zooplankton-eating fish species is limited, the amount of zooplankton follows changes in the population of phytoplankton on which they feed. The highest zooplankton biomass is thus found in May/June and in August when the phytoplankton biomass is at its highest. In a nutrient-rich lake there is a peak in phytoplankton around the end of June, so the zooplankton biomass level is high and reaches its peak in May-June when the phytoplankton biomass is also high.
Aquatic plants
Aquatic plants are also highly significant to the circulation of nutrients and biological processes in lakes and are generally regarded as beneficial. For example, they improve oxygen levels near the bottom and stabilise sediment, which therefore is not so easily stirred up resulting in increased phosphorus release. Aquatic plants also have positive effects on the composition of zooplankton, fish and other animals in a lake. Their effect on water quality and the biological interplay therefore depend on their coverage of the bottom of the lake.
The extent of aquatic plant growth depends on the lake depth and thus the possible extension area, water clarity and thus the number of algae. So an increased amount of algae in the lake water due to rising phosphorus concentration will reduce the light penetration down to benthic plants, reducing the depth limit for aquatic plants. At a phosphorus concentration of 0.15 mg/l, bottom plants will only be able to grow down to a depth of 1 m (Kristensen et al., 1990 after the Danish EPA, 1990).
5.4.2 Fish
The variety of fish in a lake often reflects the general condition as regards nutrient levels, size, climatic influence, etc. Fish also play an important role in regulating environmental conditions in a lake, including the clarity of the water.
45 fish species in Danish lakes
45 different species of fish have been recorded in studies of fish populations in Danish lakes over the last 10 years (Jensen et al., 1997a). The number of species in individual lakes depends in part on nutrient levels and depth, but they typically contain 6 to 8 different species. Input of large amounts of nutrients such as phosphorus often results in the number of species falling, but the biomass of the remaining species rising.
Many predators in a clean lake
Pike and trout do well in clean, nutrient-poor lakes. They hunt mainly by sight, and as clean lakes generally have clear water and plenty of aquatic plants, their hunting prospects are good. The hunting pressure on non-predatory fish such as roach and bream is high and their numbers are thus kept down. When this happens, there will often be large amounts of zooplankton, on which the non-predators normally feed, and which in turn "graze" on the phytoplankton or algae. The presence of enough predatory fish therefore contributes to keeping a clean lake clear.
Many non-predators in a polluted lake
On the other hand, the water in a polluted lake will be more turbid, to the detriment of the above predators. Hunting pressure by predators on roach and bream is less, and large populations of non-predatory may develop. A large population of roach and bream eats so much zooplankton, such as daphnia, that these cannot keep the algae down, and the lake becomes even greener. A polluted lake thus enters a vicious cycle.
Predatory fish thus tend to dominate in clean nutrient-poor lakes while others such as roach and bream predominate in nutrient-loaded lakes. The fish composition of V�ng Lake in Vejle county is a good example of dominance by predators when the phosphorus level is relatively low (Figure 5.4). On the other hand, Dons N�rre Lake is nutrient-loaded and, consequently, non-predatory fish dominate.
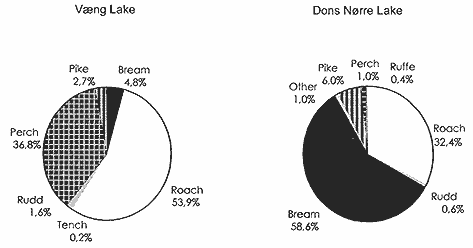
Figure 5.4
Percentage distribution by weight of fish species in clean lake (V�ng Lake) and in a
polluted lake (e.g. Dons N�rre Lake) in Vejle county, 1996).
| 1995 | V�ng S� | 1991 | Dons N�res� |
| Area | 15 ha | Area | 36 ha |
| Phos.conc. | 0.05 mg/l | Phos.- conc. | 0.149 mg/l |
| Secchi depth | 158 cm | Secchi depth . | 53 cm |
| Objective | To bottom | Objective | 60 cm |
| Comp. of fish | Good | Comp. of fish | Bad |
Bio-manipulation
The effect of fish composition on the maintenance and stability of certain environmental conditions in a lake is used when lakes are being restored. This is called bio-manipulation and involves removal of roach and bream combined with stocking of predators such as pike.
5.5 Environmental conditions in lakes – status and development
The total phosphorus and chlorophyll-a contents and Secchi depths, averaged over the summer period, give an impression of the current environmental conditions in the monitored lakes in 1996 (Figure 5.5).
Figure 5.5
Contents of total phosphorus (mg/l), chlorofyll-a (m g/l), and
Secchi depth (m) in the lake water in 37 monitored lakes. The values are the average
throughout the summer.
Figure 5.5 shows that in lakes where the phosphorus concentration is high, the Secchi depth is low and chlorophyll-a content is high, i.e. the environmental conditions are poor. Furthermore, only when the phosphorus content is less than 0.1 mg/l in the lake water, Secchi depths of more than 1 m are expectable.
Low Secchi depths in lakes in 1996
There were great differences in Secchi depths in the monitored lakes in the summer of 1996, varying from 0.35 to 5.54 m. Expressed as summer and annual averages, the Secchi depth was 1.5 and 1.7 m, respectively. In the 25% most polluted lakes included in the monitoring programme it averaged 0.64 m in 1996. The chlorophyll-a content also varied in the monitored lakes in 1966, and the yearly average was 49 mg/l in 1996.
Regional lake supervision
The counties also measure the Secchi depth in lakes as part of their regional supervision. In 1996, the regional supervision included measurements of Secchi depths in 225 lakes, which are not necessarily representative of Danish lakes generally, but as the number of lakes in which Secchi depth is measured every year is quite high, the regional supervision is considered to provide a picture of the distribution of Secchi depths in Danish lakes.
Table 5.5
Distribution of Secchi depth measurements by county as recorded in the counties’
regional monitoring in 1996 (Danish EPA, 1997a)
| Secchi depth | ||||||
| County | 0-0.5 | 0.5-1 | 1-1.5 | 1.5-2 | 2-3 | >3 |
| Copenhagen municip. | 0 | 4 | 2 | 2 | 0 | 0 |
| Copenhagen | 0 | 2 | 7 | 0 | 0 | 1 |
| Frederiksborg | 1 | 4 | 1 | 3 | 0 | 0 |
| Roskilde | 2 | 4 | 1 | 0 | 0 | 0 |
| West Zealand | 9 | 9 | 6 | 2 | 1 | 2 |
| Storstr�m | 9 | 33 | 13 | 8 | 5 | 4 |
| Bornholm* | - | - | - | - | - | - |
| Funen | 1 | 8 | 3 | 2 | 0 | 0 |
| South Jutland | 0 | 10 | 4 | 1 | 6 | 2 |
| Ribe | 0 | 0 | 2 | 4 | 3 | 0 |
| Vejle | 4 | 4 | 4 | 2 | 3 | 1 |
| Ringk�bing | 1 | 4 | 3 | 0 | 1 | 0 |
| Aarhus | 1 | 2 | 4 | 1 | 1 | 1 |
| Viborg | 0 | 4 | 0 | 1 | 0 | 2 |
| North Jutland** | - | - | - | - | - | - |
| Total | 28 | 88 | 50 | 26 | 20 | 13 |
| * Data not reported to the Danish Environmental Agency. ** Lakes not studied in 1996. |
Over half the lakes have a Secchi depth less than 1 m
The regional supervision found the Secchi depth to be less than 1 m in 52% of the lakes. The most commonly measured Secchi depth was within the 0.5-1 m interval, which must be considered unsatisfactory in most lakes. In only 6% of the lakes examined the Secchi depth was more than 3 metres.
Large amounts of plankton in 1996
As a result of the high nutrient levels in 1996, large amounts of plankton were measured in most of the 37 lakes monitored which is reflected above in the Secchi depths and chlorophyll-a content.
The phytoplankton biomass consisted mostly of algal species such as blue-green and green algae characteristic of nutrient-rich lakes (Figure 5.6). Expressed as a median, blue-green algae typically formed between 15 and 30% of the total biomass.
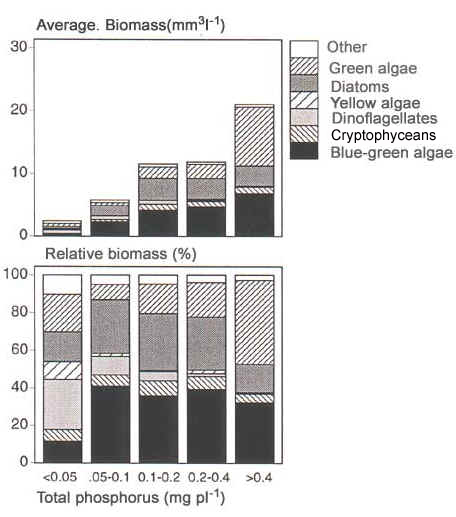
Figure 5.6
Composition of phytoplankton relative to total biomass at different total phosphorus
concentrations in 1996 (Jensen et al., 1997a).
Slight improvement in Secchi depths since 1989
There have only been small changes in the Secchi depth and chlorophyll-a content of the monitored lakes between 1989 and 1996 (Figure 5.7). There has been, however, a slight rise in visibility accompanying a small drop in chlorophyll-a levels.
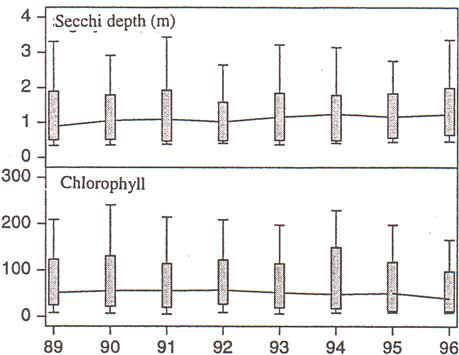
Figure 5.7
Secchi depth and chlorophyll-a content (summer averages) in lakes between 1989 and 1996
(Jensen et al., 1997a)
Changes in plankton biomass in 1989-96 were similarly limited. Nonetheless, there has been a downward trend in median values from 11.7 to 5.6 mm�/l. There have been statistically reliable reductions in annual mean total biomass in 13 lakes expressed as yearly average, while in no cases has it risen.
Zooplankton in 1996
The 1996 total summer biomass of zooplankton averaged 0.81 mg dry matter/l.
Zooplankton amount unchanged
The amount of zooplankton in the monitored lakes as a whole expressed as total biomass, has not altered significantly (Figure 5.8). The summer median value of the total biomass was between 0.56 and 0.87 mg dry matter/l during the monitoring period. If the total biomass is subdivided into species it is seen that the proportion of Daphnia spp. was relatively high, however, without any substantial change in the biomass throughout 1989-96.
The ability of zooplankton to "graze down" phytoplankton has thus not risen during the monitoring period. The median grazing pressure has been between 10 and 20% of the total phytoplankton biomass. Large specific differences do, however, exist between the development and occurrence of zooplankton in individual lakes.
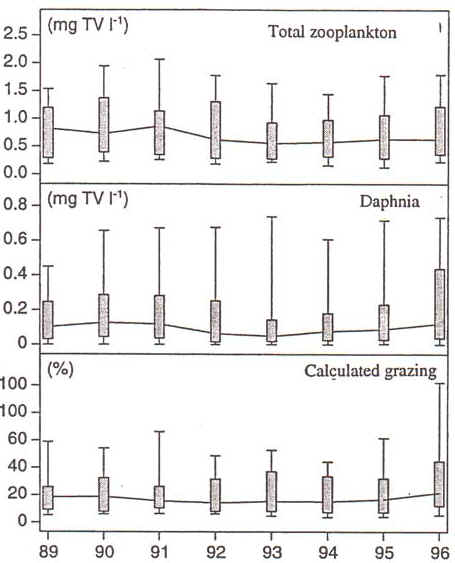
Figure 5.8
Summer average zooplankton total biomass (mg TV/l), Daphnia spp. biomass (mg TV/l) and
grazing of phytoplankton (%) (Jensen et al., 1997a).
No change in extent of aquatic plants
Studies of the extent and composition of aquatic plants in the monitored lakes were not started until 1993. Since the, there have been no significant changes in how much of the lakes is occupied by aquatic plants (RPV). Similarly, there have been no substantial changes in their coverage of the lake bottoms (RPA) or their scope for growth in deeper or shallower water (depth limits) (Figure 5.8). At individual lake level, however, there were year-to-year variations in these parameters.
Table 5.6
General tendencies for changes in the relative plant-filled volume (RPV) of aquatic
plants, relative plant-covered area (RPA), and depth limits of aquatic plants between 1993
and 1996. 0 denotes an unchanged situation, + and – denote positive and negative
statistically certain trends, respectively (Jensen et al., 1997a)
| Lake | RPV | RPA | Depth limit |
| S�by Lake | 0 | 0 | - |
| Magles� Lake | 0 | + | 0 |
| Madum Lake | 0 | 0 | 0 |
| Nors Lake | 0 | 0 | - |
| Ravn Lake | 0 | 0 | + |
| S�holm Lake | 0 | 0 | 0 |
| Kvie Lake | 0 | 0 | 0 |
| Hornum Lake | 0 | 0 | 0 |
| R�gb�lle Lake | 0 | 0 | 0 |
| Fures�en | 0 | 0 | 0 |
| F�rup Lake | 0 | 0 | 0 |
| Damhuss�en | 0 | 0 | 0 |
| Hinge Lake | 0 | 0 | 0 |
| Tiss� | 0 | 0 | 0 |
| Arreskov Lake | + | + | 0 |
| Utterslev Mose West | 0 | + | 0 |
| Utterslev Mose East | 0 | 0 | 0 |
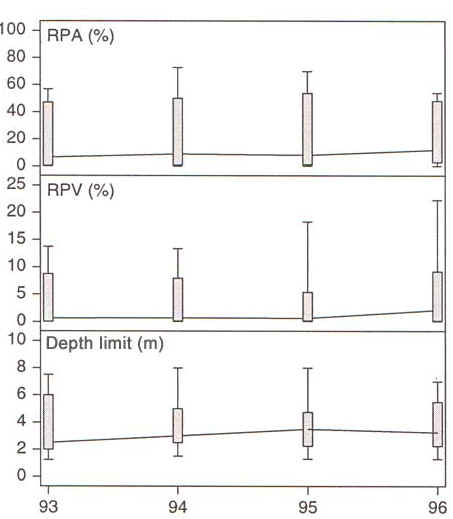
Figure 5.9
Trend in average coverage (% RPA), average plant volume (% RPV) and depth limit (m) of
aquatic plants 1993-1996 (Jensen et al., 1997a).
Few studies of fish population development in lakes
Development in fish populations have only been studied in few lakes. These studies have been undertaken specially in lakes where intervention in the fish population has been carried out to improve conditions in the lake. In the absence of such an intervention, the composition of species is unlikely to change significantly over a few years.
One example of such a study is from Vejle county, where the fish population in Engelsholm Lake was studied in 1990 and again in 1992-96. In 1992 the county removed unwanted non-predatory fish such as roach and bream to improve the environmental conditions. About 20 tonnes of fish were removed over two years, reducing the fish biomass to about 12-17 tonnes.
This intervention resulted in the bream nearly disappearing followed by a rise in the biomass of ruff, trout and roach. After the removal trout comprise about 25% of the lake’s predators.
The improved water quality in Engelsholm Lake as a result of the bio-manipulation has not been stabilised due to the absence of aquatic vegetation and excessive phosphorus load. Conditions will thus presumably return to those before the action was taken (Hald M�ller, 1997).
Deliberate changes to fish populations do thus not often give rise to the intended improvement in environmental conditions unless phosphorus inputs are reduced as well.
Completely clean lakes today threatened by nutrient enrichment
Completely clean low-nutrient lakes are today threatened by nutrient enrichment, especially from atmospheric deposition, which is responsible for as much as 17% of the nitrogen loading of the monitored lakes. This nutrient load can tilt a clean lake’s condition by an increase in plant biomass, reduced light penetration through the water and increased oxygen depletion at the bottom of the lake. The Secchi depth in one of Denmark’s cleanest lakes, Grane Langs�, has been reduced from 12 m in the 1950s to about 6.5 m in the 1980s (Riis et al., 1996). In the long term this eliminates the basis of the rare flora and fauna of low-nutrient lakes.
To preserve our cleanest lakes in future, it will probably become necessary to take steps to reduce nutrient inputs to lakes, especially from atmospheric deposition.
Loading due to ammonia evaporating from farmyard manure is one of the problems to be addressed.
5.5.1 Lake restoration
In the last 5-10 years, attempts have been made to support the development towards bringing nutrient-rich lakes into a satisfactory environmental condition with clear water and extensive benthic flora by restorative measures. There are several methods by which lakes may be restored. Removal of roach and bream followed by stocking with predators, removal of sediment and planting of benthic vegetation are examples of such measures.
Bio-manipulation by means fish populations
Many counties have manipulated fish populations in nutrient-rich lakes. Thus, 15 such interventions have been made since 1986 (Jensen et al., 1997a). Stocking with predators is one manipulation method to be used where nutrient input to a lake has been reduced and where the number and thus also the biomass of fish such as roach need to be reduced. The biological consequence of stocking is eventually clear water and increased spread of benthic flora.
Experiments in Lyng Lake have shown that introducing pike fry at densities of up to 2,000 per hectare can affect the biological structure (S�ndergaard et al., 1996). A positive correlation was established between the stocking with pike and reduced phosphorus concentration in the water and an increase in the zooplankton biomass, which will in the long term improve environmental conditions in the lake. Provisional results indicate that the phosphorus level should be lower than 0.05-0.1 mg/l in the future equilibrium in order to make the changed conditions stable and thereby permanent (Jensen et al., 1997a). Studies over the coming years will attempt to elucidate whether the alterations and thus the improved environmental conditions in bio-manipulated lakes are permanent.
But as the pike stocked mainly eat smaller roach, the method is not directly suited to remove larger, older fish, which despite stocking with pike are still free to produce large numbers of fry again. For this reason, many counties remove roach or bream before stocking with predators. In nutrient-rich lakes where the predator population is assessed to be good, bio-manipulation often consists only in removal of unwanted fish.
Lake restoration by dredging of sediment
There is often a large reservoir of phosphorus in the benthic sediment of nutrient-rich lakes, which is continually released to the water resulting in algal blooms. A reduction in phosphorus inputs from cultivated areas, waste water outfalls, etc. will often not have the desired effects in lakes. The internal reservoir of phosphorus can be removed by dredging and removal of the sediment.
Attempts to reduce the reservoir of phosphorus by dredging have unfortunately not produced the desired reductions in impact on the environment by the internal phosphorus load (J�rgensen & Skovg�rd, 1997). One explanation could be that sediment not previously accessible may, as a result of the dredging, liberate phosphorus from the new sediment surface.
Conclusions on the environmental condition of the monitored lakes
Summing up, it can be concluded that the environmental condition of the lakes monitored is strongly affected by nutrient loading. In the period 1989-96 there has been a small reduction in phosphorus loading (especially in the most polluted lakes), a small reduction in concentrations of total phosphorus, chlorophyll-a, and phytoplankton, and a small increase in Secchi depth. The amount and occurrence of zooplankton and aquatic plants has remained unchanged during the same period.
The results show a slight tendency towards improved environmental conditions in the lakes.
5.5.2 Objectives for Danish lakes
Targets for quality and utilisation of lakes are set by county councils in their regional plans.
Many high targets for lakes
A national survey of the use of target setting shows that the B target is the commonest (Table 5.6). 95% of the lakes have either basic or strict targets, showing that the counties wish to preserve the lake environment.
Table 5.7
Distribution of strict, basic and modified targets for the Danish lakes in 1996.
Targets |
|||
| A (strict) | B (basic) | C (modified) | |
| Number | 259 | 402 | 37 |
| Percent | 37 | 58 | 5 |
The counties’ monitoring includes checks on whether objectives are being met.
28% targets met in 1996
In 1996, the counties carried out monitoring to a varying degree in a total of 225 lakes with a view to assessing target compliance which could only be assessed in 209 of these, out of which only 28% met their targets in 1996.
34% targets met in 1994-96
Between 1994 and 1996, the counties assessed whether all the 698 Danish lakes with targets set actually met their targets. The proportion found was 34% (Jensen et al., 1997a).
Compliance rises from target C to A (Table 5.7), i.e. it is highest in A-targeted lakes, nearly half of which comply. Despite the fact that in the case of modified targets it is acceptable that the ecological condition of a lake is affected by outfalls, only 16% of such lakes met the objective.
Table 5.8
Distribution (%) of target compliance for A, B and C targeted lakes 1994-96.
Target |
|||
| A (strict) | B (basic) | C (modified) | |
| Number | 259 | 402 | 37 |
| Target met (%) | 46 | 26 | 16 |
High target compliance in small lakes
Degree of compliance is also related to lake size. It has been found that target compliance coincides with decreasing lake size. In the case of lakes less than 3 ha in area, 48% meet their objectives, while in the case of lakes over 3 km� only 8.3% do (Jensen et al., 1997a). This difference probably arises because it is easier to implement sufficient measures in small lakes to bring it to its target level. For example, it would take far greater efforts to combat the diffuse nutrient loading from a large catchment of a large lake compared with a smaller one.
The counties’ regional monitoring does not indicate any development in target compliance between 1990 and 1996 (Figure 5.8).
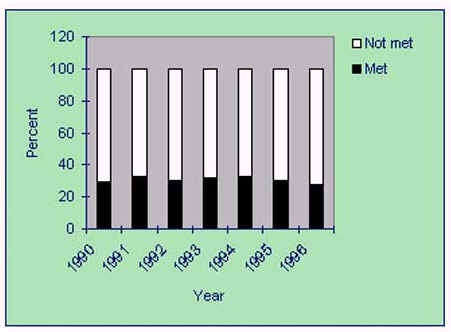
Figure 5.10
Development of meeting lake targets determined by regional monitoring in 1990-96.
Reasons for lack of improvement in target compliance
The reductions achieved in nutrient loading of lakes, with little resulting improvement in environmental condition of the lakes, have often not been sufficient for the lakes to meet the objectives set in the regional plans. Current nutrient inputs from cultivated areas and point source outfalls together with the internal phosphorus loading from nutrient-rich lakes are considered to be the reasons for this lack of improvement of the environmental condition of the lakes.
Further measures against nutrient sources
Several counties point out a need for further measures against nutrient inputs, and that many lakes need restoration to be able to meet their objectives. Marked improvements can presumably only be achieved by further reductions in phosphorus loading from open land such as cultivated areas and sparsely populated areas.
Phosphorus loading can be reduced at source and by re-establishment of water meadows along lakes and watercourses.
The revised Rural Waste Water Treatment Act (1997) has provided a basis for further reducing phosphorus discharges from sparsely populated areas over the coming years.
Standardisation of lake monitoring programmes
Today, the monitoring of lakes is differing from county to county. Thus, there are great variations in choice of methods, selection of stations, sampling times, etc. in the regional supervision. For example, about 200 lakes out of the more than 600 lakes with targets set are checked for target compliance every year. This means that any national overview of developments in the environmental condition in lakes and target compliance registered by the regional supervisory authority is to be treated with great caution, if indeed such a data processing is possible at all.
For this reason, there is a need to standardise the regional monitoring programme for lakes including differentiated supervision of a larger number of lakes in a fixed network of stations, so that in future it will be possible to provide a true nation-wide picture of the development of the environmental conditions in Danish lakes.
Supervision of small ponds
The counties’ supervision does not today, unfortunately, cover small lakes and ponds, which is regrettable because they are vital habitats for a great range of protected flora and fauna such as amphibians. This lack of supervision means that there is not enough information available to describe the environmental condition of bodies of water of less than 1 ha. With the increasing interest in restoring polluted, small ponds and establishing new ones, a standard classification system needs to be developed over the coming years to record and describe the condition of small lakes and ponds so that development trends resulting from various environmental improvement measures can be tracked.
5.6 Scenarios
Further measures are needed to address nutrient inputs from cultivated areas and from sparsely populated areas to enable more lakes to achieve their target conditions in the coming years.
By, for example, halving phosphorus inputs from the open land, the majority of lakes in the monitoring programme would achieve Secchi depths of about 4 metres (Jensen et al., 1997a).
A 50% reduction in phosphorus input from waste water alone would be enough to improve visibility in about half of the lakes to over 2 m.
The conclusion is therefore that satisfactory meeting of lake quality objectives in the lakes monitored depends on efforts to reduce phosphorus inputs from cultivated areas and sparsely populated areas.
[Front page] [Contents] [Previous] [Next] [Top] |