|
The Aquatic Environment in Denmark 1996-1997
6. The state of the environment in Danish fjords
The fjords are one of the most characteristic Danish natural features. As so many other notable elements of the appearance of the country, they are chiefly a result of the impact of the Glacial Age. The eastern Danish fjords were created by melt waters which, during the retreat of the ice, eroded deep valleys in the landscape. The lower reaches of the valleys now lie beneath the surface of water and form the fjords. Such a fjord is in most cases more or less wedge-shaped with a wide opening towards the open waters and a watercourse at the upstream end. Some of the fjords and bights discussed in this report were, however, created in another way, for example by material transport along a length of shoreline cutting off a bight or cove. Figure 6.1 shows the fjord areas discussed in this report.
Figure 6.1
Map of selected fjords
The chapter begins with a short review of the public interests and activities associated with the fjords and the resultant impact. Then comes an account of the administration of the state of the fjord environment. The following section contains a description of the physical conditions which form the basis of the environmental conditions in the fjords. The chapter concludes with a description of the status and development of the fjords’ environmental conditions.
6.1 Utilisation and impact on Danish fjords
The Danish fjords are important from both recreational and occupational viewpoints. They function as breeding and nursing grounds for many species of fish and birds, and as transport routes to coastal towns. The activities associated with the fjords and their consequences are described below.
6.1.1 Fisheries and fish farming
A great deal of the Danish fishing previously took place in the fjords. The importance of herring-fishing to the development of the towns along Limfjorden is well known. These days, only a small proportion of commercial fishing takes place in the fjords, whereas recreational fishing is very intense.
Intensive fishing for common mussels takes place in Limfjorden, the Wadden Sea and some of the fjords of East Jutland. Fishing is by means of bottom-scraping devices, which can affect or damage bed conditions in the areas worked. Damage to eelgrass in Limfjorden has been noted in several places (The Limfjorden monitoring, 1996)
A great deal of the marine and salt-water fish farms are located in the fjords. Table 6.1 lists the location of fish farms in Danish fjords.
Table 6.1
Summary of the number of marine fish farms, salt-water fish farms and other
aquaculture in the theme fjords studied in 1995.
Fjord |
Marine |
Salt-water |
Other |
| Vejle fjord | 1 | 0 | 0 |
| Horsens fjord | 4 | 0 | 11) |
| Kolding fjord | 2 | 0 | 0 |
| Ringkřbing fjord | 0 | 8 | 12) |
| Limfjorden | 0 | 0 | 33) |
| Kalundborg fjord | 0 | 1 | 0 |
| Isefjord | 0 | 0 | 14) |
| Ĺbenrĺ fjord | 0 | 1 | 0 |
| Total | 7 | 10 | 6 |
1) Breeding of Pacific oysters. 2) Illuminated breeding plants 3) Illuminated breeding plants and breeding of oysters and mussels. 4) Oyster breeding.
The environmental effects of marine and salt-water fish farms are associated with emissions of nutrient salts and especially the local effects of organic matter.
6.1.2 Utilisation of raw materials
Extraction of raw materials (sand, gravel, stone, shells) in Danish waters is regulated by the Raw Materials Act. Between 4 and 8 million m3 per year are extracted. The large variations are primarily due to periodical supplies of sand fill for large construction projects.
In 1996, the Raw Materials Act was amended on a number of points. The changes mean, among other things, that as from January 1997, raw materials extraction may only occur in designated areas where an environmental impact assessment has been undertaken. To ensure compliance with the Constitution and a smooth changeover from the previous practice, whereby extraction could in principle take place anywhere, a ten-year transitional period has been decided on for pebble and sand suction dredging in those areas where extraction has taken place over many years. These transitional arrangements will cover approx. 110 areas in the North Sea and the inner Danish territorial waters.
Most of the transitional areas will be in the open sea and only a few individual areas, mainly for local supplies, will be in fjord areas.
About 30 areas will be allocated to boulder fishing. None of these will be near fjord areas.
Raw materials extraction in EU bird sanctuaries and Ramsar sites was prohibited in 1994, although a phasing-out arrangement has been made for pebble and sand suction dredging in a small number of areas, primarily in Nissum Bredning. Shell extraction in Roskilde fjord will be phased out at the end of 1997.
Effects of raw materials extraction in fjords
Extraction of sand, gravel and boulders is carried out by sucking up material from the sea bed using a hydraulic pump. Point suction forms a hole, the size of which depends mainly on the amount of material won and the depth of the deposit. When drag suction is used, elongated grooves about 1.5 m wide and 30-50 cm deep are formed. Intensive extraction causes a general sinking of the sea bed over large areas.
During the extraction process, the finest grained material is usually returned to the sea with the wash water. The process causes a certain liberation of nutrients from the sediments.
Extraction mainly takes place in unpolluted sea bed sediments, where liberation of e.g. nitrogen is usually of the order of 0.5-10 g N/m3 of materials dredged. Liberation of heavy metals is insignificant.
Apart from areas in the western part of Limfjorden, Grřnsund and Roskilde fjord, no significant raw materials extraction occurs in the actual fjord areas, and the total environmental impact on the aquatic environment will therefore be insignificant.
6.1.3 Disposal of dredging materials
Of the 83 disposals of dredging materials which took place in Danish waters in 1995, only 15 were in fjords. This involved less than 10% by weight of the amounts disposed of.
Vejle Fjord: Two small volumes of dredging materials were disposed of in the outer part of the fjord. The material was unpolluted.
Ringkřbing Fjord: Three small volumes of dredging materials were disposed of in the fjord. Most of the dredging materials from the area are disposed of in the North Sea. The material was unpolluted.
The Jutland Wadding Sea: About 263,800 tonnes of dredging materials were disposed of in three places in Grĺdyb tidal zone. Most of it originated from Esbjerg and was disposed of immediately outside the harbour. Totally this material consisted of 17 kg of mercury, 37 kg of cadmium, 3.4 tonnes of chromium, 1.9 tonnes of copper, 13 tonnes of zinc and 3.4 tonnes of lead.
Isefjord: Only one minor disposal of dredging materials took place in 1995.
Aabenraa Fjord: In 1995 there were 150,000 tonnes in the fjord. As the material was deemed to be unpolluted, no analyses are available.
Limfjorden: Six disposals of dredging materials took place in the whole of the fjord, totalling about 215,000 tonnes. A large part of the material originates from annual dredging of shipping fairways and of harbour mouths. The dredged sea bed materials consists of coastally transported sediments, which according to experience are unpolluted.
A temporary physical covering over of plant and animal life will, of course, occur at a disposal site, but migration of animals will quickly begin after the disposal has ceased. On permanently used disposal sites, the animal life will at short intervals be wiped out/covered over.
No increased levels of heavy metals or contaminants have been demonstrated in Danish fjords as a result of disposal of dredging materials. This may be attributed in part to scant monitoring of the disposal grounds and their surroundings, but reflects to a higher degree that material is only permitted to be disposed of when they are judged to be unproblematic in relation to the marine environment. Similarly, no oxygen depletion in Danish fjord areas has been directly associated with disposal of dredging materials.
6.1.4 Archaeology
The Danish sea and fjord beds are a repository to a great many cultural relics, partly from the period in the Stone Age when the areas were dry land (settlements) and partly from the exploitation of the sea over many years (prehistoric fishing equipment, harbour and defence constructions as well as wrecks). All such finds, provided they are more than 100 years old, are protected under section 14 of the Danish Protection of Nature Act. Finds may neither be removed nor destroyed without the permission of the Minister for the Environment.
The National Forest and Nature Agency estimates that there are about 20,000 historical wrecks, a similar number of Stone Age settlements and approx. 5,000 harbour and defence constructions on the Danish sea bed. A great many of these will be found in the fjords, which in the Stone Age as well as in historical times were attractive areas to settle in, easy to protect with relatively simple defence systems and hard to navigate.
No systematic recording has taken place in the fjords and so no table has been prepared, since the number of finds would differ significantly from the actual number of items.
The archaeological finds made in the Danish fjords are often of significant historical interest because the sedimentation that occurs in the fjords and the calm settlement conditions preserve the items. Understanding the cultural environment of the fjords through time and the changing usage of the fjords will often depend on the knowledge provided by marine archaeological finds.
Generally, the archaeological remains are well protected on the beds of the Danish fjords, but increasing intensity of exploitation of the fjords in recent years may under certain circumstances mean that historic monuments are at risk of destruction. Deepening or straightening of shipping fairways and actual construction work often affect a historic monument, but it is very rare for the monument to be of such a nature that the work must be moved or abandoned. Archaeological documentation of the find before it is removed will most often be sufficient.
6.1.5 Waste water outfalls
The number of waste water outfalls is described in the chapters on point source discharges and inputs to marine areas.
6.1.6 Bathing
Of Denmark’s approximately 7,000 km of coastline, about 5,000 are suited for bathing. The quality of bathing waters is monitored at some 1,300 monitoring stations spread along the sea coast, in fjords and in lakes. Bathing waters are regularly examined to protect bathers from illness and to check whether pollution of the waters occurs, and in the event of pollution to identify the source and stop the pollution.
6.2 Administrative matters
6.2.2 Setting of quality objectives
Under the Planning Act, counties are responsible for establishing through the regional plans the environmental quality and usage of coastal waters. One aim of the Act is to ensure that community development can occur in a sustainable manner. This means that determination of the environmental quality in a given water body is very much a political issue.
Water area plans
Water area plans form the basis of the regional plans and often contain the following parts:
| A description of the natural state of the area. | |
| A description of the current state. | |
| An account of the community exploitation of the area e.g. for waste water outfalls, bathing waters, etc. | |
| Establishment of the desired environmental quality (objectives) based on weighing of the various exploitation interests. | |
| An evaluation of the initiatives necessary to achieve the desired environmental quality. | |
| A description how achievement of the objectives can be monitored. |
The target-setting system operates with three possible target levels:
- A general target implies that the area is unaffected or only mildly affected by human activities. There must be a varied flora and fauna, good hygienic water quality, good light conditions, good oxygen conditions and little or no trace of toxic matter in water sediments and organisms. It is assumed that the general target is used unless particular circumstances apply.
- In areas where particular community interests in the usage of the water area mean that general objectives cannot be met, a modified objective may be set. This may for example be the case in the immediate vicinity of a waste water discharge point or in a harbour. The activity which means that the general target level cannot be achieved must be stated along with the degree and manner in which a lowering of the environmental quality is acceptable.
- A stricter target may be set for certain areas which are particularly vulnerable, either because of their special environmental importance or because the usage of the area demands a particular environmental quality. For bathing beaches, for example, a stricter target will often be set. This does not mean that the environmental quality in such an area need be higher than in a general target area, but that stricter monitoring shall be applied to check compliance.
6.2.3 Bathing water requirements
Bathing water areas are regulated by the Statutory Order on bathing waters and beaches (No. 292 of July 23, 1983), which implements the EU bathing waters Directive of 1976. Local authorities are responsible for checking bathing waters and for ensuring that samples of bathing waters are drawn for microbiological testing. Locations and numbers of sampling stations are decided by the local authority councils in conjunction with the counties. Should a deterioration in water quality be ascertained, the local authorities are required to undertake further tests and, should it prove possible to identify the source of deterioration, to undertake preventive measures. Should it not be possible to alleviate a confirmed pollution to acceptable levels, the local authority, in consultation with the medical officer of health and the county, will prohibit bathing. Such a prohibition will only be rescinded when it can be documented that the pollution has ceased and that it is safe to bathe in the water.
On average 10 samples per bathing water station have to be drawn during the bathing season running from May to October. The marine stations are examined for E. coli and freshwater stations for E. coli and total coliform bacteria. In addition, visual inspections have to be made to assess whether the bathing waters have been polluted by the presence of surface-active substances, algae or suchlike. Should there be any suspicion of the presence of other micro-organisms than those routinely tested for, the testing programme is widened to cover the relevant organisms. For example, where the waste water outlet from an abattoir is concerned, tests might be undertaken for salmonella/camphylobacter at the bathing water stations adjoining the outlet. Vibrio parahaemolyticus might similarly be tested for at a bathing water station near a fish farm.
There was a total of 1,300 bathing water stations in 1995, of which 110 are freshwater sites (in lakes), and about 16,000 tests were made. 19 areas were subject to bathing prohibitions compared with 22 the previous year.
In general, it can be said that bathing water quality has improved and that by national and international standards compliance of the bathing water with the values set is high.
6.2.4 Ramsar sites, bird sanctuaries and habitats
In 1979, on accession to the Ramsar convention, Denmark designated 27 Ramsar sites, followed in 1983 by 111 bird sanctuaries under the EU bird protection Directive. All Ramsar sites are wholly contained within the bird sanctuaries, and their boundaries coincide.
Designation of EU bird sanctuaries aims at preventing pollution or deterioration of the areas as habitats for and disturbance of the birds, to the extent that such pollution, deterioration or disturbance has significant effects on the protected species. Since adoption of the EU habitat Directive Denmark has proposed the designation of a number of habitats. The EU habitats are expected to be covered by the protection requirements applying to the EU bird sanctuaries, but on a different basis as to the species or aspects of nature motivating the designation.
Ramsar sites
25 of Denmark’s 27 Ramsar sites are more or less marine and 15 of these lie wholly or partly in the fjord areas covered by this report. Approx. 1,500 km2 or 25% of the approx. 6,000 km2 of marine Ramsar sites are in fjords, covering about 32% of the water area of about 4,750 km2 (Limfjorden, Isefjord and Roskilde fjord are included in their entireties).
Bird sanctuaries
51 of Denmark’s 111 EU bird sanctuaries are more or less marine and 32 of these lie wholly or partly in the fjord areas mentioned. Approx. 2,100 km2 or 29% of the approx. 7,175 km2 of EU bird sanctuaries are in fjords, covering about 44% of the water area.
Habitat areas
30 of the above-mentioned 32 EU bird sanctuaries have also been proposed as EU habitat sites and cover approx. 2,075 km2 of the fjord areas. It is a question of 21 of a total of 175 areas, of which 50 are marine and cover approx. 7,412 km2 and 35 are also EU bird sanctuaries. The extent of Ramsar sites, bird sanctuaries, and habitat areas is specified in Table 6.2.
Table 6.2
Survey of Ramsar areas, bird sanctuaries, and habitats
| Number | of which marine |
of which in fjords |
Area (marine) |
of which in fjords |
|
number |
km2 |
||||
| Ramsar | 27 | 25 | 15 | 5,996 | 1,519 |
| EU bird protection area | 111 | 51 | 32 | 7,176 | 2,109 |
| EU habitat area | 175 | 50 | 21 | 7,412 | 2,075 |
6.2.5 Marine nature and wildlife reserves
Wildlife reserves are established in accordance with the Hunting and Wildlife Management Act. The aim is to protect and encourage populations of wild birds and mammals.
Nature reserves are set up in accordance with the Protection of Nature Act. Under section 51 of this Act, conservation may be granted to state-owned areas and in Danish territorial waters (the fisheries territory). One is to protect nature with its populations of wild animals and plants and their habitats.
On September 1, 1996, there were 91 protected areas (nature and wildlife) with a total area of 278,756 ha, of which 247,804 ha or more than 80% are marine. Protected areas vary in size, some being quite small. The Jutland Wadding sea, which has the status of both nature and wildlife protected area, covers 90,000 ha and is thus the largest protected area in Denmark.
In connection with the passing of the Hunting and Wildlife Management Act, which came into force in 1994, it was decided that the protection of migratory waterfowl in the coastal EU bird sanctuaries should be enhanced by the establishment of new protected areas or expansion of existing ones.
The National Forest and Nature Agency is about halfway through its task of expanding the network of protected nature areas. The total area classified as reserves has grown by 45,000 ha in three years. A similar or slightly lower growth can be expected over the coming years.
6.3 Physical conditions in the fjords
The Danish fjords cover a wide spectrum in terms of topography, hinterland, freshwater inputs, etc. The topography is the foundation of the meteorological, hydrographic and man-made variations which affect the state of the environment. In other words, it is impossible to give a meaningful description of the environmental state without a thorough knowledge of e.g. depth and weather conditions, etc. Table 6.3 outlines the physical characteristics of a large number of Danish fjords.
Table 6.3
Mean depth, maximum depth, area, volume, mean freshwater run-off in the period 1989 to
1995 plus catchment areas for a number of Danish fjords.
Fjord No. and name |
Mean depth |
Max. depth |
Area |
Volume |
Run-off |
Catchment area |
m |
m |
km2 |
km3 |
mill.m3/ year |
km2 |
|
| 1 Roskilde Fjord | 3 |
31 |
123 |
0.360 |
476.2 |
1176 |
| 2 Karrebćk Fjord | 3 |
6 |
14.8 |
0.044 |
1308.7 |
1110 |
| 3 Vejle Fjord | 8.3 |
21 |
62 |
0.515 |
1223.6 |
732 |
| 4 Horsens Fjord | 2.9 |
22 |
46 |
0.132 |
526.7 |
449 |
| 5 Kolding Fjord | 5.2 |
15 |
14.7 |
0.077 |
633.9 |
367 |
| 6 Dybsř Fjord | 1 |
2 |
17.5 |
0.018 |
52.3 |
44.6 |
| 7 Guldborg Sound | 3 |
11 |
81.7 |
0.245 |
445.0 |
437 |
| 8 Guldborg Sound B | 2.5 |
4 |
30.3 |
0.076 |
196 |
|
| 9 Nakskov Fjord | 2.5 |
7 |
42.7 |
0.107 |
355.7 |
236 |
| 10 Sřnder Cove | 1 |
2 |
8.9 |
0.009 |
2.0 |
1.3 |
| 11 Stege Bight | 2.4 |
18 |
42 |
0.101 |
33.1 |
31.6 |
| 12 Stege Cove | 1.4 |
4 |
5.2 |
0.007 |
19.9 |
18.8 |
| 13 Nysted Cove | 1.5 |
3.5 |
0.9 |
0.001 |
15.5 |
|
| 14 Sakskřbing Fjord | 2.5 |
4 |
21.1 |
0.084 |
224.9 |
247 |
| 15 Avnř Fjord | 5 |
11 |
41.1 |
0.206 |
122.7 |
138 |
| 16 Vĺlse Inlet | 1.5 |
3 |
7.1 |
0.011 |
32.3 |
|
| 17 Prćstř Fjord | 2.7 |
6 |
21.8 |
0.059 |
170.9 |
148 |
| 18 Nissum Fjord | 1 |
2.5 |
75 |
0.084 |
2986.1 |
1666 |
| 19 Ringkřbing Fjord | 1.9 |
5 |
294 |
0.557 |
6508.7 |
3442 |
| 20 Grĺdyb tidal zone | 2.6 |
14 |
138 |
0.235 |
3096.5 |
1798 |
| 21 Ebeltoft Inlet | 16 |
84.4 |
60.5 |
|||
| 22 Randers Fjord | 1.6 |
7 |
21.6 |
0.034 |
2317.9 |
3260 |
| 23 Aarhus Bight | 12 |
22 |
315 |
3.8 |
357.0 |
659.3 |
| 24 Norsminde | 0.6 |
2 |
1.86 |
0.0011 |
32.2 |
101 |
| 25 Mariager Fjord | 4.9 |
29 |
47.7 |
0.234 |
302.7 |
587 |
| 26 Stavns Fjord | 1.8 |
8.7 |
15.6 |
0.0293 |
25.3 |
|
| 27 Odense Fjord | 2.3 |
7 |
60.3 |
0.136 |
690.6 |
1057 |
| 28 Kerteminde Fjord / Kertinge Cove | 1.9 |
7.7 |
8.34 |
0.0162 |
20.8 |
53.5 |
| 29 South Funen Archipelago | 8.5 |
38 |
415 |
3.52 |
321.7 |
436 |
| 30 Holckenhavn Fjord | 1.1 |
3.8 |
0.69 |
0.0008 |
145.1 |
221 |
| 31 Lindelse Cove | 2.1 |
6.2 |
6.7 |
0.014 |
19.2 |
31.5 |
| 32 Nakkebřlle Fjord | 3.2 |
10 |
7.3 |
0.023 |
78.8 |
103 |
| 33 Helnćs Bight | 5.4 |
15 |
65.6 |
0.353 |
107.2 |
183 |
| 34 Bredningen (the Broad) | 0.5 |
1 |
0.28 |
0.0001 |
75.7 |
111 |
| 35 Gamborg Fjord | 2.4 |
14 |
10.4 |
0.025 |
34.7 |
53 |
| 36 Faaborg Fjord | 4.8 |
11.3 |
11.8 |
0.057 |
15.6 |
27.8 |
| 37 Gamborg Cove | 0.8 |
0.8 |
0.208 |
0.0002 |
18.9 |
32.4 |
| 39 Tryggelev Cove | 1.78 |
4.7 |
0.0644 |
0.00007 |
5.4 |
10.04 |
| 40 Nćrĺ Beach | 0.31 |
1 |
4.82 |
0.0015 |
22.1 |
74.6 |
| 41 Kelds Cove | 0.4 |
1.1 |
1.03 |
0.0004 |
1.3 |
2.23 |
| 42 Tybrind Inlet | 6.1 |
12.2 |
10 |
0.062 |
24.1 |
39.5 |
| 43 Emtekćr Cove | 0.5 |
1 |
0.81 |
0.0004 |
6.6 |
10.9 |
| 44 Skĺrupřre Sound | 1.2 |
7 |
2.58 |
0.0032 |
5.8 |
9.5 |
| 45 Thurř Head | 2.6 |
10 |
1.32 |
0.0034 |
1.3 |
2.1 |
| 46 Lunke Bight | 3.8 |
8.4 |
11.1 |
0.04 |
10.7 |
17.6 |
| 47 Nyborg Fjord | 5.29 |
11.6 |
8.37 |
0.0044 |
160.5 |
243.5 |
| 48 Tempelkrog | 1.5 |
5.6 |
4 |
0.006 |
87.5 |
57.09 |
| 49 Holsteinborg Cove | 0.8 |
4.4 |
7 |
0.0056 |
13.8 |
16.04 |
| 50 Basnćs Cove | 0.8 |
2.5 |
9 |
0.0072 |
28.1 |
39.89 |
| 51 Skćlskřr Fjord | 1.5 | 4 | 1.8 | 0.0025 | 14.3 | 17.88 |
| 52 Korsřr Cove | 1.8 | 2.5 | 8 | 0.014 | 23.5 | 29.49 |
| 53 Kalundborg Fjord | 9.5 | 17.9 | 79 | 0.75 | 41.0 | 65.06 |
| 54 Isefjord | 5.1 | 15.2 | 307 | 1.56 | 719.3 | 734 |
| 55 Isefjord outer Broad | 6 | 15.2 | 212.6 | 1.214 | 74.5 | 64.52 |
| 56 Nykřbing Bight | 3 | 6.2 | 12.4 | 0.036 | 26.6 | 36.48 |
| 57 Lammefjord | 5 | 12.9 | 20 | 0.1 | 283.5 | 296.25 |
| 58 Isefjord inner Broad | 4 | 11.6 | 42 | 0.168 | 83.5 | 93.38 |
| 59 Holbćk Fjord | 2.6 | 11 | 14 | 0.036 | 163.5 | 176 |
| 60 Hjarbćk Fjord | 1.9 | 5 | 25 | 0.047 | 372.8 | 1180 |
| 61 Halkćr Broad | 1 | 1.5 | 6.1 | 0.0081 | 271 | |
| 62 Skćlskřr Cove | 3 | 5.8 | 2.3 | 0.0067 | 6.3 | 7.91 |
| 63 Skive Fjord LovnsBroad etc. | 4.9 | 19 | 151 | 0.748 | 849.2 | 2420 |
| 64 Flensborg Fjord | 14.5 | 40 | 272 | 4.11 | 44.7 | 214.7 |
| 65 Haderslev Fjord | 1.8 | 10 | 3.9 | 0.009 | 45.5 | 184.8 |
| 66 Aabenraa Fjord | 23 | 35 | 31.2 | 0.622 | 21.8 | 82.2 |
| 67 Genner Fjord | 14 | 23 | 4.48 | 0.054 | 7.4 | 39 |
| 68 Augustenborg Fjord | 4.4 | 14 | 13.7 | 0.07 | 15.5 | 94.7 |
| 76 Limfjorden | 4.9 | 28 | 1500 | 7.4 | 11037.6 | 7590 |
Depth of water
Depth conditions in the selected fjords vary from the very shallow fjords with depths of 1-2 m, such as Ringkřbing fjord and Norsminde Fjord south of Aarhus to the very deep ones such as Mariager Fjord (30 m) and Flensborg Fjord. Even though depths of more than 10 m are found in many fjords, such areas are often small so that the mean depths are usually significantly less.
6.3.1 Hydrographic conditions
Water is not just water. There can be great variations in salinity, temperature, turbidity, etc. These conditions are of great significance to the organisms which live in a specific body of water.
Salinity
In Danish waters salinity is generally least in the southern part near the Baltic and higher nearer the North Sea and the Atlantic Ocean. Salt-water is denser than freshwater and cold water is denser than warm water. Bodies of water with different salinities and temperatures will therefore have different densities. In the absence of strong winds or currents to mix them, the two bodies will tend to separate themselves so that the water nearer the bottom has no contact with the air above. The water area is said to be stratified..
In comparison with water in the open sea, the fjords are generally less saline due to the input of water from watercourses. In all fjords receiving freshwater input, there will naturally be a surplus of water which will flow towards the open sea. However, in most fjords, this volume of water is very small compared with the volumes of water flowing in and out due to tides or winds.
Temperature
As a fjord comprises a relatively small water mass, the water temperature is more a function of the air temperature than is the case with the open sea. This means that, other things being equal, the fjord waters will be colder in winter and warmer in summer.
Circulation
In a fjord the hydrography, i.e. the current patterns and physical composition of the water, is determined by three conditions in particular: the topography of the fjord, freshwater inputs and variations in water level.
It has turned out in practice that fjords and estuaries can be divided into three types depending on the relationship between freshwater run-off and water level variations due to either tide or wind.
If freshwater inputs are large and there is little variation in water level, the freshwater will be found to flow out above the salt-water, the two bodies hardly mixing. Seen as a vertical section along the fjord, the salt-water will form a wedge along the bottom. The inner part of Randers Fjord is an example of this type of fjord. In areas where the level variations are greater, the greater turbulence will lead to more mixing of the layers. As a result of this mixing with bottom water, the outflow at the surface may greatly exceed the original inflow of freshwater. To compensate for this, a mass of water equivalent to the "shortfall" must flow in along the bottom. Such a current pattern is called "estuarine circulation". Hydrographic conditions of this type can be found, for example, in the inner part of Vejle fjord.
If water level differences become relatively even greater, total mixing of the bodies of water can occur and no vertical variation will be seen. Due to the earth’s rotation, the outflowing freshwater will tend to "keep right", leading to a difference in salinity between the sides of the fjord. An example of this type is Haderslev fjord. The same fjord may also change type depending on where in the fjord and at what time the classification is made.
Sill fjords
To meet the scientific definition of a fjord, a shallow sill should be found in the outer part. However, this applies only to a few Danish fjords. The effect of such a threshold is that salt-water can be trapped in the deep water inside the sill, leading to a greater tendency towards stratification than in other types of fjord. In Denmark, only Mariager, Flensborg, and Kerteminde Fjords and to a certain degree Isefjorden are sill fjords.
Shipping fairways and locks
Man-made conditions may also be of significance to the hydrographic conditions in a fjord. Shipping fairways have been dug through shallow waters in many fjords, as for example in Odense Fjord. In such a fjord, a great part of the water movements will take place in the fairways. There is also the special case where the mouth of the fjord is completely closed by a lock, as in Ringkřbing and Nissum Fjords. Here, lock practice completely determines the hydrography.
Sedimentation
The sediment in the fjords originally consists of the materials, which the rivers cut through in times past when the rivers formed the fjords. Subsequently, a superposition of material has taken place either coming from the watercourses or from contiguous sea areas or created in the fjord. Water movements determine where the different materials settle out. The mechanism at work is that only materials coarse enough not to be carried away by currents or waves are deposited in a given spot. This means that in shallow water or narrow channels, subject to wave action or strong currents, the sediment will be coarser than in deeper, calmer waters. Thus it is often only in the deeper sedimentation basins that the bed actually consists of mud, and permanent sedimentation takes place. It is possible to determine how long ago the material at a given depth was deposited. In this way it is also possible to calculate the effect on sedimentation. The annual growth rate in sedimentation areas is often between 1 and 5 mm.
6.4 Conditions and developments in the fjords
This section describes the environmental conditions in the Danish fjords and their development. It is based in particular on the fjord report of the National Environmental Research Institute (Kaas et al., 1996) and on county reports on their respective fjords. This section is broken down into individual parameters: nutrients, phytoplankton, benthic vegetation, oxygen conditions, benthic fauna, and heavy metals and contaminants are dealt with separately. The section concludes with a comparison between the planned condition of the fjords and the condition actually measured. Each parameter is introduced by a brief summary of its environmental significance, followed by a description based on county reports of the current situation in comparative table format. Finally, the different trends are discussed.
6.4.1 Nutrients
The Danish fjords show great variation in their nutrient contents. The current nutrient richness is a result of the balance between addition and removal of the nutrients.
As additions and removals are often out of step, characteristic annual variations in levels of the various substances will be observed. Nutrients are input from land via watercourses or through waste water outfalls, from the atmosphere or from contiguous sea areas. Inputs from earlier times can be stored in the fjord bed and participate in the turnover under certain conditions. Nutrients are removed from the fjords by permanent storing in the bed; nitrogen also by denitrification and by water exchange with contiguous sea areas. The most important nutrients, nitrogen and phosphorus, occur in two main forms. The inorganic form dissolved in water is directly available to plants, whereas the organic compounds, which are often found as particles, first need to be broken down into inorganic compounds before they can again contribute to plant growth.
Exchanges between sediment and water
Materials are constantly exchanged between sediment and the overlying body of water. Processes in the sediment are thus very significant to both the nitrogen and phosphorus budgets in a water area. The phosphorus which enters a closed body of water can only be "removed" (made biologically unavailable) by being bound in the sediment. In this manner a large phosphorus pool can develop over a number of years, which, if liberated, provides nutrition for the growth of algae. This liberation depends on temperature and oxygen content, the highest rate occurring in warm periods with low oxygen content. This is exactly the reason for the frequently observed increase in the inorganic phosphorus content in summertime. Nitrogen is not accumulated in sediment in the same manner. Nevertheless, it is a process in the sediment which is decisive for converting nitrogenous nutrients into inactive nitrogen. This process is called denitrification meaning that nitrate, which is an important plant nutrient, is converted by bacteria to free nitrogen which can only be used by a small number of organisms. Denitrification is one of the most important "self-cleansing" processes in the environment.
Nutrient inputs
The percentage distribution of types of sources of nutrient input to the fjords in 1995 is shown in Table 6.4, which also shows total inputs of phosphorus and nitrogen.
Table 6.4
Percentage distribution of types of sources of nutrient input and total inputs of
phosphorus and nitrogen to selected fjords in 1995.
Fjord No. and name |
Atmospheric precipitation |
Diffuse sources |
Point sources |
Total inputs |
||||
% |
% |
% |
t |
t |
||||
N |
P |
N |
P |
N |
P |
N |
P |
|
| 1 Roskilde Fjord | 15 | 1 | 69 | 31 | 17 | 67 | 1935 | 88 |
| 2 Karrebćk Fjord | 1 | 0 | 87 | 29 | 12 | 70 | 2207 | 57 |
| 3 Vejle Fjord | 4 | 1 | 81 | 46 | 15 | 53 | 1911 | 75 |
| 4 Horsens Fjord | 4 | 2 | 82 | 57 | 14 | 42 | 1656 | 30 |
| 5 Kolding Fjord | 2 | 1 | 91 | 75 | 8 | 24 | 965 | 27 |
| 6 Dybsř Fjord | 20 | 20 | 76 | 9 | 3 | 71 | 62 | 1 |
| 7 Guldborg Sound | 11 | 2 | 75 | 50 | 14 | 47 | 926 | 35 |
| 8 Guldborg Sound B | 12 | 3 | 83 | 70 | 5 | 28 | 324 | 11 |
| 9 Nakskov Fjord | 8 | 4 | 87 | 59 | 5 | 37 | 594 | 11 |
| 11 Stege Bight | 26 | 16 | 63 | -8 | 12 | 91 | 184 | 3 |
| 17 Prćstř Fjord | 9 | 3 | 84 | 40 | 7 | 56 | 286 | 7 |
| 18 Nissum Fjord | 2 | 1 | 88 | 60 | 10 | 39 | 2994 | 61 |
| 19 Ringkřbing Fjord | 4 | 2 | 86 | 62 | 9 | 36 | 6710 | 158 |
| 20 Grĺdyb tidal zone | 2 | 1 | 80 | 49 | 18 | 49 | 4918 | 115 |
| 21 Ebeltoft Inlet | 44 | 29 | 54 | 39 | 2 | 32 | 211 | 3 |
| 22 Randers Fjord | 1 | 0 | 87 | 58 | 12 | 42 | 5338 | 152 |
| 23 Aarhus Bight | 21 | 5 | 63 | 29 | 16 | 66 | 1682 | 66 |
| 24 Norsminde Fjord | 1 | 1 | 97 | 87 | 2 | 12 | 172 | 4 |
| 25 Mariager Fjord | 4 | 2 | 88 | 64 | 8 | 34 | 1693 | 29 |
| 26 Stavns Fjord | 56 | 48 | 43 | 37 | 1 | 16 | 28 | 0 |
| 27 Odense Fjord | 3 | 1 | 84 | 61 | 13 | 38 | 2492 | 67 |
| 28 Kerteminde Fjord / Kertinge Cove | 12 | 7 | 86 | 60 | 2 | 32 | 75 | 1 |
| 29 South Funen Archipelago | 31 | 13 | 66 | 59 | 3 | 28 | 1297 | 30 |
| 30 Holckenhavn Fjord | 0 | 0 | 96 | 87 | 4 | 13 | 472 | 10 |
| 32 Nakkebřlle Fjord | 4 | 2 | 95 | 94 | 2 | 4 | 215 | 4 |
| 33 Helnćs Bight | 18 | 8 | 80 | 76 | 2 | 16 | 400 | 8 |
| 34 Bredningen (the Broad) | 0 | 0 | 95 | 70 | 5 | 30 | 226 | 5 |
| 35 Gamborg Fjord | 9 | 4 | 88 | 89 | 3 | 7 | 129 | 2 |
| 49 Holsteinborg Cove | 17 | 4 | 72 | 18 | 10 | 78 | 51 | 2 |
| 52 Korsřr Cove | 13 | 6 | 84 | 41 | 3 | 53 | 80 | 1 |
| 53 Kalundborg Fjord | 29 | 11 | 52 | 18 | 19 | 72 | 284 | 7 |
| 55 Isefjord outer Broad | 19 | 9 | 75 | 42 | 6 | 49 | 1296 | 23 |
| 57 Lammefjord | 3 | 2 | 93 | 58 | 4 | 41 | 806 | 13 |
| 58 Isefjord inner Broad | 7 | 2 | 86 | 41 | 8 | 57 | 774 | 19 |
| 59 Holbćk Fjord | 5 | 2 | 89 | 45 | 6 | 53 | 402 | 8 |
| 61 Halkćr Broad | 1 | 0 | 94 | 76 | 5 | 23 | 698 | 13 |
| 63 Skive Fjord, LovnsBroad etc. | 15 | 6 | 170 | 140 | 14 | 54 | 2107 | 58 |
| 64 Flensborg Fjord | 22 | 5 | 67 | 63 | 12 | 32 | 622 | 26 |
| 65 Haderslev Fjord | 1 | 0 | 90 | 67 | 8 | 32 | 391 | 22 |
| 66 Aabenraa Fjord | 12 | 2 | 71 | 35 | 17 | 36 | 285 | 13 |
| 67 Genner Bight | 5 | 1 | 90 | 63 | 5 | 35 | 99 | 3 |
| 68 Augustenborg Fjord | 5 | 1 | 89 | 66 | 6 | 32 | 316 | 9 |
| 73 Risgĺrde Broad | 31 | 13 | 69 | 82 | 0 | 5 | 219 | 4 |
| 76 Limfjorden | 8 | 3 | 86 | 65 | 6 | 31 | 19458 | 439 |
| Status 1995 | The nutrient enrichment status in the fjord areas is based on the county reports and shown in Table 6.5 |
Condition and development
Figures 6.2 and 6.3 illustrate the average time-weighted summer and winter values in the period 1989-1994. In general, nutrient enrichment is greatest and most variable in the shallow fjords. In the nutrient-enriched areas, a large proportion of the nutrients are found all year round in inorganic form immediately available to plants. In the nutrient-poor areas, the nutrients are mostly bound in organic matter in summer. The greatest nutrient enrichment, especially with respect to nitrogen, is found in Holckenhavn Fjord and Bredningen (the broad) in the Little Belt. Aarhus Bight and Kalundborg Fjord are the least nutrient-rich fjords. All the fjords are more or less nutrient-rich in comparison with the open seas.
Table 6.5
Overall review of the state of hydrochemical conditions in the theme fjords in 1995.
The review is regionalised for practical reasons – for detailed information refer to
the county theme reports (see Appendix 5).
| West Jutland fjords | Ringkřbing and Nissum Fjords are strongly affected by nutrient inputs from land. Nitrogen input is especially high, with resultant high nitrogen concentrations. Grĺdyb Tidal Zone also has high concentrations of nitrogenous and phosphorous nutrient salts. |
| Limfjorden | There was a high nitrogen content (about 1 mg/l) in Limfjorden in 1995. Phosphorus content was also high. Mean winter values were only slightly higher than the summer values. |
| East Jutland fjords | In 1995, nitrogen concentrations were generally lower than the averages of 1989 to 1994. The reason is considered to be the low run-off in 1995. Phosphorus concentrations were significantly lower, the reason also being improved waste water treatment. In Aarhus Bight the mean total nitrogen concentration in all months of 1995 was higher than the average for 1983-1994, while for phosphorus it was lower for 11 months. The tendency was the same for inorganic nitrogen and phosphorus. Mariager Fjord also showed generally static or rising nitrogen and falling phosphorus content. |
| South Jutland fjords | In 1995, nutrient salt content did not differ significantly from the averages for 1989-1994. The phosphorus content of individual fjords was, however, significantly lower towards the end of the year. |
| Funen fjords and coves | Odense Fjord showed falling concentrations of the annual average of inorganic phosphorus, and of the summer average of inorganic nitrogen due to improved waste water treatment. The levels are, however, still higher than in the surrounding waters. From time to time very high nutrient concentrations are measured in summer as a result of overflows from sewer systems and of liberation from sediments. In the South Funen Archipelago, the inorganic phosphorus concentration has fallen in winter, without any changes in the nitrogen levels. The level here is also higher than in the surrounding waters. This is also the case for Kertinge Cove, where the phosphorus levels have been falling. In all three areas, high run-off resulted in unusually high nitrogen concentrations in the spring of 1995. |
| North Zealand fjords | Roskilde Fjord had the lowest phosphorus content in the southern part since measurements began in 1972. On the other hand, nitrogen concentrations in the same area were higher than normal, enabling the plants to take up much phosphorus. Isefjorden had a high nitrogen but low phosphorus nutrient salts content in the winter of 1995. |
| West Zealand fjords and coves | Kalundborg Fjord has high nitrogen and phosphorus contents, while those in Korsřr Cove are low. The reason is that all waste water discharges to Korsřr Cove ceased at the end of 1994. |
| South Zealand fjords | The 1995 nitrogen content of Prćstř Fjord was slightly higher than before. The phosphorus content does not differ from previous measurements. The nutrient salt concentrations in Stege Bight are of the same order as those in the contiguous open waters and lower than those in the other fjords. |
Figure 6.2
Nutrient content of Danish fjords expressed as averages of time-weighted mean values
of total nitrogen for summer (May-September incl.) and winter periods (December-February
incl.) in the years 1989 to 1994 (from Kaas et al., 1996).
Figure 6.3
Nutrient content of Danish fjords expressed as averages of time-weighted mean values
of total phosphorus for summer (May-September incl.) and winter periods (Individual
ind-February incl.) in the years 1989 to 1994 (from Kaas et al., 1996).
Annual variations
Nutrient concentrations in the water vary during the year. Figure 6.4 illustrates the
seasonal variation as the average of 33 fjords. It will be seen that the concentrations of
both nitrogen and phosphorus are high in winter because of high freshwater run-off and low
consumption. At this time of year, most of the nutrients are in the form of inorganic
compounds. Concentrations fall in spring as run-off decreases and nutrients are taken up
by plants. Phosphorus levels rise again in summer as inorganic phosphorus is liberated
from the fjord bed. As there is no corresponding increase in nitrogen inputs, its
concentration falls to the level where the increased phosphorus content cannot be
utilised.
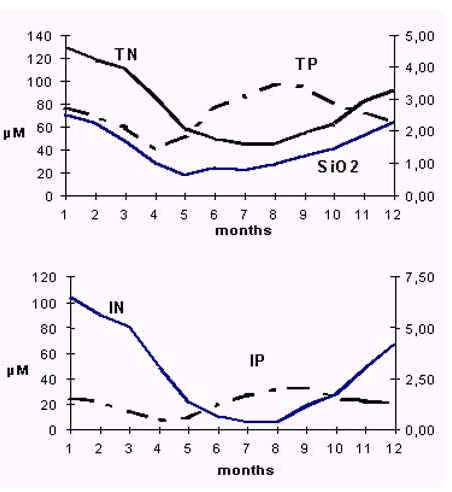
Figure 6.4
Annual variation in nutrient concentrations in Danish fjords. Average values of A: total
nitrogen (TN), silicate (SiO2), and total phosphorus (TP) and B: inorganic nitrogen (IN),
inorganic phosphorus (IP) in 33 Danish fjords 1989-1994. Right-hand axis gives phosphorus
concentrations and left-hand nitrogen and silicate contents (from Kaas et al., 1996).
Phosphorus concentrations have fallen in many fjord areas. This applies to winter concentrations of both total and inorganic phosphorus and to summer concentrations of inorganic phosphorus. The reduced phosphorus discharges as a result of improved waste water treatment has also had a marked effect in many fjord areas.
To examine whether loading from land really is the most significant reason for nutrient enrichment in Danish fjord areas, the National Environmental Research Institute has carried out a statistical analysis. This analysis shows that nitrogen loading can in fact explain a great deal of the variation in nitrogen levels, but that there is not the same degree of correlation between phosphorus loads and phosphorus concentrations in the water. If the individual seasons are analysed separately, it appears that the correlation is greatest for nitrogen in winter and least in summer. The reason is, as mentioned before, that in winter the nitrogen concentration is not affected by uptake by plants. The correlation is also shown to be best in shallow fjords.
6.4.2 Phytoplankton
Phytoplankton is the most important food source for a range of organisms in marine areas. At the same time, large plankton masses can outshadow other plants or even secrete toxins. Large amounts of oxygen can also be consumed in the decomposition of planktonic algae. The amount and growth of phytoplankton is therefore an important environmental parameter.
Background
In Danish fjords and coastal waters, the biomass of phytoplankton varies between 0.05 and 50 mg/l of carbon. Primary production is typically between 20 and 2,000 mg C/m˛/day. The reason that there is not as great a variation as in the production of algae is presumably that the algae begin to shade each other when they occur in very large numbers. The amount of algae can be estimated by measuring the amount of chlorophyll in the water. However, it is the carbon content that is of interest. As a rule of thumb, it can be said that there is 40 times as much carbon as chlorophyll in planktonic algae, which need enough light and nutrients to grow. If even one growth factor is missing, the growth will stagnate. As a rough estimate, it is often considered that if the combined concentration of nitrite and nitrate is under 14 µg/l or the concentration of inorganic phosphorus is less than 2 µg/l, then it is the amount of nutrients which limits algal growth. Studies of nutrient concentrations and experiments with enriched nutrient levels have shown that in most areas the amount of nitrogen available is the limiting factor. Planktonic algae growth starts in spring when light levels are sufficient. At this time there are as a rule sufficient nutrients available as a result of winter run-off. Usually the various species of diatoms bloom first. The algal mass often falls again later, partly because all nutrients are consumed and partly because the algae are eaten by bivalves (shellfish) and copepods (water fleas). During the summer, sudden short-lived increases in algal masses to very high levels can often be observed. From time to time, toxic species trigger these massive blooms.
Status 1995
The phytoplankton status of the fjord areas based on county reports is shown in Table 6.6.
Table 6.6
Overall review of the state of phytoplankton conditions in the theme fjords in 1995.
The review is regionalised for practical reasons – for detailed information refer to
the county theme reports (see Appendix 5).
| West Jutland fjords | The amount of planktonic algae is extremely high in Ringkřbing and Nissum Fjords. Blue-green algae predominate in Ringkřbing Fjord, but a bloom of diatoms was also observed in the spring of 1995. In Grĺdyb tidal zone, the highest chlorophyll concentrations to date were measured in 1995. Nutrient salts are only exceptionally limiting factors. |
| Limfjorden | 1995 was characterised by large masses of phytoplankton, especially the occurrence of dinoflagellates. There were more mass blooms than in the previous 4-5years. |
| East Jutland fjords | Horsens and Vejle Fjords were characterised in 1995 by unusually few planktonic algae. For this reason the water was also clearer than normally. There were individual very strong algal blooms in Kolding Fjord, which meant that the annual average algal mass was no lower than normally, nevertheless the water was still clearer than previously. The amounts of planktonic algae in Aarhus Bight were less than the averages over previous years for most of the year, but with an extremely large amount measured in spring. The dominant species was a colony-forming flagellate (Phaeocystis). Plankton production is extremely high in Mariager Fjord compared with other Danish marine areas. 1995 was no different from previous years. |
| South Jutland fjords | Water in the South Jutland fjords was generally much clearer in 1995 than in previous years. By the same token, algal mass and production were low. |
| Funen fjords and coves | The amounts of planktonic algae measured in Odense fjord were higher than previously, but still lower than in contiguous waters. The rise was due in particular to summer blooms of small green algae. In the South Funen Archipelago, both plankton levels and production were unusually low in 1995, with the greatest Secchi depth to date of 12 metres being measured. The phytoplankton mass in Kertinge Cove was also low, while production was at the same level as previously. The plankton mass is thought to have been kept down by filtering bivalves. |
| North Zealand fjords | Mass occurrences of planktonic algae were registered in Roskilde Fjord and Isefjorden from March to October. Production and biomass were very high, with correspondingly low Secchi depths. |
| West Zealand fjords and coves | In 1995, both algal mass and production were lower in Korsřr Cove than previously. Nitrogen was thought to be the main limiting factor here, as well as in Kalundborg Fjord. |
| South Zealand fjords | Prćstř Fjord only contains minor amounts of phytoplankton, but a single extremely large bloom was seen in August 1995. It is not known which species were involved. There are only occasional limiting nutrient (nitrogen) conditions in Prćstř Fjord. There were potential limiting nitrogen conditions in Stege for long periods in 1995. Phosphorus is not a limiting factor in the South Zealand fjords. |
Conditions and development
The amounts of phytoplankton in Danish waters are shown in figure 6.5. The figure shows the time-weighted averages of the chlorophyll biomass in spring, summer, autumn and the whole growing season. The highest biomasses are found in Ringkřbing and Nissum Fjords, both of which have water changes controlled by locks so that retention times are very high. This means that, even though loading is not particularly high, there is a high turnover of the input nutrients in the fjord itself. There are also low occurrences of bivalves and other organisms to filter out the algae. The lowest biomasses are found in Lindelse and Holsteinsborg Coves. The reason is partly that there is a relatively low nutrient loading in these areas and partly that the nutrients are utilised by large amounts of benthic flora. Apart from Nissum and Ringkřbing Fjords, the highest summer biomasses are found in the deepest fjords.
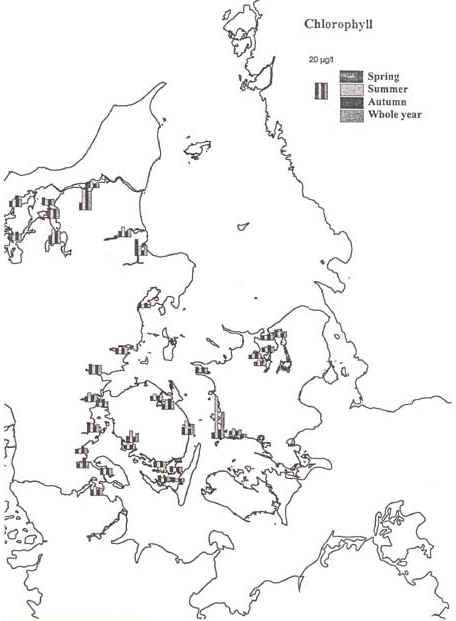
Figure 6.5
Annual (March-October incl.), spring (March and April), summer (May-September incl.) and
autumn (October and November) chlorophyll concentrations in Danish fjord waters expressed
as time-weighted seasonal averages in the period 1989 to 1994. Data for all years are not
available for some fjords (from Kaas et al., 1996).
Primary roduction
While the biomass is a measure of the amount of algae present at a given time, the primary production is an estimate of the instantaneous rate of growth of the algal mass. A situation can easily be imagined where high growth is measured, but because the algae are eaten or disappear by other means, a large biomass is never built up. Mean values of primary production in summertime in Danish fjords are shown on Figure 6.6.
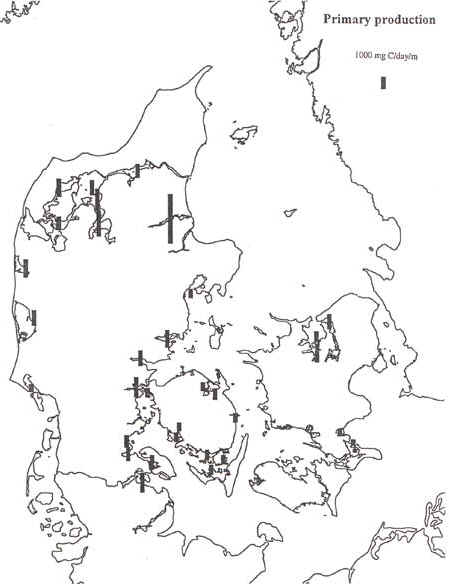
Figure 6.6
Primary summer production in Danish fjords expressed as average of time-weighted mean
values for the years 1989 to 1994 (from Kaas et al., 1996).
Composition of species
The different species of algae require different environments. For this reason, they will often occur in a characteristic annual rhythm. Figure 6.7 illustrates the proportions of the different species over the year. In spring, diatoms are usually the first to be able to take advantage of the increasing light intensity. Diatoms and dinoflagellates supplant each other over the summer alternately as the dominant algal groups. In autumn, large dinoflagellates such as various ceratium species often predominate. In Ringkřbing and Nissum Fjords the picture is somewhat different, in that the plankton populations are here dominated in summer and autumn periods by blue-green algae.
Figure 6.7
Average carbon biomasses of various algal groups in spring, summer and autumn. Data from
32 Danish fjords from 1989 to 1994 are used (from Kaas et al., 1996).
Secchi depth
It has previously been shown that to a high degree the algal mass in the water determines how clear it is. Average Secchi depths in Danish fjords vary from 0.4 to 8.7 metres. The lowest value is found in Ringkřbing Fjord and the highest in Aarhus Bight.
Plankton and nutrient enrichment
The National Environmental Research Institute has undertaken statistical analyses to study which variables are most significant to the growth of planktonic algae and biomass. It was not possible to establish any correlation between algal growth rate and the variables studied. The reason for this is that measurements of growth rates are uncertain compared with the other variables. This was not the case with the biomass studies. Biomass was related to fjord depth, degree of mixing, amounts of algae-eating benthic fauna, nitrogen loading and phosphorus loading. It turned out that algal mass can be explained by the fjord mean depth, amount of algae-eating benthic fauna and nitrogen loading. It is evident that high mean depth has a negative effect on the amount of algae, because the large mass of water "dilutes" the growth which can only take place at the upper levels where there is enough light. The analysis stresses that the nitrogen loading is highly significant to the algal mass in the fjords, but also that algae-eating benthic fauna can check algal growth to some extent.
Based on knowledge of the significance of nitrogen loading to the amount of planktonic algae, the National Environmental Research Institute has calculated what a reduction in nitrogen loading would mean to fjords with various depths and differing populations of plant-eating bivalves. The results are shown in Figure 6.8. It turns out that there is a large effect on the mass of phytoplankton if the amount of nitrogen nutrients is reduced. Thus the algal mass is reduced by approx. 25% for each halving of the nitrogen loading.
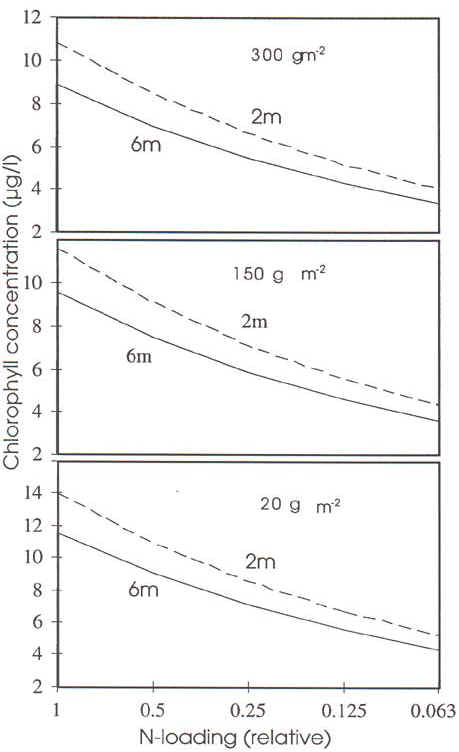
Figure 6.8
Effect of reduced nitrogen loading on summer chlorophyll concentration in two hypothetical
fjords with differing mean depths and different populations of filtering bivalves. The
horizontal axis represents the relative summer loading averaged for 42 fjords (from Kaas
et al., 1996).
6.4.3 Benthic flora
The sedentary vegetation of the fjords consists partly of rooted flowering plants such as eelgrass and sea grass, partly of a rich variety of algal vegetation attached to a fixed substrate, e.g. stones. The flora distinguishes itself from a monitoring point of view by being long-lived and therefore able to provide information about environmental conditions over a relatively long period before the investigations.
Background
Eelgrass is the most important benthic plant in Danish fjords, occurring on sand and mud beds in the form of extensive "meadows". It is an important food for a number of waterfowl and refuge for fish fry. The occurrence of eelgrass depends on a suitable substrate and sufficient light. It is rarely found in waters less than 1 metre deep because of wave action. Its depth range is determined by light, i.e. the greater the turbidity, the lower the maximum extension will be. In Danish fjords the depth limit lies between 2 and 6 metres. Eelgrass can propagate by a side-shoot spreading into new areas. By this means, a colony can spread by about 16 cm in a year. Propagation can also be by seeds spreading and sprouting where no colony existed before, but the seedlings are very sensitive to poor light conditions and are easily pulled up from the bed by waves and currents. If eelgrass disappears from an area due to oxygen depletion or poor light conditions during algal blooms, a vicious circle may initiate as the eelgrass contributes to stabilising the bed so that it is not easily stirred up by currents or waves. Once it has gone, the water can become more turbid and it becomes more difficult for new colonies to become established.
In areas with stone beds, flora is dominated by various algal species. Their depth distribution is also determined by the amount of light. As the different species have different light requirements, a zoning can be observed from shallow to deeper water. Near the coast where the light is stronger, green algae such as enteromorpha are often found. The brown algae bladder wrack and serrated wrack also grow here. Further out, other varieties of brown algae predominate. Finally, the deepest areas are home to various red algae.
In areas with high nutrient inputs, strong blooms of pollution-tolerant algal varieties are often seen, either in the form of small filamentous brown algae, ‘fatty muck’, or various green algae such as sea lettuce or horsehair wrack. These algae can grow while drifting in the water. If they are washed up on the shore or driven together in too thick layers, they may rot and cause odour problems. In other areas the phytoplankton benefits instead from elevated nutrient supplies, leading to greater turbidity and increased risk of oxygen depletion.
The sedentary vegetation as opposed to the planktonic algae is adapted to conditions of relatively low nutrient levels in the water. The benthic flora has a large biomass, is long-lived and breaks down slowly, thereby contributing to removal of nutrients from the water. Even in nutrient-poor areas, the primary production of benthic flora may exceed that of phytoplankton in nutrient-rich waters.
Status
The benthic flora status of fjord areas based on county reports is shown in table 6.7.
Table 6.7
Overall review of the state of benthic flora conditions in the theme fjords in 1995.
The review is regionalised for practical reasons – for detailed information refer to
the county theme reports (see Appendix 5).
| West Jutland fjords | There was great increase in the amount of setaceous-leaved pondweed in Ringkřbing Fjord in 1995. The reason was low salinity in spring. On the other hand, eelgrass has nearly disappeared, partly for the same reason, but also to a high degree because of high turbidity. Eelgrass has completely disappeared from Nissum Fjord as a result of low salinity in spring. The average depth limit of vegetation in Ringkřbing Fjord was approx. 0.8 m and in Nissum Fjord approx. 1 m. Grĺdyb Tidal Zone is characterised by a rising amount of drifting pollution-tolerant green algae. |
| Limfjorden | 1995 was a bad year for vegetation in Limfjorden. The depth limit for the main growth of eelgrass averaged about 2.5 metres. The biomass is also modest compared with previously. It is thought that especially poor light conditions as a result of large numbers of planktonic algae were to blame. Saragasso weed, first found in Denmark in 1984, has now spread to almost all of Limfjorden, where in some places dense colonies exist. |
| East Jutland fjords | Large occurrences of pollution-tolerant filamentous algae were found in the inner part of Horsens Fjord in 1995, in some places covering up to 80% of the fjord bed. In the central part of the fjord, the depth limit of the main area of eelgrass was scarcely 2 m. Its spread may be limited by intensive mussel fishing. Filamentous algae also occurred in the inner parts of Vejle and Horsens Fjords, covering up to 50% of the Fjord bed. Eelgrass had depth limits between 1.5 and 5 m. In one part of Kolding Fjord where eelgrass had previously disappeared, sprouting plants were observed. In all fjords, it was presumably the occurrence of suitable substrates that limited the depth limits of the fixed macroalgae. The depth limit of the main growth of eelgrass in Aarhus Bight was 4 – 6 m. |
| South Jutland fjords | In the South Jutland fjords the depth limit for the main extension of eelgrass was between 3 and 4 metres. There were mass outbreaks of pollution-tolerant filamentous algae, mainly brown filamentous and horsehair wrack in all the fjords in 1996. |
| Funen fjords and coves | An extensive growth of sea-grass was found in the inner part of Odense Fjord in 1995. A thin spread of sea lettuce was also found at Seden Beach, covering up to 75% of the bed. The depth limit of eelgrass in the inner parts of the fjords was between 1.6 and 2 m. The amount was very sparse, between 0.6 and 1.3 m, possibly because of grazing by swans. In the outer part of the fjord the depth limit for the main growth of eelgrass was 3.6 m. In 1995, the South Funen Archipelago was dominated by a massive spring bloom of filamentous brown algae. Due to oxygen depletion, eelgrass was reduced in extent by 70-80% in the 2-6 m depth range compared with 1994. The depth limit for the main growth of eelgrass was about 6 metres. In Kertinge Cove, the spring brought extensive mats of filamentous algae and benthic microalgae. There was a partial re-establishment of eelgrass during the summer. |
| North Zealand fjords | Many parts of Roskilde Fjord were 100% covered by pollution-tolerant filamentous algae. The depth limit for the main growth of eelgrass was about 3 m in the outermost parts of the fjord and 1 m in the inner part. Vellerup Inlet in Isefjorden was up to 100% covered by pollution-tolerant filamentous algae in 1995. In the outer reaches the coverage was up to 50%. There was very little eelgrass in the outer reaches of Isefjorden in 1995, while the depth limit for the main growth of eelgrass was about 3 m. |
| West Zealand fjords and coves | In 1995, there were significant occurrences of drifting mats of pollution-tolerant filamentous algae in Korsřr Cove. In the inner part of Kalundborg Fjord the extent of algae is affected by nutrient inputs and elevated temperatures due to warm cooling water from the Asnćs power plant. |
| South Zealand fjords | Very dense growths of pollution-tolerant filamentous algae were found in Nakskov Fjord in 1995. The depth limit of the main spread of eelgrass was reduced to 3.7 m. Dense growths of pollution-tolerant filamentous algae were found throughout Prćstř Fjord. The dominant plant in Karrebćk Fjord was sea lettuce. Stege Bight also suffered massive occurrences of pollution-tolerant species. However, eelgrass was the dominant plant whose depth limit is determined by the depth of water, which only exceeds 3 m in the fairways. In Dybsř Fjord the flora in low waters was dominated by pollution-tolerant filamentous algae. |
Status and development of eelgrass
The depth limit of eelgrass has been studied in a number of fjords. The results of this
study are shown in Figure 6.9. The depth limit varies from 0.8 m in Ringkřbing fjord to
approx. 6 m in Aarhus Bight.
Depth limit of the maximum extent of eelgrass 1989-1994
Figure 6.9
Depth limit of the maximum extent of eelgrass in Danish fjords. Averages of data from 1989
to 1994 (from Kaas et al., 1996).
Since the beginning of the century, the extent of eelgrass in Danish waters has
dropped sharply. This applies both to the depths at which eelgrass grows and the extent of
areas overgrown with eelgrass. There are several reasons for this retrogression. In the
30s eelgrass was hit by a disease and later pollution with nutrient salts caused reduced
light conditions. Reductions in depth limits have been greatest in the fjords, which have
also been most affected by changes in nutrient inputs. Figure 6.10 shows the reduction in
eelgrass depth limits from the beginning of the century to date. In certain areas this
depth limit has actually been halved. It is not known when the most rapid retrogression
occurred, as regular studies were not made previously. In Randers Fjord, however, it is
known that a rapid reduction occurred between 1955 and 1975. In Nissum Fjord it happened
between 1966 and 1983.
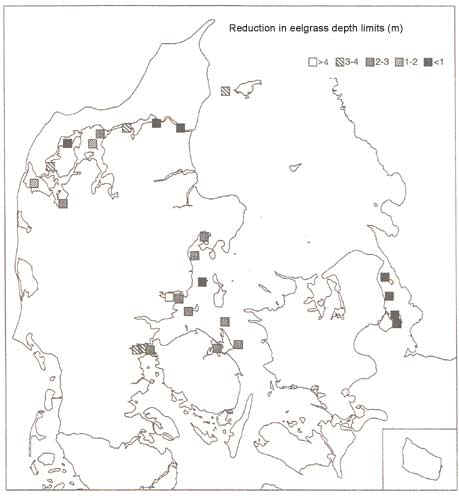
Figure 6.10
Reduction in eelgrass depth limits from the beginning of the century to date (from Kaas et
al., 1996).
From the early 1970s till the mid-1980s, vegetation conditions worsened further in many places. Thereafter, conditions were more stable for a period. 1994 and 1995 have again brought rapid reductions in eelgrass colonies in many places. In the South Funen Archipelago, the area covered with eelgrass was reduced by 70-80% in the 2-6 m depth band. In 1994 the water temperature in the area reached nearly 25 °C, and at the same time the highest oxygen depletion to date was measured. After the oxygen depletion, a powerful algal bloom occurred, leading to the water being extremely turbid for a time. In 1995 an extensive re-establishment of eelgrass was noted in some of the affected areas, while others still only contain dead, black eelgrass remains. Other areas have also been hit by reductions in eelgrass in recent years. Table 6.8 shows the trend in several areas
Table 6.8
Trend of eelgrass colonies in areas hit by reductions in the 1990s. Key: -- : Elimination
in one or more transections, - : Reduction, 0 : Unchanged, + : Growth, ++ :
Re-establishment to pre-1992 level, ? : not studied
| Location | 1992 |
1993 |
1994 |
1995 |
| Limfjorden generally | + |
+ |
- |
- |
| - South-west of Mors | - |
+ |
- |
|
| - Lřgstřr Broad | - |
- |
0 |
|
| - Nibe Broad | - |
- |
- |
- |
| - Langerak | - |
- |
0 |
|
| Randers Fjord | -- |
0 |
0 |
? |
| Hevring Bight | - |
? |
- |
? |
| Kolding Fjord, Gudsř Inlet | -- |
0 |
0 |
+ |
| Haderslev Fjord, outer part | - |
- |
- |
+ |
| Genner Fjord, inner part | - |
+ |
+ |
-- |
| Als Fjord, inner part | -- |
- |
- |
|
| Augustenborg Fjord | -- |
0 |
- |
+ |
| Flensborg Fjord, Brunsnćs | - |
+ |
- |
- |
| Odense Fjord, north-west | -- |
+ |
+ |
+ |
| Kertinge Cove | - |
0 |
- |
+ |
| Gamborg Fjord | -- |
0 |
+ |
+ |
| Helnćs Bight | 0 |
-- |
0 |
0 |
| Tetens Ground | -- |
+ |
+ |
++ |
| South Funen Archipelago | 0 |
0 |
-- |
- |
| Křge Bight | - |
0 |
- |
- |
| Roskilde Fjord, inner part | - |
+ |
- |
- |
The spread of eelgrass can be characterised by how densely it grows and the depths at which it occurs. It appears that the density is in an almost bell-shaped distribution over the depth intervals where it grows. The greatest density is found in the 1-2 m depth band, Figure 6.11. This bell distribution indicates that several factors affect the pattern of spreading of the eelgrass.
Figure 6.11
Eelgrass density in different depth bands (after Kaas et al., 1996).
There is a well-known inverse correlation between the concentration of nitrogenous nutrients in the water (and hence turbidity) and the eelgrass depth limit, but factors which affect occurrences within the depth bands have not been studied so far. The National Environmental Research Institute has undertaken statistical analyses to show which factors are at work at different depths and over the whole interval. This analysis shows that the light conditions and degree of exposure (wave action) are the most important factors, while the effects of the gradient and composition of the bed are less significant. In shallow water there is always enough light for eelgrass to grow, i.e. the amount of light is not significant here. Moving towards deeper water, light becomes a limiting factor for the growth of eelgrass and thus the most important parameter for regulating the eelgrass. The opposite applies to wave action, which is most significant in shallow water. In very shallow water, the extent is determined by other factors such as ice scouring, drying out at low tide, and grazing by birds.
Status and development algae
The number of macroalgal species in Danish fjords is shown in Figure 6.12.
Figure 6.12
Numbers of species of macroalgae (green, brown and red algae) in Danish fjords. Averages
of data from 1989 to 1994 (from Kaas et al., 1996).
Numbers of species 1989-1994
Diversity of species
Traditionally, a great diversity of species has often been associated with good environmental conditions. In fjords and fjord mouths it is often the case that the number of macroalgal species and marine organisms generally decreases from the mouth inwards. The reason for this is often given as the decreasing salinity, which then can also explain the difference in numbers of species between Kattegat with approx. 318 species and the waters around Bornholm with about 79. The National Environmental Research Institute has undertaken statistical analyses to examine whether the diversity of macroalgal species in fact correlates with environmental conditions. The analyses were done partly for whole fjords and partly for the individual sampling stations separately. This analysis has shown that the mean depth of the fjord has the greatest positive correlation with the number of species, and that also the volume, salinity, coastal length and area have positive influence on the number of species. On the other hand, there is a negative correlation with the nitrogen and phosphorus loading. The different varieties are known to prefer different light conditions, leading to a zoning from shallower to deeper water. Obviously, the deeper the water, the more depth bands can occur in a fjord. Besides, there is a tendency for salinity to be greatest in the deepest fjords, so it is not surprising that the deeper fjords exhibit more diversity of species. It is similarly known that the greater a given area, the more likely it is that a given species can occur and thrive in the area. Against this background, it is natural that the fjord area, volume and coastline have positive influences on the number of species found. By filtering out the effects of these factors, it can be determined that the number of species falls on average by approx. 2 when the inorganic nitrogen content rises by a factor of 2.7.
Benthic flora and nutrient enrichment
Within the framework of the HAV-90 research programme attempts have been made to assess what effects the implementation of the Action Plan for the Aquatic Environment would have on the flora. The Plan’s target of a 50% reduction in nitrogen inputs to the aquatic environment would typically bring about a reduction of 40% in nitrogen concentration in heavily polluted areas and of 20% in less polluted areas. The consequences for the flora are described in Table 6.9.
Table 6.9
Examples of changes in phytoplankton masses and benthic flora depth limits resulting from
reductions in nitrogen concentration (Christensen, P. B. (ed.), 1996).
Heavily polluted area |
Lightly polluted area |
|||||
Before |
After |
% change |
Before |
After |
% change |
|
| Total nitrogen (µg/l) | 1500 |
900 |
-40 |
400 |
320 |
-20 |
| Phytoplankton (µg chlorophyll/l) |
17.8 |
10.3 |
-42 |
4.3 |
3.4 |
-21 |
| Eelgrass depth limit (metres) |
1.7 |
2.5 |
+47 |
4.6 |
5.4 |
+17 |
| Brown algae depth limit (metres) |
1.0 |
2.0 |
+100 |
5.8 |
7.8 |
+34 |
Calculations by the National Environmental Research Institute show that at a median total nitrogen concentration of 550 µg/l the depth limit will be 3.6 m, and at 275 µg/l about 6 m. Based on these numbers and knowing the bed gradients in the areas examined, it has been estimated that eelgrass could expand its area of growth by approx. 70%. In other words, very large areas could be colonised by eelgrass if nitrogen inputs were reduced.
6.4.4 Oxygen conditions
Oxygen depletion with dead fish and benthic fauna are probably the most visible effect of overloading of ecosystems, but less noticeable effects also make oxygen content a key parameter in marine monitoring.
Background
Aquatic oxygen content depends on the relationship between oxygen consumption in the water and bed and the input of fresh oxygen. Consumption is by animal and plant respiration and bacterial metabolism. The amount of organic material present determines the oxygen consumption in a given area of water.
Decomposition of matter in sediments
Part of the organic matter added to sediments functions as food for benthic fauna. The rest decomposes by a complex interplay between a number of microbial processes. Some of these can occur without the presence of free oxygen, sulphates or nitrates being used as oxidising agents instead. Even under normal conditions, anaerobic conditions will occur at a small depth below the sediment surface. During the decomposition processes, the carbon in the organic matter will be broken down to carbon dioxide, which can be taken up again by plants. The nutrient content also becomes available to plants.
Oxygen balances
Oxygen in water originates both from photosynthesis by plants and from the air. In a stratified area, the water beneath the transition stratum will be isolated from atmospheric oxygen. As this stratum is often so deep that it is too dark for plant growth, the fauna below this level depends on the amount of oxygen already in the enclosed mass of water. Other things being equal, there will always be more oxygen available to benthic life the greater the distance between the fjord bed and the transition stratum. The oxygen content varies over the year. In winter when the temperature is lower, the water can contain more oxygen, while at the same time stronger winds cause more surface agitation leading to easier access to atmospheric oxygen. Finally, the lower temperatures mean that processes which consume oxygen proceed at a slower rate. In summer, conditions are quite different: relatively warm and calm. There is also a large amount of easily-decomposed algal material from the spring blooms that can be broken down. It can be seen that oxygen content is high in winter, followed by a fall during the summer until autumn storms and cooler weather again add oxygen to the water. The availability of oxygen to the fauna depends on the oxygen content of the water compared with how much it can contain. There are also great differences in the abilities of different fish and benthic fauna to tolerate low oxygen concentrations. A normal rule of thumb is that fish begin to move away at concentrations below about 4 mg/l and most below about 2 mg/l. If concentrations remain below this level for extended periods, the benthic fauna begins to die. In Denmark, oxygen depletion is therefore defined as less than 4 mg oxygen per litre of water. If it falls below 2 mg/l oxygen depletion is serious.
Status
The oxygen depletion status in fjord areas is given in Table 6.10, based on the county
reports.
Table 6.10
Overall review of oxygen depletion conditions in the theme fjords in 1995. The review
is regionalised for practical reasons and does not discriminate between depletion and
acute depletion – for detailed information refer to the county theme reports (see
Appendix 5).
| West Jutland fjords | Oxygen conditions in Ringkřbing Fjord in 1995 were worse than previously. In 1995, oxygen depletion was also measured in Nissum Fjord, which otherwise has good oxygen conditions. Depletion has not yet been measured in Grĺdyb tidal zone. |
| Limfjorden | About 25% of the area of Limfjorden was affected by oxygen depletion during 1995, covering largely the same extent as during 1994, but the duration and therefore the effect on benthic fauna was less in 1995. |
| East Jutland fjords | 1995 featured poor oxygen conditions in Vejle and Horsens Fjords. Oxygen depletion was measured in many periods from June to October. In many places, depletions were "imported" by oxygen-depleted waters entering the fjords. Such an event caused extensive fish deaths in the shallow waters of Vejle Fjord. No oxygen deficiencies were measured in Kolding Fjord. In Aarhus Bight, depletion lasted from July 1 to November 1, being very high for five weeks in August/September. This was the most extreme oxygen depletion since 1982. |
| South Jutland fjords | There was extensive oxygen depletion in the deeper parts of the south Jutland fjords during 1995. In Flensborg inner Fjord, it lasted from June to October, also reaching the outer parts of the fjord from July to September. No depletion was measured in Haderslev Fjord or the inner part of Genner Fjord, though there was oxygen depletion in the outer part of the latter during August. Augustenborg Fjord suffered oxygen depletion in September and October, and Als Fjord in August and September. |
| Funen fjords and coves | The deep sediment basins of the South Funen Archipelago experienced depletion from July to October. Dead benthic fauna was observed in Nakkebřlle Fjord and Lunke Bight in connection with oxygen depletion. No depletion was measured in Odense Fjord or Kertinge Cove during 1995. There are signs in all water areas that there have been poor oxygen conditions caused by mats of drifting algae. |
| North Zealand fjords | Prolonged oxygen depletion was only measured in two limited holes in the southern part of Roskilde Fjord in 1995. Lammefjord experienced depletion in June and July. The outer broad of Isefjorden, Holbćk Fjord and the outer part of Lammefjord were all hit by oxygen depletion in August. |
| West Zealand fjords and coves | No depletion was measured in Korsřr Cove during 1995. Kalundborg Fjord experienced depletion during July-August and again in September-October. |
| South Zealand fjords | No depletion was measured here in 1995. |
Status and development
Large areas of the Danish fjords are frequently affected by deteriorated oxygen conditions, with negative consequences for benthic flora and fauna and for fish. Different forms of depletion occur in the fjords. In deep, delimited holes where a dense mass of water can be trapped for an extended period without mixing with freshwater, depletion may occur even without the addition of extra organic matter. Such areas of natural oxygen depletion are found, for example, in the Ćrř Basin in the South Funen Archipelago and in Lejre and Kattinge Inlets in Roskilde Fjord. Other areas experience depletion from time to time as a result of very oxygen-depleted waters flowing in from other areas, the depletion being imported. Such an event was observed in Vejle Fjord in September 1995. During the preceding period there had been poor oxygen conditions in the deepest portion of the outer part of the fjord . At the end of September, a strong westerly wind forced the topmost stratum of water out of the fjord. The water deficient in oxygen forced its way to the innermost part of the fjord causing very poor oxygen conditions throughout the fjord in a very short time. Finally, "normal" oxygen depletion is caused by such heavy growths of organic material that its decomposition consumes all the oxygen dissolved in the water body.
Frequency of oxygen depletion
The mean occurrence of oxygen depletion in fjords from 1989 to 1995 is shown in Figure 6.13. To take into account the different sampling frequencies in different areas and years, the figure shows frequency, i.e. the number of cases of depletion measured, divided by the total number of measurements. Oxygen conditions are generally good in the shallow fjords and areas with great water movement such as Nissum Fjord and Grĺdyb tidal zone. Oxygen depletion arises every year in deep, enclosed waters such as Mariager and Flensborg Fjords.
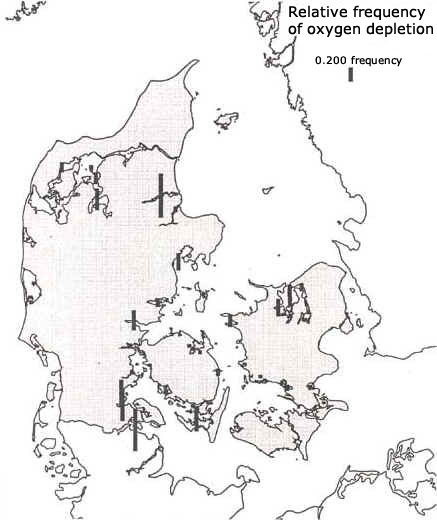
Figure 6.13
Average relative frequency from 1989 to 1995 of summertime occurrence of oxygen depletion
in Danish fjords. The relative frequency is calculated fjord by fjord by dividing the
number of instances of depletion by the total number of measurements during in the same
period (from Kaas et al., 1996).
Oxygen depletion and stratification
In many of the medium-depth fjords such as Vejle, Skive, and Roskilde Fjords, the occurrence of oxygen depletion follows a common pattern. It is characteristic that there were poor oxygen conditions in 1991, 1994, and 1995 while occurrences of oxygen depletion were relatively few in 1990 and 1993. This could indicate that the same mechanisms are at work in the different fjords. Figure 6.14 shows the frequency of oxygen depletion in selected fjords and open coastal areas from 1985 to 1995.
Frequency of oxygen measurements <2 mg per litre
Figure 6.14
Relative frequency of acute oxygen depletion (<2mg O2/l) from 1985 to 1995
(from Kaas et al., 1996).
The occurrences of oxygen depletion often vary between fjords and open waters. Thus in the summer of 1994, nearly all the Danish fjords were seriously affected while the open waters were not affected, by and large. It is also characteristic that oxygen depletion occurs in fjords earlier in the year than in open waters. Consequently, other mechanisms or local circumstances must be affecting the development of oxygen depletion. In comparison with Kattegat, the fjords are generally shallow and only rarely stratified. The National Environmental Research Institute has carried out statistical analyses to determine which variables are significant to the development of oxygen depletion in fjords. The analysis used data from Roskilde Broad and Skive Fjord. The working hypothesis was that physical and meteorological conditions set the framework, but that within this the availability of nutrients determines the degree of oxygen depletion. The analysis shows that stratification is the most significant parameter, followed by temperature and nitrogen loading. The amounts of light and phosphorus were also influential.
Oxygen depletion and nutrient enrichment
Based on the connection between oxygen depletion and nutrient salt loading, the National Environmental Research Institute has determined what a halving of the nitrogen loading would mean to the development of oxygen depletion. Under current conditions, the oxygen consumption is so high that in Skive and Roskilde Fjords it would take 6 days with stratification for depletion to occur and 14 days for it to become acute. If loading could be halved, it is forecast that depletion would take 12 days to develop and 20 days to become acute. Figure 6.15 shows how stratification typically occurred in the period 1984 to 1995. It can be seen that most periods of stratification are so short that acute depletion would not occur. At an average nitrogen loading, 28 acute cases of depletion would occur with a total duration of 493 days. Under the same conditions, but with a halved nitrogen input, only 11 cases would occur lasting in all only 268 days. A reduction in nitrogen loading would also have a marked effect on the extent of the depletion. As the model shows that there is often a correlation between nitrogen and phosphorus, an accompanying positive effect of a reduction in phosphorus loading cannot be ruled out.
Figure 6.15
Distribution of stratification in summertime and effect of 50% reduction in nitrogen
loading on oxygen depletion (from Kaas et al., 1996).
6.4.5 Benthic fauna
Background
Bivalves are generally the most significant group of benthic fauna in Danish fjords. Among the dominant varieties are common mussels, cockles and soft clams. All these species feed by filtering water. In Nissum and Ringkřbing Fjords, Polychaetopods (bristle worms) rather than bivalves form most of the faunal biomass. Echinoderms such as sea urchins and brittle stars, which are a very significant group in the open waters, are infrequent in the fjords. The reason for this is presumably the relatively low salinity there. The frequent occurrence of creatures that feed by filtering water means that benthic fauna plays a significant part in the fjords’ ecosystems.
Thus, it has been calculated that the bivalves on the bed of the outer part of Roskilde Fjord are in theory able to filter algae from the water in the entire fjord between one and ten times daily. The effect of this is that the water becomes clearer and that it becomes harder for copepods and other planktonic fauna to survive. At the same time, the consumption of planktonic algal biomass becomes far more effective when relatively large creatures are feeding as there are fewer links in the food chain. Actually, the filtration by the bivalves is not quite so effective, as often the same water is being filtered time and again. The more current and wave action there is, the more effectively the water can be filtered. The role of the bivalves can also be filled by other fauna such as the chaetopods in the fjords of West Jutland.
Most benthic fauna are long-lived relative to the planktonic organisms. By their nature, the adult fauna, which often lie buried in the fjord bed, is not particularly mobile. This means that examination of the benthic fauna of an area may provide an understanding of conditions over an extended previous period. Benthic fauna propagate by their larvae living free in the water for a longer or shorter time before settling on the bed.
Status
The status of benthic fauna in the fjord areas based on county reports is shown in Table 6.11.
Table 6.11
Overall review of the state of benthic fauna in the theme fjords in 1995. The
review is regionalised for practical reasons and does not discriminate between depletion
and acute depletion – for detailed information refer to the county theme reports
| West Jutland fjords | The benthic fauna biomass in both fjords was the highest measured since 1989. In both fjords the biomass is dominated by pollution-tolerant bristle worms. Grĺdyb tidal zone has a very high population of benthic fauna. |
| Limfjorden | Limfjorden features large natural variations in its population of benthic fauna. Bivalves are the most significant group in many areas. Oxygen depletion in 1994 and 1995 had a negative impact and the benthic fauna is generally affected by pollution. |
| East Jutland fjords | Here shellfish are the dominant fauna. There have been marked improvements in the inner Horsens Fjord and the outer part of Vejle Fjord since the acute oxygen depletion of 1989. Subsequent occurrences have been too short to cause lasting damage to the fauna, although it is generally affected by pollution. Dead creatures were found in the western part of Aarhus Bight associated with oxygen depletion. Studies of bivalve growth have shown that oxygen depletion has a negative effect. It can also be demonstrated that bivalve growth was not optimal in 1995 as a result of oxygen depletion. |
| South Jutland fjords | Bivalves are also the dominant group here in terms of biomass, but in terms of numbers they have been overtaken by small bristle worms at a number of stations. Oxygen depletion had harmful results in Genner, Aabenraa and Flensborg Fjords, but in general, the number of species rose. |
| Funen fjords and coves | Bristle worms predominate in the benthic fauna of Odense Fjord, which is shallow and thus not affected by oxygen depletion. The same applies to the shallow part of the South Funen Archipelago. In the other areas the fauna is affected by oxygen depletion. Dead benthic fauna associated with oxygen depletion was observed in Nakkebřlle Fjord and Lunke Bight in August 1995. There is no absolutely dominant group in Kertinge Cove. |
| North Zealand fjords | Oxygen depletion seriously affected the benthic fauna of Roskilde Fjord in 1994, but bivalves are still the dominant group. Bristle worms are dominant in Isefjorden. They are tolerant towards loading. In the areas with many bivalves, only common mussels are older than one year. |
| West Zealand fjords and coves | The benthic fauna of Korsřr Cove and, to a lesser degree, Kalundborg Fjord is dominated by small pollution-tolerant species. |
| South Zealand fjords | No samples of benthic fauna were taken in this area in 1995. |
Condition and trend
The benthic fauna biomass in individual fjords is shown in Figure 6.16.
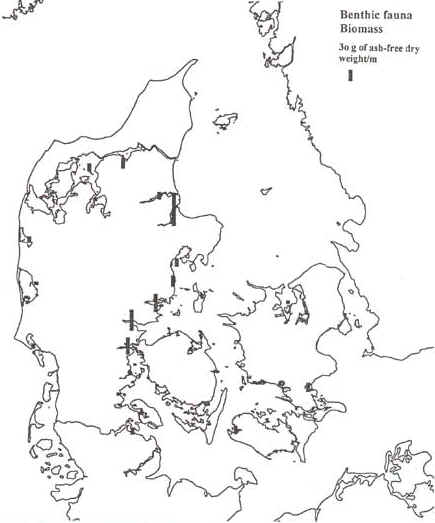
Figure 6.16
Biomass of benthic fauna in Danish fjords. Average values for 1989 to 199430 g ash-free
dry weight/m2.
Benthic fauna and nutrient enrichment
The benthic fauna of the Danish fjords has been impoverished and reduced over a long period. For example, some 20-25 species have disappeared from Roskilde Fjord since the turn of the century. A number of these species that are most sensitive to oxygen depletion have also disappeared from the South Funen Archipelago and Limfjorden. Thus, the general picture is that the benthic fauna has been severely affected by pollution, but there have been a number of improvements over recent years, for example in Aarhus Bight, Randers Fjord and Kertinge Cove. Some of these improvements were observed already before the introduction of the Action Plan for the Aquatic Environment. In most places, the improvements are related to improved waste water treatment. However, in most places no improvements have been demonstrated and, in some, conditions have worsened further in recent years. This was the case in the inner part of Roskilde Fjord, which was hard hit by oxygen depletion in 1994.
The National Environmental Research Institute has carried out statistical analyses to determine whether nitrogen and phosphorus loading affect the amount, number and diversity of species of benthic fauna. No correlation was established between nutrient input and numbers of creatures or species, but there was a positive effect on the amount of benthic fauna (biomass).
Benthic fauna and oxygen depletion
It has been attempted to correlate the growth of abra-mussels with the amount of phytoplankton and oxygen depletion. It appeared that bivalves grew larger the greater the sedimentation of planktonic algae, provided there is no oxygen depletion. In periods of depletion the mussel growth came to a standstill. In Aarhus Bight, 1995 featured very high and extended oxygen depletion and the new year’s bivalves hardly grew at all and only reached lengths of about 3 mm. In 1990 when conditions were much better, lengths of 10 mm were achieved. It was not possible for the analysis by the National Environmental Research Institute to quantify the effect of oxygen depletion, the reason presumably being that many of the stations where benthic fauna is sampled are located exactly in places which, as experience has shown, are not to be subject to depletion to any particular extent.
6.4.6 Heavy metals and contaminants
Heavy metals in sediments
The Danish EPA (1983) has established guideline limits for a range of heavy metals in diffusely loaded surface sediments. These values are set out in Table 6.12.
Values more than twice those in the table can be an indication that waste water polluted with heavy metals is being discharged into the recipient (The Environmental Protection Agency, 1983).
Table 6.12
Heavy metal content (mg/kg loss by combustion) in diffusely loaded surface sediment
(The Environmental Protection Agency, 1983)
| Lead (Pb) | 350 |
| Copper (Cu) | 250 |
| Chromium (Cr) | 150 |
| Mercury (Hg) | 2 |
| Zinc (Zn) | 1300 |
| Cadmium (Cd) | 10 |
Limfjorden: Sediment samples were taken during 1988-1991 in Limfjorden as part of the Limfjorden Partnership’s general monitoring programme. The fjord was split up into six parts, samples from which were analysed for the heavy metals As, Pb, Cd, Cr, Cu, Hg, Ni, Sn, Va and Zn.
The general conclusion of the investigation was that the levels of most of the heavy metals were generally lower than the guideline limits in tables 2 and 3 except in localised areas near urban or industrial discharges (Viborg county, 1994).
Mariager Fjord: High levels of a number of metals were found in the inner part of Mariager Fjord in 1981-1983. The Hg content was nine times higher here than in the middle or outer fjord. A follow-up study in 1989 produced similar results. The Hg level of 2.0-9.4 mg/kg exceeded the limits by a factor of 2-5 as compared with diffusely loaded surface sediment (North Jutland County, 1990). The sources of the heavy pollution can presumably be found among present and historical waste water outfalls and illegal, unregistered discharges via the surface water system and even direct discharges into the fjord (North Jutland County, 1990).
Nissum Fjord: The presence of 10 different heavy metals in sediment samples from the brackish area of Nissum Fjord was studied in 1989.
The conclusion was that the Ni content of sediments from Nissum Fjord was about three times as high as of the sediments from a number of other marine sediments. Similarly, the Cr and Zn content was a little higher than the average content of Cr and Zn in marine recipients. Cd, Pb, Cu, and Hg levels were within the fluctuations in content of the same heavy metals in sediment from a number of other marine recipients. (Ringkřbing County Authority, 1989).
The levels of As, Co, and Sn in marine recipients have not previously been routinely checked so it is not possible to compare these with the levels found in Nissum Fjord Ringkřbing County Authority, 1989).
Ringkřbing Fjord: As part of the status description of Ringkřbing Fjord tests were carried out in the autumn of 1987 on sediment from the fjord, including analyses for the heavy metals Cd, Pb, Cr, and Ni. (Ringkřbing County Authority, 1988). This showed that the concentration of these metals varied depending on the type of sediment. The highest content of heavy metals was thus found in samples drawn from surface sediments from deeper waters (Ringkřbing County Authority, 1988). Average values of Cd (6.2 mg/kg loss by combustion), Pb (161 – 204 mg/kg loss by combustion) and Cr (184 mg/kg loss by combustion) were compared with the guideline levels of the Danish EPA (see table 6.12), leading to the conclusion that Pb and Cr levels were generally below these while the Cr content exceeded the value (Ringkřbing County Authority, 1988). The average concentrations in Ringkřbing Fjord expressed on dry matter (DM) basis (Cd: 0.33 mg/kg DM, Pb: 9.1 mg/kg DM, Cr 8.5 mg/kg DM, and Ni; 7.8 mg/kg DM) were comparable with those in non-enriched or only slightly enriched coastal waters. (Ringkřbing County Authority, 1989).
Heavy metals in fauna and flora
Horsens Fjord: Studies were carried out from 1987-1994 of heavy metal content in common mussels from Horsens Fjord which showed that the Hg and Cd content was rising while that of Cu, Ni, Pb, and Cr had generally fallen. The Zn level was relatively high, but did not rise during that period. (Andersen, J.T. & Dall, P., 1995).
The mean concentrations of Hg rose from approx. 0.6 mg/kg DM in 1987 to approx. 0.25 mg/kg DM in 1994. Cadmium concentrations had risen from approx. 0.4 to 1.4 mg/kg DM over the same period. In the later years of the study, the levels of both Hg and Cd were above those found in a number of studies in Western Europe and the USA. It was still less than the threshold limit for shellfish for consumption and therefore does not give rise to health concerns. (Andersen, J.T. & Dall, P., 1995).
Roskilde Fjord: The heavy metal content in common mussels from the various stations in Roskilde Fjord was studied in June 1991 (the Water Quality Institute (WQI, 1992). Unlike Cd and Ni, which were at the same level, higher levels of Cu, Hg, Pb, Cr, and Zn were measured in mussels from near Roskilde than in those harvested further out in the fjord, the Broad (WQI, 1992). The difference in Cr was very high – a factor of 67 – while for other metals the factor varied between 1.5 and 3.7 (WQI). At the station in between, the values for Cd, Cu, Ni, and Cr were at the same levels as in the Broad and at a mean level relative to Roskilde and the Broad for Pb, Hg and Zn (WQI, 1992).
Roskilde Fjord – Frederikssund: Frederiksborg County carried out analyses for selected heavy metals (Hg, Cd, Pb, Cu, Cr, Zn) in mussels collected around the outfall from Frederikssund sewage treatment plant in Roskilde Fjord.
An elevated level of Cu (21 mg/kg DM) in mussels was identified. Concentrations of Hg, Cd, Pb, Cu, and partly Zn in mussels around Frederikssund were at similar levels or lower than those in Roskilde Broad (the 1991 study) whereas Cr content was higher (0.67-1.2 mg/kg DM) (WQI, 1992).
Roskilde Fjord – Frederiksvćrk: The heavy metal loading in the northern part of Roskilde Fjord around Frederiksvćrk was studied in 1990. (WQI, 1991). The study encompassed transplantation of common mussels, collection of naturally-occurring mussels on navigation buoys and collection of eelgrass at various distances from Frederiksvćrk.
In naturally-occurring mussels from buoys a gradient of increased Zn values was found up to a distance of 1.5 km from Frederiksvćrk, whereas no such gradients could be established for Cd, Cu, or Pb (WQI, 1991). The highest values of Zn measured had been increased by a factor of 2 above the background levels of about 80 mg/kg DM.
Transplanted mussels showed clear gradients and increased levels of Cu, Pb, Zn, and Cd 1-3 km to the west and south-west of Frederiksvćrk, and for Zn and Cd at a greater distance south of Frederiksvćrk (WQI, 1992). The highest concentrations were measured in the Steelworks Harbour and Slag Jetty. Pb was higher than background levels by a factor of 4-5 while for Cd, Cu, and Zn the factor was 2.
No gradients could be proven in Cd, Pb, Cu, and Zn concentrations in eelgrass samples. Compared with previous eelgrass studies around the Masnedř power station in Storstrřmmen and in Limfjorden, the level of Cu (8.9 mg/kg DM), Pb (2.4 mg/kg DM) and Zn (141 mg/kg DM) was about 2-5 times higher around Frederiksvćrk.
Biological effects were elucidated by studying the mortality and growth of transplanted mussels (WQI, 1991). There were no indications of acute effects in the form of increased mortality related to heavy metal loading or other factors such as freshwater effects (WQI, 1991). Similarly, the conclusion was that despite negative correlations between soft part growth and the presence of heavy metals, the concentrations were at a level where no growth-inhibiting effects were to be expected (WQI, 1991).
Occurrence and effects of contaminants
A range of contaminants used in large amounts annually in Denmark such as LAS (surface active substances), phthalates (plasticisers), alkyl phenol ethoxylates (detergents) and growth-inhibitors TBT and Irgarol (antifouling paints for ships) all have the potential for ending up in the aquatic environment. As research results have documented aquatic effect concentrations of the relevant substances at very low levels, and as some of them have been shown to have oestrogen-like effects on fish and mammals (Danish EPA, 1995b; TemaNord, 1996), there is a need to survey possible effects in, among other areas, the aquatic environment of these groups of substances.
At present there has been no systematic study of the occurrence and effects of these materials in Danish fjords. For this reason it has not been possible to assess the loading by these substances or their effects on the fjord systems in Denmark.
Various research projects will be initiated over the coming years related to contaminants, one aim of which being to cast light on this problem.
6.4.7 Conditions compared with objectives
The County Councils through their regional plans define the environmental objectives in the fjords. Most have a general objective, meaning that only mild effects of human impact on flora and fauna are acceptable and that the water should be of a good hygienic quality. The properties focused on when requirements are set depend on the character of each individual water body.
Target criteria
To assess whether an area meets its objectives as clearly as possible, parameters are often chosen that are easy to quantify. At the same time, knowledge is needed how the parameter varies in step with changes in the environmental condition. Nevertheless, the assessment will ultimately often depend on an overall estimate, partly because our knowledge of the mechanisms which determine the development of the parameters chosen is incomplete. Mostly, pollution by nutrients and organic matter is of interest. Oxygen depletion is often used to assess such a situation. The reason for this is partly that an unnatural occurrence of oxygen depletion is a good indicator of the fact that nutrients or organic matter are being or have been input, and partly that oxygen depletion is very significant to parts of the ecosystem. Vegetation depth limits, which depend especially on the clarity of the water, also summarise the state of the environment over a longer period of time. The composition and amount of benthic fauna is also used as a criterion. Here the dependency on good oxygen conditions and ample food determines the condition. Areas loaded with large inputs of nutrients will often be characterised in that filamentous algae or annual green algae are favoured at the expense of other types of vegetation. An increased presence of such organisms also offers a useful indicator of unacceptable conditions. Finally, an increased amount or production of planktonic algae is a well-known sign of nutrient input.
Status
Table 6.13 shows the counties’ assessments of the current conditions relative to targets. In the column headed "status", a minus sign means that the target is not considered met, a plus sign that it has been met. The "criteria" column lists the parameters used to assess the state. The column "action" designates the types of sources where, in the professional opinion of the counties, further action seems most appropriate. The table deals with entire fjords or water areas; local conditions may not be fully taken into consideration.
Table 6.13
Review of the current environmental conditions in fjords relative to their targets.'
| Fjord | Status | Criteria | Action |
| Limfjorden | - | Oxygen depletion, eelgrass depth limit, benthic fauna | Limiting of loading from farmland |
| Ringkřbing Fjord | - | Flora depth limit, Secchi depth, plankton | Water change, limiting of loading from farmland |
| Nissum Fjord | - | Flora depth limit, Secchi depth, plankton, benthic fauna | Limiting of loading from farmland |
| Grĺdyb tidal zone | - | Pollution-tolerant algae, benthic fauna, plankton | Limiting of loading from open land, study of significance of water exchange pending |
| Horsens Fjord | - | Oxygen depletion, pollution-tolerant algae, nutrient salt concentrations | Limiting of loading from farmland, marine fish farming |
| Vejle Fjord | - | Oxygen depletion, pollution-tolerant algae, depth limit of vegetation | Limiting of loading from farmland, marine fish farming |
| Kolding Fjord | - | Oxygen depletion, pollution-tolerant algae, benthic fauna | Limiting of loading from farmland, marine fish farming |
| Aarhus Bight | - | Oxygen depletion, pollution-tolerant algae, depth limit of vegetation | Limiting of loading from farmland, then waste water and atmospheric loading |
| Randers Fjord | - | Pollution-tolerant algae, depth limit of vegetation, benthic fauna, plankton | Limiting of loading from farmland |
| Mariager Fjord | - | Oxygen depletion, poor diversity of phytoplankton species, , pollution-tolerant algae, depth limit of vegetation | Limiting of loading from farmland |
| Haderslev Fjord | - | Oxygen depletion, pollution-tolerant algae, nutrient salt concentrations | Limiting of loading from open land, establishing wetlands |
| Aabenraa Fjord | - | Oxygen depletion, pollution-tolerant algae, nutrient salt concentrations | Limiting of loading from open land, establishing wetlands |
| Augustenborg Fjord | - | Oxygen depletion, pollution-tolerant algae, nutrient salt concentrations | Limiting of loading from open land, establishing wetlands |
| Flensborg Fjord | - | Oxygen depletion, pollution-tolerant algae, nutrient salt concentrations | Limiting of loading from open land, establishing wetlands |
| Odense Fjord | - | Pollution-tolerant algae, nutrient salt concentrations, sanitary conditions | Limiting of loading from farmland, waste water outfalls, a disposal site, and the atmosphere, establishing wetlands |
| South Funen Archipelago | - | Oxygen depletion, pollution-tolerant algae, nutrient salt concentrations | Limiting of loading from farmland, establishing wetlands |
| Kertinge Cove | - | Pollution-tolerant algae, nutrient salt concentrations | Limiting of loading from farmland, establishing wetlands |
| Isefjord | - | Oxygen depletion, pollution-tolerant algae, occurrences of sludge | Limiting of loading from farmland and waste water outfalls |
| Roskilde Fjord | - | Pollution-tolerant algae, flora depth limits, macrofauna | Limiting of loading from farmland and waste water outfalls |
| Kalundborg Fjord | - | Oxygen depletion, pollution-tolerant algae, flora depth limits, macrofauna | Limiting of loading from farmland |
| Korsřr Cove | - | Pollution-tolerant algae, occurrences of sludge, benthic fauna | Limiting of loading from farmland |
| The Broad (Guldborg Sound) | - | Pollution-tolerant algae, phytoplankton | Limiting of loading from farmland, establishing wetlands |
| Stege Bight | + | Conditions of vegetation, benthic fauna | |
| Karrebćk Fjord | - | Pollution-tolerant algae, phytoplankton | Limiting of loading from farmland, establishing wetlands |
| Dybsř Fjord | - | Pollution-tolerant algae, phytoplankton | Limiting of loading from farmland, establishing wetlands |
| Prćstř Fjord | - | Pollution-tolerant algae, phytoplankton | Limiting of loading from farmland, establishing wetlands |
| Nakskov Fjord | - | Pollution-tolerant algae, phytoplankton | Limiting of loading from farmland |
The table shows that the environmental condition in nearly all fjord areas is worse than planned and that action on agricultural nutrient inputs is considered necessary to achieve an acceptable quality.
[Front page] [Contents] [Previous] [Next] [Top] |