| The Aquatic Environment in Denmark 1996-1997 | ||||
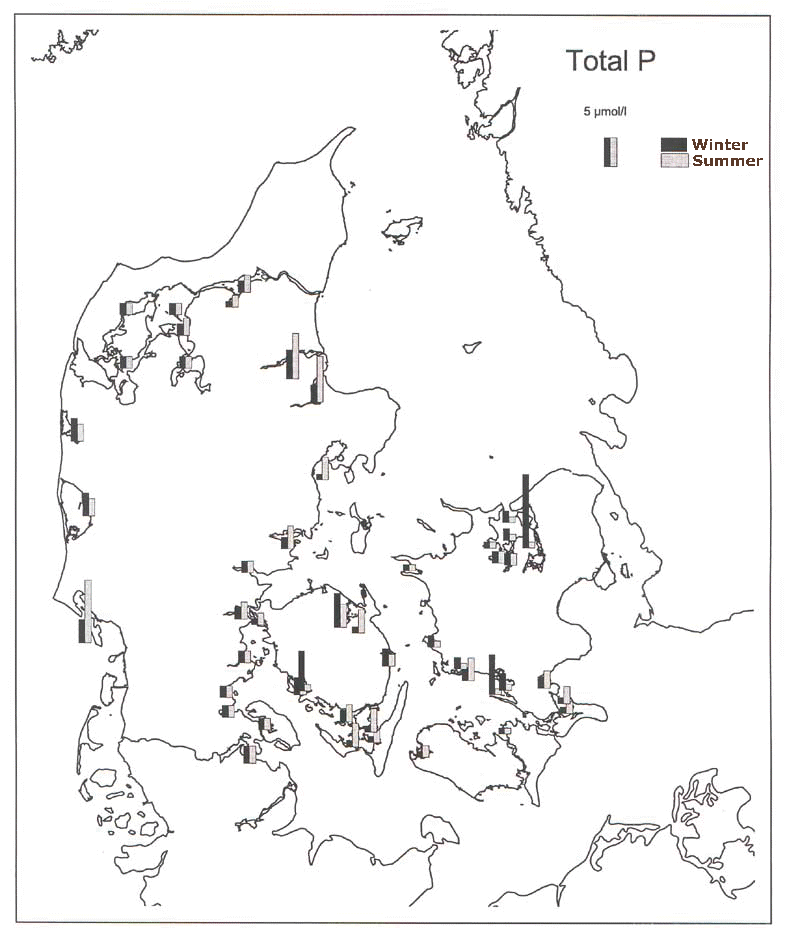
| Figure 6.3 Nutrient content of Danish fjords expressed as averages of time-weighted mean values of total phosphorus for summer (May-September incl.) and winter periods (Individual ind-February incl.) in the years 1989 to 1994 (from Kaas et al., 1996). |
||||
 |