Indicator Report
11. Industry, trade and services
Objectives
Initiatives for a sustainable society and initiatives for future welfare must go hand in hand. Funding the welfare society of the future will require that private production grows and creates more wealth. Sustainable development requires that production and consumption is developed so that resource consumption is optimised and adverse environmental and health effects are reduced appreciably. We can achieve this by making it attractive to incorporate environmental considerations not only into company business procedures, but also into every link of the chain from production to consumption and disposal. Companies play a key role in bolstering the utilisation and development of environmentally friendly technologies.
Authorities, businesses and consumers have a common interest in working together to create a market where consideration of the environment is central for competition between enterprises, and for consumption of goods and services. Combined with new market based instruments and voluntary initiatives, market forces will motivate the corporate sector and consumers to participate actively in this development. Regulations in the EU and in Denmark will continue to make up part of the foundation for enterprises' environmental initiatives.
Another objective of the Government is that Danish enterprises and investors should be able to easily document their environmental initiatives and that consumers are allowed easy access to information on environmental impacts from manufacturing processes.
Developments - a summary
The number of manufacturers applying for licences for their products has increased steadily from 1998 to 2000. The figures mainly comprise licences for the Swan (the Nordic eco-label), which was introduced in earnest in 1998. With few exceptions, the trends are positive for other product groups.
The increase in the number of eco-labelled products available shows that there is a market for environmentally friendly products. This also shows that the market can be used to support sustainable development. The increase in the number of ecolabelled products has been particularly pronounced in recent years, and in 2001, more than 2,350 ecolabelled products were widely available. The most commonly seen eco-label is the Swan label, but the Flower (the EU eco-label) is also making good progress. In 1999, only two products bore the Flower, and in 2000 the corresponding number was seven. In 2001, however, the number of Flower-labelled products increased to 54.
Environmental management is one way of integrating environmental concerns into production. In this manner, enterprises assume responsibility for ensuring a more environmentally friendly production chain. Since 1994, the number of enterprises with certified environmental management in the form of EMAS and ISO 14001 has increased year by year. Denmark is among the European countries which have the greatest number of EMAS registered enterprises compared to the size of the population (topped only by Austria). Developments in the number of EMAS and ISO registered enterprises show that it is possible to use environmental concerns as a competitive parameter.
Resource efficiency has improved. Following strong growth from 1995-96, energy consumption and drinking water consumption fell significantly up until 2000. During the period 1996 to 2000, there was a relative decoupling of energy and drinking water consumption from economic growth.
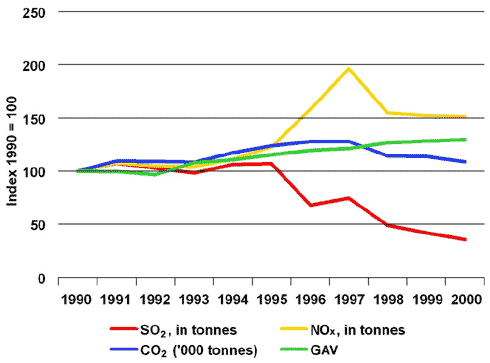
Since 1990, emissions of CO2 and NOX from industries have largely followed the rate of increase of the industries' gross value added (GVA). This development is primarily the result of the fact that increased activity within the industrial sector has entailed greater energy consumption. When comparing developments in CO2 and NOX emissions with the increase in GVA during the late 1990s, we see a trend towards relative decoupling as emissions become stabilised or decrease. By contrast, emissions of SO2 remain almost constant up until 1995. After this time, there is an absolute decoupling of industrial growth from SO2 emissions.
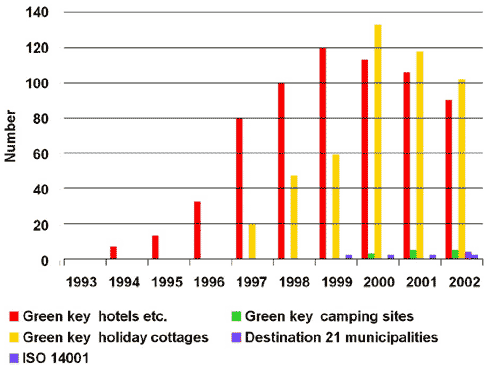
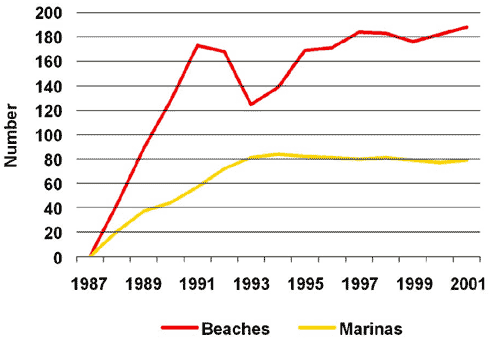
As regards tourism, eco-labelling promotes upgrading and improvement of tourist areas and the environmental standard of tourist facilities. From 1993 to 2000, there was an increase in the number of environmentally certified tourist enterprises, particularly within the Green Key scheme. After restructuring and new requirements were introduced, however, a decline has been observed. By contrast, participation in other labelling schemes, e.g. Destination 21, has gone up. The Blue Flag signals that beaches/marinas which fly it have made an extra effort to protect the environment. The number of Blue Flags has risen throughout a number of years. In the last couple of years, this increase has been particularly pronounced for beaches, whereas the level for marinas has remained relatively stable in recent years.
Perspectives for development of indicators
The objective is to carry out further development of the indicators within this area. Parts of this work are already being carried out within the various sectors of the area.
It would be relevant to develop specific indicators for the scope of sustainable investments in society; or more specifically for how the financial sector incorporates environmental concerns into their investments. This might initially involve the number of green ethical investment associations and the extent of green/ethical investments made within these associations. In the long term, it would also be desirable to have figures for the total sustainable investments in society.
In order to monitor developments as regards cleaner technologies and products and their extent, the opportunities for establishing an indicator for the market share of sustainable technologies will be addressed. The target is a continual reduction in the environmental impact from production enterprises. Therefore, work will be carried out to develop indicators for resource efficiency at various sectoral levels. In order to elucidate the extent of chemical use within the industrial sector, work is being carried out to develop an indicator for industrial consumption of chemicals.
It may be relevant to investigate the opportunities for developing an indicator for the percentage of total consumption accounted for by eco-labelled products. This indicator may eventually replace the number of eco-labelled products.
The strategy emphasises the need for creating scope for new solutions, radical innovation, and new technologies. It may be expedient to consider the opportunities for elucidating Danish innovative competencies by means of an indicator, e.g. based on the European Innovation Scoreboard.
Indicator 11.1:
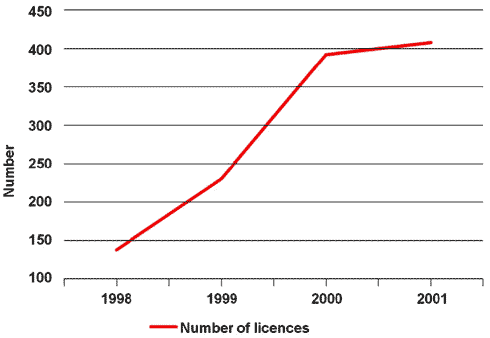
Number of licences for eco-labelled products
Source: Eco-labelling Denmark
This indicator elucidates developments in relation to the objective of creating an efficient green market. The figures provide an overview of the number of licences granted for Denmark's two official eco-labels, the Nordic Swan and the EU Flower. The figures do not indicate the total number of manufacturers with licences, as a single manufacturer may well hold licences for several products.
The number of manufacturers applying for licences for their products has increased steadily from 1998 to 2000. The figures mainly comprise licences for the Swan, which was introduced in earnest in 1998. The decrease in the number of licences from 2000 to 2001 is caused by a drop in the number of Swan licences for paper for printing, as the major manufacturers no longer thought it advantageous to keep their licence. The increase does, however, continue for other product groups.
The objective is to have as many products as possible ecolabelled in order to have the market support sustainable development. Apart from the reduction in Swan-label licences on paper for printing, trends are positive for the other product groups.
Indicator 11.2:
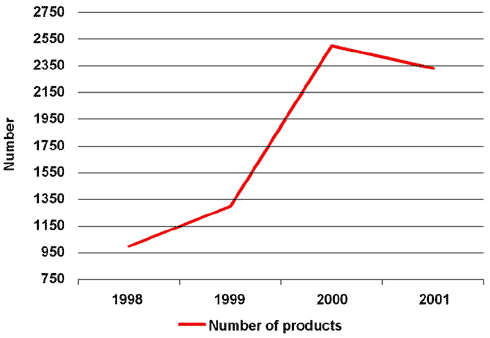
Number of eco-labelled products, analysed as the number of trade names
Source: Eco-labelling Denmark
This indicator provides insights into developments as regards the number of eco-labelled products on the market. The figures comprise Swan-labelled and Flower-labelled products. In relation to indicator 11.1, the figures show that a licence may involve several trade names (which are sold to different retailers). This is particularly true within the printed matter industry. Until the summer of 2001, it also applied to the paper product area.
During the period 1998 to 2000, the number of widely available eco-labelled products has risen steadily. The most commonly seen eco-label is the Swan label, but the Flower is making good progress. In 1999, only two products bore the Flower, and in 2000 the corresponding number was seven. In 2001, however, the number of Flower-labelled products increased to 54. This increase coincides with the eco-labelling campaign initiated in 2001. The decrease in the number of product licences from 2000 to 2001 is caused by a drop in the number of Swan licences for paper for printing, as the major manufacturers no longer thought it advantageous to keep their licence. The increase does, however, continue for other product groups.
The objective is to have as many products as possible ecolabelled in order to have the market support sustainable development. Apart from the reduction in Swan-label licences on paper for printing, trends are positive for the other product groups.
Indicator 11.3:
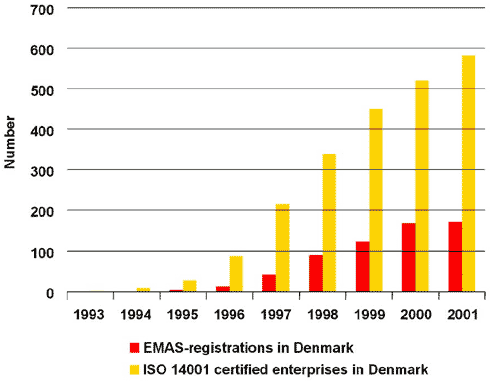
Number of EMAS and ISO registered enterprises
Source: The Danish Environmental Protection Agency
This indicator has been chosen to elucidate developments in relation to the ability of enterprises to use their environmental efforts as a competitive parameter. The EMAS (EcoManagement and Audit Scheme) is the common European scheme for environmental management and environmental auditing. ISO 14001, which replaced BS 7750 in 1996, is the international standard for environmental management. The numbers in the figures are accumulated and show the number of EMAS registered and ISO 14001 certified enterprises in Denmark. Many EMAS registered enterprises are also ISO 14001 certified.
Since 1994, the number of enterprises using environmental management has gone up every year. One reason why the increase in the number of EMAS registered enterprises from 2000 to 2001 is smaller than before is that the method of analysis has been changed in connection with the adoption of the new EMAS Regulation in 2001. Denmark is among the European countries which have the greatest number of EMAS registered enterprises compared to the size of the population (topped only by Austria).
The objective is to ensure that enterprises can increasingly use their environmental efforts to give them a competitive edge. Positive developments in the number of EMAS and ISO registered enterprises contribute to reaching this objective.
Indicator 11.4:
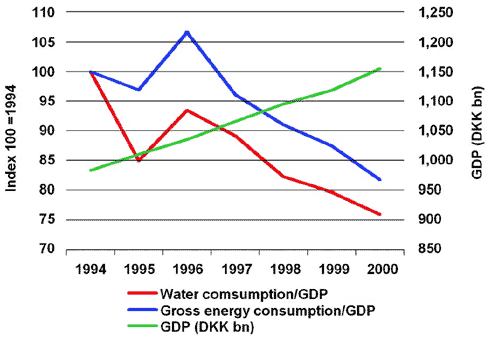
Index for the manufacturing industry's resource efficiency for energy and water in
relation to GDP
Source: The Danish Environmental Protection Agency
This indicator elucidates how growth and the environment increasingly go hand in hand. The figure shows the correlation between developments in energy consumption and water extraction, and economic growth.
Resource efficiency has improved. Following strong growth from 1995-96, energy consumption and drinking water consumption fell significantly up until 2000. During the period 1996 to 2000, there was a relative decoupling of energy and drinking water consumption from economic growth.
During the period 1996 to 2000, there was a relative decoupling of energy consumption and water extraction from economic growth. This was particularly evident for water extraction.
Indicator 11.5:
Changes in industrial sector emissions of CO2, NOX, SO2,
and changes in GVA Source: The National Environmental Research Institute, Denmark
This indicator illustrates developments as regards the objective on how growth and the environment should increasingly go hand in hand. Emissions of CO2, SO2 and NOX primarily occur from the industrial sector's own energy plants. Emissions may, however, also occur in connection with production processes.
Since 1990, emissions of CO2 and NOX from industries have largely followed the rate of increase of the industries' gross value added (GVA). (The increase in NOX indicated for 1995-97 is due to better methods of calculation). This development is primarily the result of the fact that increased activity within the industrial sector has entailed greater energy consumption. When comparing developments in CO2 and NOX emissions with the increase in GVA during the late 1990s, we see a trend towards a relative decoupling as the added value continues to grow while emissions of CO2 and NOX are stabilised or decrease. By contrast, emissions of SO2 remain almost constant up until 1995 and then decrease significantly. Thus, there has been an absolute decoupling of economic growth in the industrial sector from SO2 emissions. This development is due to requirements for less sulphurous fuels and introduction of flue-gas purifying plants. As of 1996, emissions have decreased markedly. This can be attributed to the introduction of a tax on sulphur in 1996.
Even though there is a trend for relative improvements in industrial emissions of CO2 and NOX in relation to production, economic growth and increased consumption will nevertheless necessitate constant development of products and technologies in order to reduce pollution, thereby ensuring a true decoupling of economic growth within the sector from environmental impacts.
Indicator 11.6:
Number of tourist enterprises that participate in eco-labelling schemes
Source: The Scientific Data Centre for Recreation and Tourism at the Danish Forest and
Landscape Research Institute
This indicator illustrates developments as regards environmental initiatives within tourism in the form of participation in ecolabelling schemes Green Key, Destination 21, EMAS, the Flower, ISO 14001, and the Swan label.
From 1993 to 2000, there was an increase in the number of environmentally certified tourist enterprises, particularly within the Green Key scheme. After restructuring and introduction of new requirements, however, a decline has been observed. By contrast, participation in other labelling schemes, e.g. Destination 21, has gone up.
Eco-labelling promotes upgrading and improvement of tourist areas and the environmental standard of tourist facilities. Therefore, the decline in participation in eco-labelling schemes is counterproductive.
Indicator 11.7:
Number of Blue Flag beaches and marinas
Source: Danish Outdoor Council (2002)
This indicator elucidates the objective concerning clean and safe bathing conditions. The number of "Blue Flag beaches and marinas" indicates how many beaches and marinas have been awarded the Blue Flag. The Blue Flag signals that the beach or marina which flies it has made an extra effort to protect the environment. In addition to this, a Blue Flag indicates that the relevant beach or marina is clean, has safety equipment, clean toilet facilities, waste facilities, etc.
The number of Blue Flags has increased again this year. In recent years, the increase has been most pronounced for beaches. This year, there are 12 more beaches with the Blue Flag than last year, while the number of "Blue Flag" marinas has remained unchanged. The reason for this development is a growing interest in making an extra effort to protect the environment, as well as the population's desire for a clean marine and coastal environment.
The objective is to work for a clean environment through information and an increase in the number of "Blue Flag" beaches and marinas in order to ensure recreational opportunities for tourists and local citizens. The objective is well on its way to being fulfilled.