Indicator Report
15. Measures and knowledge base
Objectives
A forward-looking commitment to the environment and sustainable development may stimulate competitiveness and the transition towards the knowledge economy. Paying attention to environmental concerns should be economically beneficial. This is why those who manufacture, supply, consume and finally dispose of products should bear the environmental costs. Technological breakthroughs and innovation are necessary to redirect society towards sustainable development. We need a solid knowledge base for making the right decisions and prioritising activities. Environment policy needs to be knowledgebased and build on the precautionary principle.
Developments - a summary
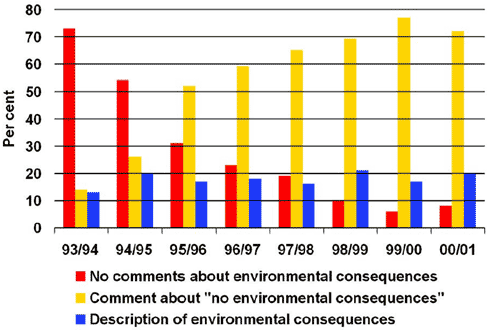
The percentage of legislative proposals which include descriptions of their environmental impacts has remained stable since the parliamentary session 1994/1995. During the period since 1993, there has been a decrease in the number of legislative proposals that have been passed without comments regarding their environmental impacts. The number of Bills with an active assessment of the environmental impacts of the proposal (either "with" or "without" comments) has increased to 90 per cent of all proposals.
There has been an increase in public-sector incorporation of environmental areas during the period 1997 to 2002. In 1997, a total of 47 ministries, agencies, and other state institutions provided information on environmental initiatives. In 2001, this figure has gone up to 199 out of a total of 350 state institutions.
There is an increasing public demand for leisure activities in nature. Nature guidance is one way of creating greater awareness of nature. The number of nature guides has risen from 128 in 1994 to 250 in 2001. These guides are either full-time employees or freelancers, and carry out approximately 21,000 activities a year for audiences numbering a total of 800,000 participants.
Within the education sector, the "Green Flag" campaign is an indicator for environmental teaching in schools. The number of Green Flags has increased significantly, from 19 in 1994 to 165 in 2002. There are other education schemes which focus on environmental awareness, but the "Green Flag - Green School" scheme is special because the entire school participates in the process of addressing a number of themes.
The period 1993 to 1998 saw relatively high growth in public as well as private investments in research and development. Investments have stagnated since then. Approximately one-third of total investments in research and development are made by the public sector, whereas private businesses account for the remaining two-thirds. In 1999, Danish investment in research and development corresponded to approximately 2 per cent of GDP. Denmark is committed to the EU objective stipulating that investments in research and development should account for at least 3 per cent of GDP before 2010.
Perspectives for development of indicators
There are plans to develop an indicator which illustrates the extent to which environmental taxes incorporate environmental costs in prices - or, in other words, the extent to which external costs are internalised. One option would be to base such an indicator on surveys of the socio-economic cost of the environmental impact of an emission/discharge which is subject to taxation or the cost of consumption of a taxed product. If the taxes per discharged unit are compared to the costs, the resulting ratio constitutes an index for internalisation. It may, for instance, appear that one particular tax corresponds to 102 per cent of the external costs, while another accounts for only 40 per cent. A total index for internalisation of external costs can then be constructed by weighting each individual index with the value of the total environmental impact associated with the relevant discharge/ emission/consumption.
It would also be relevant to develop the indicator for research and development with a view to providing more details on how research and development supports sustainable development. This could be done by introducing subcategories addressing e.g. research on technological innovation and research related to environmental issues.
As a result of the Danish Ministry of Education's authorisation of an Agenda 21 for training in the Baltic region (Baltic 21E), work will continue on developing indicators for Baltic 21E:The forthcoming indicators will be based on the objectives and action plans outlined in Baltic 21E. This means that they will also be related to national proposals for indicators.
Indicator 15.1:
Environmental impact assessments of Bills
Source: Ministerial reports on environmental efforts in offices, agencies, and
institutions.
This indicator concerns the objective stipulating that decisions at all levels should be assessed in relation to the environment. The figure provides an overview of the number of legislative proposals which include comments on environmental impacts.
The percentage of legislative proposals that include descriptions of environmental consequences has remained stable since the parliamentary session 1994/1995. Thus, comments on environmental impacts were included in approximately 20 per cent of all proposals made during the parliamentary sessions from 1994/1995 to 2000/2001. During the period since 1993, there has been a decrease in the number of legislative proposals that have been passed without comments on their environmental impact. For the parliamentary session 2000/2001, it was 8 per cent. The relative share of legislative proposals that result in the comment "No environmental impacts" has gone up from 14 per cent during the parliamentary session 1993/1994 to 72 per cent during the parliamentary session 2000/2001.
The relative incidence of Bills with and without comments on environmental impacts seems to have become stabilised at a level where environmental impacts are assessed for more than 90 per cent of all legislative proposals.
Indicator 15.2:
Proportion of government institutions which have reported a green procurement policy
Source: Ministerial reports on environmental efforts in offices, agencies, and
institutions.
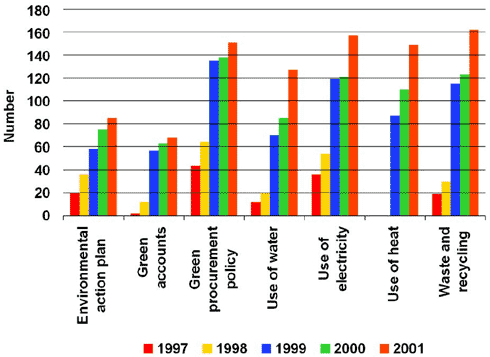
This indicator serves to illustrate public sector inclusion of environmental considerations in their procurement policy. Management of day-to-day activities has an impact on the environment, e.g. via green procurement policies and management of consumption of energy, heat, and water. The data used comprises 47 state institutions in 1997, 69 state institutions in 1998, 165 state institutions in 1999, 166 state institutions in 2000 and 199 state institutions in 2001.
In 1997, a total of 47 ministries, agencies, and other state institutions reported environmental initiatives. In 2001, this figure had risen to 199 out of a total of 350 state institutions.
Incorporation of all environmental areas has increased from 2000 to 2001. As the number of state institutions included in calculations has increased in relation to last year, the increases regarding environmental efforts cannot, however, be ascribed to a general raising of priority given to this area by the institutions.
Indicator 15.3:
Number of schools with Green Flags
Source: The Danish Outdoor Council
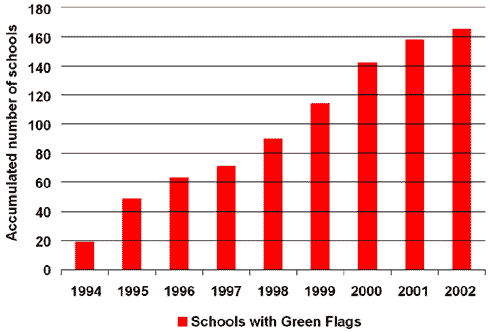
The "Green Flag" campaign is an indicator for environmental teaching in schools. The figure illustrates developments in the number of "Green Flag" schools throughout the last nine years. A "Green Flag" school is a school which has carried out one or more Green Flag activities and which flies a Green Flag as a symbol of their green initiatives. The Green Flag themes are water, energy, waste, nature, and environmental auditing.
The graph shows a steady increase in the number of schools participating in the campaign (the 2002 figure was calculated as of 1 May 2002). The number of Green Flags has increased significantly from 19 in 1994 to 165 in 2002. It should be mentioned that not all schools will fly a green flag at any given time. Participating schools receive a flag for each theme completed, and are then allowed to fly the flag for a year. Once this year is up, the requirements associated with a new theme must be met. If these requirements are not successfully met, the flag is taken down. A new flag will be issued when the school meets the new requirements.
A steady increase in the number of schools interested in the campaign ties in well with the desire for including green aspects in teaching. Other education schemes also focus on environmental teaching, but the "Green Flag - Green School" scheme is unique in that the whole school takes part in the process. The scheme not only ensures raised levels of awareness and knowledge as well as behavioural changes in the school. It also affects real resource savings at participating schools. Continued increases in participation in the "Green Flag" scheme would be most satisfactory.
Indicator 15.4:
Number of nature guides/interpreters
Source: The Danish Forest and Nature Agency
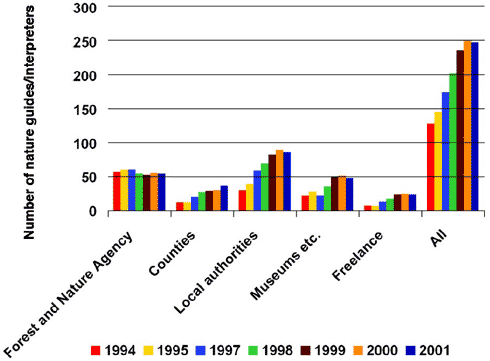
This indicator elucidates dissemination of knowledge about sustainable development. Nature guides/interpreters are individuals who carry out activities in nature with a view to creating greater awareness of nature. The nature guides are associated with the Nature Guide Scheme, a network scheme that comprises nature guides employed by central and local authorities and organisations. The nature guides work on the basis of common goals and have all completed special training on how to communicate nature issues.
There is an increasing demand for leisure activities in nature. At the same time, there is growing awareness of the fact that nature guidance is a good way of promoting appreciation of nature. The number of nature guides has risen steadily, from 128 in 1994 to 250 in 2001. Nature guides carry out approximately 21,000 activities a year for a total of approximately 800,000 participants.
Nature Guidance facilitates greater appreciation of nature and better awareness of environmental issues. Consequently, Nature Guidance constitutes an important instrument as regards the efforts made to achieve sustainable development. The aim is to develop nature activities which promote understanding for sustainable development. The nature guides are specifically trained to participate in this process.
Indicator 15.5:
Total funds for research and development
Source: The Danish Institute for Studies in Research and Research Policy
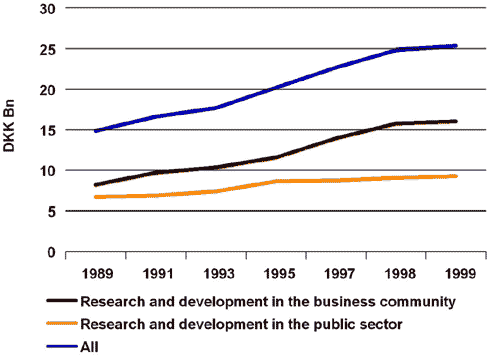
This indicator elucidates developments in the knowledge base. The figure shows the total Danish investments in research and development for the period 1989 to 1999. No data is available for the period after 1999. Calculations are carried out at constant 1999 prices.
The period 1993 to 1998 saw relatively high growth in public as well as private investments in research and development. The level of investment has stagnated since then. In 1999, Danish investments in research and development corresponded to approximately 2 per cent of GDP. This figure was slightly below the 1990 objective stipulating that Denmark should conform to the OECD average, which was 2.23 per cent in 1999. Approximately one-third of the total investments in research and development are made by the public sector, whereas private business accounts for the remaining two-thirds. Investment levels have increased more rapidly within the business sector than within the public sector. The ratio between public and private sector investments will soon be 1:4, unless public-sector investments increase significantly in the years to come. Investments in research and development are traditionally considered to provide better opportunities for economic growth.
They also bolster a country's potential for achieving its specific objectives, including environmental objectives. Denmark is committed to the EU objective stipulating that investments in research and development should account for at least 3 per cent of GDP before 2010. According to the Research Commission's report from 2001, this entails that Denmark's total investments in research and development should be increased from the approximately DKK 25 billion invested in 1999 to DKK 45 billion in 2010.