Indicator Report
14. Urban and housing development
Objectives
The Government's primary objective is to promote sustainable development of towns, housing and buildings. Residents and users in individual urban and housing areas should participate actively in this development, for instance through a lifestyle that calls for everybody to consider the environment and limit resource consumption as much as possible in their everyday lives. Towns and cities must secure a framework for continued growth and they must provide attractive localisation for new businesses. With respect to social life, buildings and infrastructure, towns must be organised and managed with a view to significantly reducing resource consumption and environmental impacts. There must be greater productivity and efficiency in construction. Towns and cities must be alive and diverse, and they must be improved as a framework for good and equal integration of everyone in Danish society. The individual parts of towns and cities should offer housing, service trades, public institutions and culture, thus revitalising urban areas. The development of towns and cities must take place through private/public cooperation.
Older business districts and dock areas must be utilised better by renovating them for other uses. In this way, an attractive diversity in a town's supply of areas for business and housing is achieved. Urban transport functions should be organised so as to achieve the most effective utilisation of the overall transport system, and so that more can benefit from using public transport.
There must be a balance in the housing market, and individuals should have a real choice between renting and owning a dwelling. At the same time, new efforts will target depressed urban areas. Urban renewal creates a framework for the interplay between new and old, and it should emphasise quality, good architecture, and concern for the visual environment and urban ecology. Similarly, preservation-worthy historical environments must be safeguarded. We should also improve the quality of urban recreational opportunities.
Developments - a summary
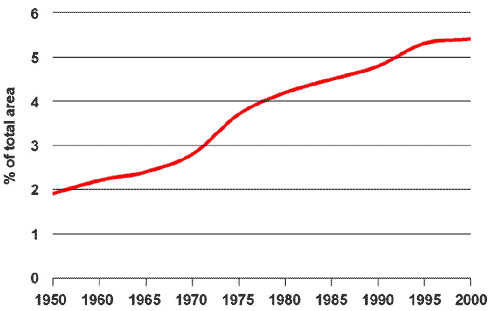
Since 1974, an area the size of Bornholm has become designated as urban zone. Even so, urban zones account for a relatively modest percentage of Denmark's total area: 6 per cent in all.
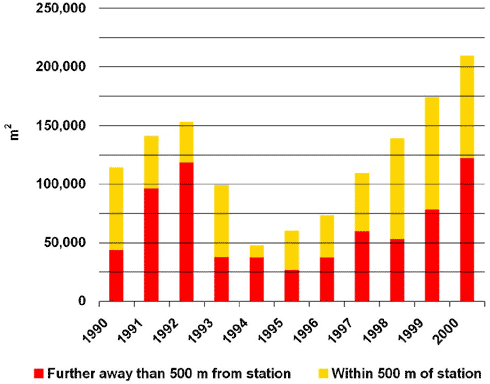
The percentage of newly constructed business premises located close to stations in the Greater Copenhagen area has not increased in the last ten years. Approximately half of all new office businesses are still not being located near stations. This development continues to present challenges for integrated area and transport planning.
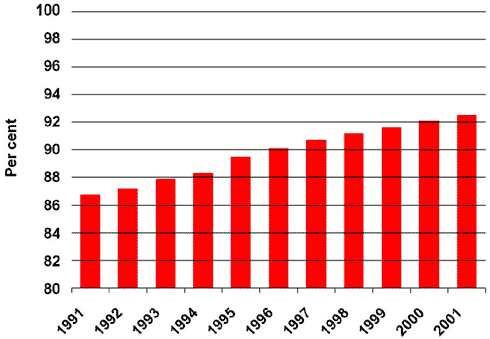
During the last ten years, the technical standard of the housing stock has improved significantly due to new construction work, modernisation, urban renewal, and demolition of the poorest dwellings. Since 1991, the number of dwellings with faulty or without installations/facilities has been reduced from 13 per cent to 8 per cent in 2001.
In the last ten years, approximately 8,500 rental dwellings have been completed each year. Of this number, private rented dwellings accounts for slightly more than 10 per cent. The Government wishes to see an increase in the supply of dwellings, e.g. by reinvigorating construction of private rented dwellings.
As regards heating of the housing stock, energy efficiency has been on the rise throughout the last ten years. Electricity consumption remained constant throughout the period. Energy consumption has remained relatively constant, even as the built-up areas have expanded by almost 8 per cent and the population has grown by 4 per cent. Water consumption within the household sector has displayed clear downward tendencies and is now low when compared to similar countries.
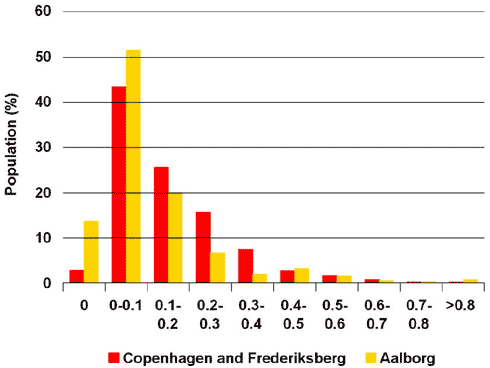
The extent of green areas available per capita varies greatly in the Danish towns and cities. A city like Aalborg has ten times more green areas per capita than Copenhagen. Close proximity to green areas continues to be an important element in connection with urban development.
Perspectives for development of indicators
It is an objective to ensure vibrant, diverse, highquality urban areas with a varied supply of dwellings. Towns and cities must secure a framework for continued growth and they must provide attractive localisation opportunities for new businesses. There is a need to investigate the opportunities for developing indicators within this area.
Indicators should be developed for social urban development which can illustrate development trends in socially disadvantaged urban/residential areas.
Following up on work carried out by the Committee for Commercial and Urban Policy, indicators for urban development and business issues will be developed. For some indicators, this can be extended with more nationwide data as these become available.
Indicator 14.1:
Area for urbanisation
Source: Nature and Environment - Selected Indicators, 2001
This indicator elucidates developments in land use for urban development. The figure illustrates urban development since 1950 as a percentage of Denmark's total area.
In the last 50 years, urban areas have tripled or quadrupled in size. Since 1974, an area the size of Bornholm has become designated as urban zone. Even so, urban zones account for a relatively modest percentage of Denmark's total area: 6 per cent all in all.
The growing urbanisation has entailed increased focus on local authority area planning with regard to a number of significant functions, e.g. use for dwellings, businesses, and service functions.
Indicator 14.2:
Proportion of recently built office facilities in the Greater Copenhagen Area which
have been built within a distance of 500 metres from an Strain station
Source: The Danish Forest and Landscape Research Institute
This indicator illustrates the interplay between urban structures and the overall transport system. The figure demonstrates developments in the extent of recently constructed office facilities located near stations. Since 1989, the Greater Copenhagen area has aimed to have new buildings with office and service facilities located within a distance of no more than 1,000 metres from particularly well-serviced S-train stations or 500 metres from other, centrally located stations.
The curve shows that in spite of this objective, around half of all new office buildings are still being located in sites that are not close to stations. In fact, the trend in the late 1990s is for 80 per cent of such office facilities to be located far away from stations in the local authorities surrounding the main city of Copenhagen.
This development means that it is becoming increasingly difficult to contribute to ensuring that commuter traffic is carried out by means of public transport, thereby reducing car transport and dependence on cars. Ensuring integrated area and transport planning is a central objective in Copenhagen, but also in other major cities such as Stockholm and Amsterdam.
Indicator 14.3:
Proportion of all dwellings which have district heating, private bath/shower
facilities, and toilet facilities
Source: Statistics Denmark
This indicator elucidates the quality and utility value of buildings. The number of dwellings without any installation shortcomings (i.e. dwellings which have district heating/central heating and in-house bath/shower and toilet facilities) constitutes 92 per cent of the total housing stock, which numbers 2.5 million dwellings. This means that dwellings with installation shortcomings account for 8 per cent of total housing stock. The most frequent shortage concerns bath facilities. A total of 6 per cent of all dwellings do not have their own bath or shower facilities, corresponding to 161,000 dwellings.
During the last ten years, the technical standard of the housing stock has improved significantly due to new construction work, modernisation, urban renewal, and demolition of the poorest dwellings. Since 1991, the number of dwellings with faulty or without installations/facilities has been reduced from 315,000 dwellings to 188,500 dwellings in 2001.
Compared to other countries, the technical standard of the Danish housing stock is very good - particularly because 98 per cent of the housing stock has proper heating supply.
Indicator 14.4:
Amount of green area (km2) accessible to the population in Aalborg and
Copenhagen within a 15-minute walking distance
Source: The Danish Forest and Landscape Research Institute
This indicator elucidates the recreational opportunities offered by cities.
Having green areas within easy distance is important to recreation in everyday life. Studies show that if you do not have a green area within a distance of 500 metres from your home, you will not use it in the course of your everyday life.
The extent of green areas available per capita varies greatly in the Danish towns and cities. A city like Aalborg has ten times more green areas per capita than Copenhagen. This is because Aalborg has large green areas on the outskirts of the city. Having said that, the figure also shows that the inhabitants of Copenhagen have access to more large green areas by percentage than is the case in Aalborg.
If the quality of urban recreation is to be improved, it is important to continue to ensure recreational opportunities in connection with urban renewal and development. Conversions of old commercial areas, urban renewal, etc., offer scope for improving green aspects of densely built-up urban areas.
Indicator 14.5:
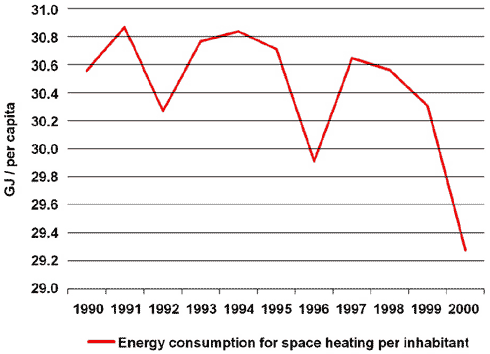
Energy consumption for heating in the city as a whole
Source: The Danish Environmental Protection Agency and Statistics Denmark.
This indicator elucidates energy and resource consumption in dwellings. This figure illustrates energy consumption for heating (of rooms) and electricity per capita from 1990 onwards.
As can be observed, energy consumption has remained relatively constant throughout the ten-year period. During the same period, the built-up area increased by 7.8 per cent, while the population grew by 4 per cent. This means that there has been increased energy efficiency in connection with heating of the housing stock.
There is scope for more efficient energy use within dwellings.
Indicator 14.6:
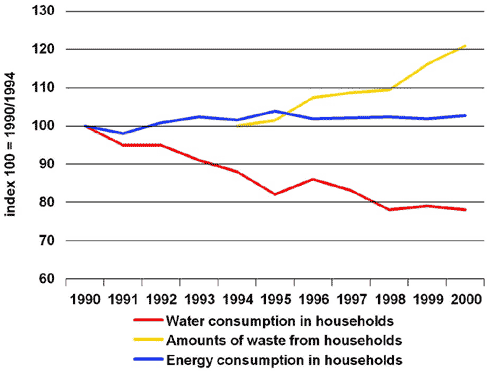
Index for changes in electricity consumption, water consumption and waste volumes in
dwellings/households
Source: The Danish Energy Authority and the Danish Environmental Protection Agency
This indicator elucidates resource consumption in dwellings. The figure shows indices for household water consumption from 1990 to 2000 and waste volumes 1994 to 2000 in thousand tonnes.
There has been a marked decrease in household drinking water consumption. Among other things, this should be seen in light of the fact that the 1993 tax reform included a water tax of DKK 1 per m3 in 1994, which gradually grew to DKK 5 per m3 in 1998. Denmark's water consumption per capita is low compared to other, similar countries. Cf. Vækstvilkår i Danmark from the Danish Ministry of Economic and Business Affairs, May 2002. As can be observed, energy consumption has remained relatively constant throughout a ten-year period. The waste volumes generated by households have increased steadily throughout the period. The increase amounted to 20 per cent, which exceeds the economic growth during the period.
Household water consumption has successfully been reduced, and electricity consumption has been stabilised despite increasing wealth. Waste volumes generated by households have, however, gone up.
Indicator 14.7:
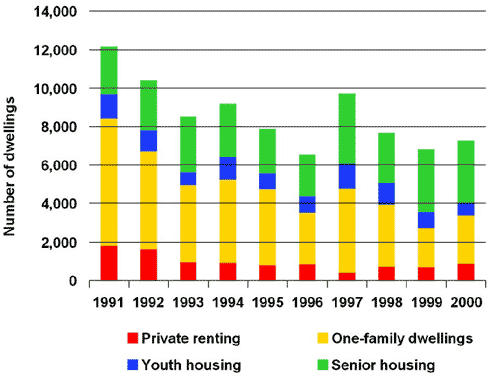
Number of newly erected rented dwellings analysed by housing type
Source: The Danish Agency for Enterprise and Housing
This indicator elucidates the supply of housing. A total of 7,300 rental dwellings were built in 2000. Of these, 900 were private rental dwellings, while 6,400 dwellings were various types of publicly funded housing. In addition to this, 8,000 owneroccupied dwellings were built in 2000 (including cooperative dwellings).
In the last ten years, approximately 8,500 rental dwellings have been erected each year, with fluctuations in 1994, 1996, 1997, and 1999. Overall, there has been a decline in building activity within this area. Throughout the period, private rented dwellings accounted for slightly more than 10 per cent.
The objective is to secure growth in the supply of housing. The Government will ensure that construction of private rental dwellings resumes. Among other things, this will be done by providing pension funds with better opportunities for building and renting dwellings, including youth accommodation in university cities as well as dwellings for the elderly.